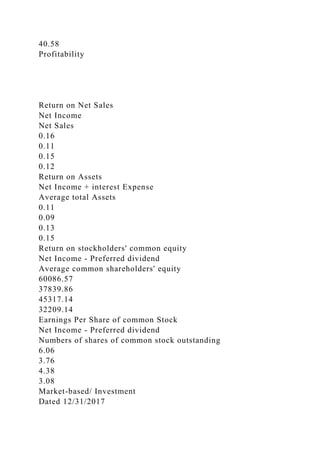
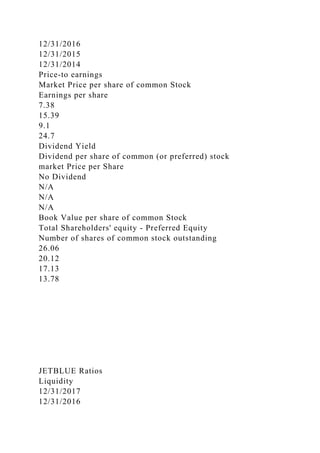
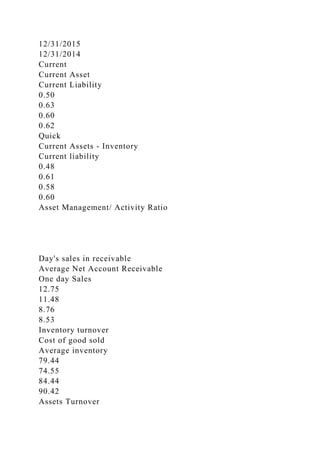
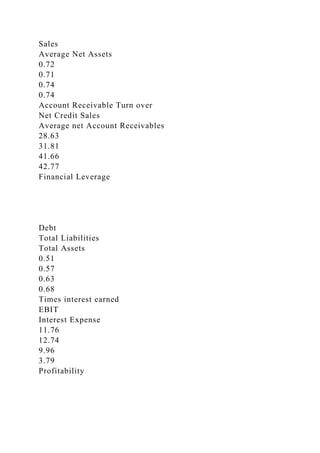
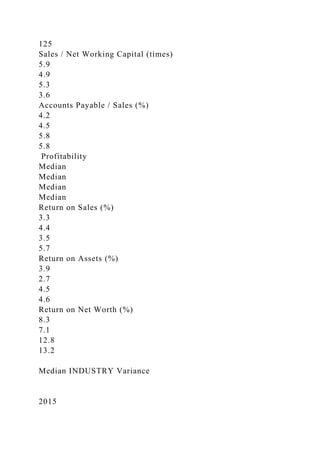
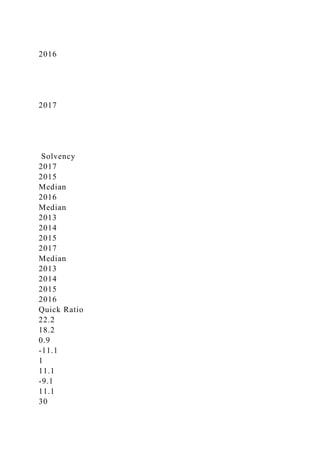
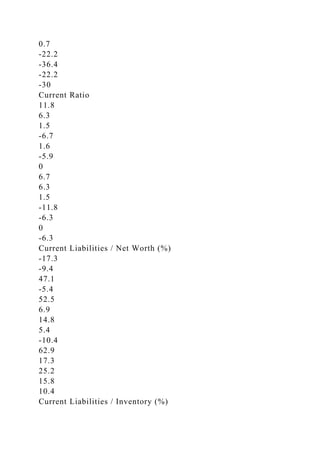
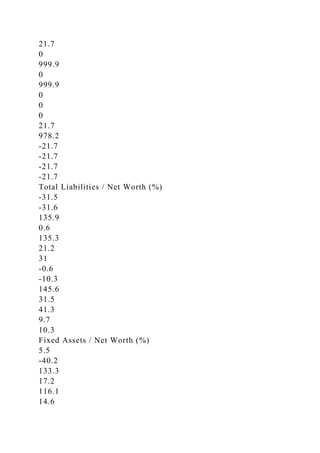
Term Project
Comparative Financial Statement Analysis of Spirit Airlines and Jet Blue, 2015-2017
ACC 770- Managerial Accounting
I. Introduction
II. Business History and Future
a. Industry
b. Spirit Airline
c. JetBlue
III. Financial Analysis
a. Ratio analysis explanation
i. Liquidity ratios
ii. Activity Ratio
iii. Solvency Ratio
iv. Profitability Ratio
b. Horizontal and Vertical Analysis
i. Overview
ii. Complementary application
IV. Liquidity Analysis
a. Industry
b. Spirit Airlines
c. JetBlue
V. Activity Analysis
a. Industry
b. Spirit Airlines
c. JetBlue
VI. Solvency Analysis
a. Industry
b. Spirit Airlines
c. JetBlue
VII. Profitability Analysis
a. Industry
b. Spirit Airlines
c. JetBlue
VIII. Horizontal and Vertical Analysis
IX. Comparative Analysis
a. Creditworthiness analysis
i. Short-term
ii. Long-term
b. Investment attractiveness
c. Recommendations
X. Summary and conclusions
XI. References/ Bibliography
XI. Appendices
Introduction:The report is the partial requirement of Managerial Accounting course. The objective is analyzing and comparing two companies of same industry for the purpose of forming sensible decision bases on financial statements, historical data and market news about its standing.The report has analyzed and compared Spirit airline and JetBlue Airline. The scope of the report is to see the trends of industry thereby, analyze companies position in terms of industry. Moreover, past analysis also provide an assistance in forming recommendations and insight of the particular company.The methodology of entire report is mainly on ratio calculations and its interpretations. Then it provides brief summary of evaluating short term and long term creditworthiness along with the investment attractiveness.The future of airline industry is slightly unpredictable for the perspective of investment, because demand for air tickets is increasing but demand for stocks has decreased overtime. Business History, Overview and FutureIndustry History and Overview:
Since the birth of flight in 1903, air travel has emerged as a crucial means of transportation for people, products and animals. The hundred-plus years following the invention of the first aircraft have brought about a revolution in the way people travel. The airline business is a major industry, relied upon by millions not only for transportation but also as a way of making a living.
In early years, flying was considered a risk endeavor. In 1925, a development of an act “Air Mail Act” bring much revolution in airline industry by allowing the postmaster to contract with private airlines to deliver mail. Shortly thereafter, the Air Commerce Act gave the Secretary of Commerce power to establish airways, certify aircraft, license pilots, and issue and enforce air traffic regulations. The first commercial airlines included Pan American, Western Air Express and Ford Transport Service. Within 10 years, many modern-day airlines, had emerged as major players.
In 1938, Civi.
OUTLINETOPIC ANIMAL TESTING ARGUMENT CON AGAINST You w.docxkarlhennesey
OUTLINE
TOPIC : ANIMAL TESTING
ARGUMENT: CON/ AGAINST
You will use library databases to research your side of the argument. You will then create an outline of your argument of the controversial topic ANIMAL TESTING.
1. Find two to four resources from the library that supports your argument. (CON/AGAINST ARGUMENT )
2. Construct an outline of the main points important to your side of the controversy.
3. Your outline must include a reference page in correct APA format.
Term Project
Comparative Financial Statement Analysis of Spirit Airlines and Jet Blue, 2015-2017
ACC 770- Managerial Accounting
I. Introduction
II. Business History and Future
a. Industry
b. Spirit Airline
c. JetBlue
III. Financial Analysis
a. Ratio analysis explanation
i. Liquidity ratios
ii. Activity Ratio
iii. Solvency Ratio
iv. Profitability Ratio
b. Horizontal and Vertical Analysis
i. Overview
ii. Complementary application
IV. Liquidity Analysis
a. Industry
b. Spirit Airlines
c. JetBlue
V. Activity Analysis
a. Industry
b. Spirit Airlines
c. JetBlue
VI. Solvency Analysis
a. Industry
b. Spirit Airlines
c. JetBlue
VII. Profitability Analysis
a. Industry
b. Spirit Airlines
c. JetBlue
VIII. Horizontal and Vertical Analysis
IX. Comparative Analysis
a. Creditworthiness analysis
i. Short-term
ii. Long-term
b. Investment attractiveness
c. Recommendations
X. Summary and conclusions
XI. References/ Bibliography
XI. Appendices
Introduction:The report is the partial requirement of Managerial Accounting course. The objective is analyzing and comparing two companies of same industry for the purpose of forming sensible decision bases on financial statements, historical data and market news about its standing.The report has analyzed and compared Spirit airline and JetBlue Airline. The scope of the report is to see the trends of industry thereby, analyze companies position in terms of industry. Moreover, past analysis also provide an assistance in forming recommendations and insight of the particular company.The methodology of entire report is mainly on ratio calculations and its interpretations. Then it provides brief summary of evaluating short term and long term creditworthiness along with the investment attractiveness.The future of airline industry is slightly unpredictable for the perspective of investment, because demand for air tickets is increasing but demand for stocks has decreased overtime. Business History, Overview and FutureIndustry History and Overview:
Since the birth of flight in 1903, air travel has emerged as a crucial means of transportation for people, products and animals. The hundred-plus years following the invention of the first aircraft have brought about a revolution in the way people travel. The airline business is a major industry, relied upon by millions not only for transportation but also as a way of making a living.
In early years, flying was considered a risk endeavor. In 1925, a development of an act “Air Mail ...
OUTLINETOPIC ANIMAL TESTING ARGUMENT CON AGAINST You w.docxaman341480
OUTLINE
TOPIC : ANIMAL TESTING
ARGUMENT: CON/ AGAINST
You will use library databases to research your side of the argument. You will then create an outline of your argument of the controversial topic ANIMAL TESTING.
1. Find two to four resources from the library that supports your argument. (CON/AGAINST ARGUMENT )
2. Construct an outline of the main points important to your side of the controversy.
3. Your outline must include a reference page in correct APA format.
Term Project
Comparative Financial Statement Analysis of Spirit Airlines and Jet Blue, 2015-2017
ACC 770- Managerial Accounting
I. Introduction
II. Business History and Future
a. Industry
b. Spirit Airline
c. JetBlue
III. Financial Analysis
a. Ratio analysis explanation
i. Liquidity ratios
ii. Activity Ratio
iii. Solvency Ratio
iv. Profitability Ratio
b. Horizontal and Vertical Analysis
i. Overview
ii. Complementary application
IV. Liquidity Analysis
a. Industry
b. Spirit Airlines
c. JetBlue
V. Activity Analysis
a. Industry
b. Spirit Airlines
c. JetBlue
VI. Solvency Analysis
a. Industry
b. Spirit Airlines
c. JetBlue
VII. Profitability Analysis
a. Industry
b. Spirit Airlines
c. JetBlue
VIII. Horizontal and Vertical Analysis
IX. Comparative Analysis
a. Creditworthiness analysis
i. Short-term
ii. Long-term
b. Investment attractiveness
c. Recommendations
X. Summary and conclusions
XI. References/ Bibliography
XI. Appendices
Introduction:The report is the partial requirement of Managerial Accounting course. The objective is analyzing and comparing two companies of same industry for the purpose of forming sensible decision bases on financial statements, historical data and market news about its standing.The report has analyzed and compared Spirit airline and JetBlue Airline. The scope of the report is to see the trends of industry thereby, analyze companies position in terms of industry. Moreover, past analysis also provide an assistance in forming recommendations and insight of the particular company.The methodology of entire report is mainly on ratio calculations and its interpretations. Then it provides brief summary of evaluating short term and long term creditworthiness along with the investment attractiveness.The future of airline industry is slightly unpredictable for the perspective of investment, because demand for air tickets is increasing but demand for stocks has decreased overtime. Business History, Overview and FutureIndustry History and Overview:
Since the birth of flight in 1903, air travel has emerged as a crucial means of transportation for people, products and animals. The hundred-plus years following the invention of the first aircraft have brought about a revolution in the way people travel. The airline business is a major industry, relied upon by millions not only for transportation but also as a way of making a living.
In early years, flying was considered a risk endeavor. In 1925, a development of an act “Air Mail .
A Study on Aviation Industry (InterGlobe Aviation Ltd & Spicejet Ltd)Anant Kumar Behera
This document is a project report on a study of the aviation industry in India, focusing on InterGlobe Aviation Ltd and SpiceJet Ltd. It includes an overview of the global and Indian aviation industries, profiles of the two companies, data analysis and interpretation of their performance, and conclusions and recommendations from the study.
I. Critically discuss the changes that Qantas implemented to become one of the profitable airlines in the world.
II. Identify the development features and evaluate their impact on Qantas success.
III. What challenges will Qantas will face in the 21 century? What change initiatives would you recommend for Qantas?
Read Case 10 Southwest Airlines. Answer questions 1-4 in a three.docxcatheryncouper
Read Case 10: Southwest Airlines. Answer questions 1-4 in a three to five page APA style paper, and supported with the concepts outlined in your text and from your previous classes.
1. Describe the current state of the airline industry and analyze what an airline can do to be successful in the current industry climate.
2. Perform a SWOT analysis for Southwest Airlines.
3. Assess the competitive position of Southwest Airlines by completing a competitor profile for Southwest airlines and at least two of its major competitors.
4. What alternatives does Southwest Airlines face to address the problem of declining financial performance?
Southwest Airlines 2008
1 In 2008, Southwest Airlines (Southwest), the once scrappy underdog in the U.S. airline industry, carried more domestic passengers than any other U.S. airline. The company, unlike all of its major competitors, had been consistently profitable for decades and had weathered recessions, energy crises, and the September 11 terrorist attacks. In the first quarter of 2008, the company was profitable and experienced record first quarter revenue and a record pas- senger load factor (percentage of available seats sold). However, the earnings release made it clear that the “threat of volatile and unprecedented jet fuel prices” was a major issue that threatened future growth. Operating expenses were rising, and Southwest announced that it would cut 2009 growth in available seats to less than 3%. Over the previous decade, growth had been about 5–10% a year. This cut in planned growth was consistent with previous responses to difficult environments. An insight into Southwest’s operating philosophy can be found in the company’s 2001 Annual Report:
Southwest was well poised, financially, to withstand the potentially devastating hammer blow of September 11. Why? Because for several decades our leadership philosophy has been: We manage in good times so that our Company and our People can be job secure and prosper through bad times. . . . Once again, after September 11, our philosophy of managing in good times so as to do well in bad times proved a marvelous prophylactic for our Employees and our Shareholders.
THE U.S. AIRLINE INDUSTRY
The U.S. commercial airline industry was permanently altered in October 1978 when Presi- dent Carter signed the Airline Deregulation Act. Before deregulation, the Civil Aeronautics Board regulated airline route entry and exit, passenger fares, mergers and acquisitions, aattract and retain the world’s top talent have combined to create a combination of path-dependent resources that are very difficult for even the wealthiest software and Internet companies worldwide to easily emulate, acquire, or accelerate. It will take years for any competitor to develop the expertise, infrastructure, reputation, and capabilities to compete effectively with Google. Coca-Cola’s brand name, Gerber Baby Food’s reputation for quality, and Steinway’s exper- tise in piano manufacture would ta ...
British Airways is the largest international airline in the world based in London. It was formed through the merger of multiple smaller airlines starting in the early 20th century. British Airways' earliest predecessor was founded in 1916 and inaugurated the world's first international air service in 1919. Through further mergers and reorganizations, British Overseas Airways Corporation (BOAC) was formed in 1939. BOAC served as Britain's national carrier for overseas routes.
- The airline industry faced many challenges both before and after 9/11, including revenue drops, bankruptcies, and high leverage.
- 9/11 had a devastating immediate impact, grounding all flights for 3 days and causing long-term declines in travel due to fears.
- Both major airlines and low-cost carriers struggled in this new environment of high fuel costs, economic downturns, and less flying. The industry faced pressure to consolidate and restructure to improve long-term sustainability.
Herbert Kelleher started Southwest Airlines in 1967 in Texas and served as CEO until 2007. Southwest pioneered the low-cost carrier model, offering low fares without frills like meals or assigned seating. It has grown to be the largest airline in the U.S. in terms of passengers carried annually. Southwest focuses on providing low-cost, high-frequency, point-to-point service on Boeing 737 aircraft between major cities within the U.S.
Develop a detailed outline for the data collection plan to include .docxbradburgess22840
The document outlines the requirements for a data collection plan, including obtaining permissions, proposing a sampling approach, outlining the collection steps for each instrument and data source, and including a data management plan. It also instructs to incorporate feedback to revise the sources of data/instruments and data collection sections of a prospectus.
Develop a 3–4 page research paper based on a selected case study rel.docxbradburgess22840
Develop a 3–4 page research paper based on a selected case study related to reproductive choices. Since the processes of reproduction and birth represent one of the potential biological outcomes of heterosexual activity, it is important to examine the biological foundations of human sexuality. This includes knowledge of fertilization and early development, including some of the most recent findings. There is more than a litany of birth control methods; this assessment offers a sound basis for understanding the issues to be weighed in personal decision making about contraception and abortion, which continue to generate debate and controversy.
By successfully completing this assessment, you will demonstrate your proficiency in the following course competencies and assessment criteria:
Competency 1: Apply psychological theories to topics in human sexuality.
Apply psychological theories to a case study in human sexuality.
Competency 2: Apply scholarly research findings to topics in human sexuality.
Apply scholarly research findings to a case study in human sexuality.
Competency 3: Explain how ethics inform professional behavior in the field of human sexuality.
Explain how ethics inform professional behavior in the field of human sexuality.
Competency 4: Communicate in a manner that is scholarly, professional, and consistent with expectations for professionals in the field of psychology.
Write coherently to support a central idea with correct grammar, usage, and mechanics as expected of a psychology professional.
Use APA format and style.
APA Resources
Because this is a psychology course, you need to format this assessment according to APA guidelines. Additional resources about APA can be found in the Research Resources in the left navigation menu of your courseroom. Use the resources to guide your work as needed.
American Psychological Association. (2010).
Publication manual of the American Psychological Association
(6th ed.). Washington, DC: Author.
Available from the
bookstore
.
APA Paper Template [DOCX]
.
Required Resources
The following resource is required to complete the assessment.
Human Sexuality Case Studies: Sexuality Confronts Social Policy
|
Transcript
.
Suggested Resources
The resources provided here are optional and support the assessment. They provide helpful information about the topics. You may use other resources of your choice to prepare for this assessment; however, you will need to ensure that they are appropriate, credible, and valid. The
PSYC-FP2800 – Introduction to Human Sexuality Library Guide
can help direct your research. The Supplemental Resources and Research Resources, both linked from the left navigation menu in your courseroom, provide additional resources to help support you.
Human Sexuality and Reproductive Choices
Kelly, G. F. (2015).
Sexuality today
(11th ed.). New York, NY: McGraw-Hill.
Available from the
bookstore
.
Chapter 10, "Reprod.
Develop a 5- to 6-slide PowerPoint presentation for a staff meet.docxbradburgess22840
Develop a 5- to 6-slide PowerPoint presentation for a staff meeting that addresses the following:
Identify your selected transition of care. ------" Transitions of care” refer to the movement of patients between health care practitioners, settings, and home as their condition and care need change. For example, a patient might receive care from a primary care physician or specialist in an outpatient setting, then transition to a hospital physician and nursing team during an inpatient admission before moving on to yet another care team at a skilled nursing facility. Finally, the patient might return home, where he or she may receive care from a visiting nurse or support from a family member or friend.
Explain how you, as a nurse leader, along with your healthcare team, would apply systems thinking when providing a transition of care aligned with the IHI Quadruple Aim framework in order to improve it. Explain what the fourth aim in your strategy would be and why.
These are the four areas:
Experience of care
Population health
Per capita cost
Care team well-being
Describe the key stakeholders that might be involved in this transition of care and how you would engage and influence them to improve the transition of care processes.
Explain how systems thinking would inform your improvement plan for your transition of care.
.
Develop a 5–10-year strategic plan for achieving specific health.docxbradburgess22840
Develop a 5–10-year strategic plan for achieving specific health care quality and safety improvements, based on the analysis you completed in Assessment 1. Use either an AI approach or your SWOT analysis and a chosen strategic planning model.
Note:
Each assessment in this course builds on the work you completed in the previous assessment. Therefore, you must complete the assessments in this course in the order in which they are presented.
SHOW LESS
Evaluation of strategic choices is important. The methods for selecting strategic alternatives help leaders organize significant issues to support decision making. However, it is important that the techniques do not make the decision. Rather, leaders should use the techniques to reveal the inherent situation and to organize their thought processes. This assessment provides you with an opportunity to evaluate and apply some of the techniques for successful strategy development and implementation.
By successfully completing this assessment, you will demonstrate your proficiency in the following course competencies and assessment criteria:
Competency 1: Evaluate qualities and skills that promote effective leadership within health care organizations.
Evaluate the leadership qualities and skills that will be most important to successfully implementing a strategic plan and sustaining strategic direction.
Competency 2: Apply strategies to lead high-performing health care teams to meet organizational quality and safety goals.
Develop strategic goal statements and outcomes that support the achievement of specific quality and safety improvements for a care setting.
Justify the relevance of proposed strategic goals and outcomes in relation to the mission, vision, and values of a care setting.
Competency 3: Apply cultural, ethical, and regulatory considerations to leadership decision making.
Analyze the extent to which strategic goals and outcomes address the use of technology and the ethical, cultural, and regulatory environments.
Competency 4: Integrate leadership and health care theories into the role of the nurse leader.
Explain how relevant leadership and health care theories will be used to help achieve proposed strategic goals and objectives.
Competency 5: Communicate with stakeholders and constituencies to build collaborative partnerships and create inclusive work environments.
Communicate analyses clearly and in a way that demonstrates professionalism and respect for stakeholders and colleagues.
Integrate relevant and credible sources of evidence to support assertions, correctly formatting citations and references using APA style.
Suggested Resources
The resources provided here are optional. You may use other resources of your choice to prepare for this assessment; however, you will need to ensure that they are appropriate, credible, and valid. The
MSN-FP6210: Leadership and Management for Nurse Executives Library Guide
can help direct your res.
Develop a 2–4-page proposal for a policy that should help to imp.docxbradburgess22840
Develop a 2–4-page proposal for a policy that should help to improve health care and outcomes for your target population.
Note
: Each assessment in this course builds on the work you completed in the previous assessment. Therefore, you must complete the assessments in this course in the order in which they are presented.
Cost and access to care continue to be main concerns for patients and providers. As technology improves our ability to care for and improve outcomes in patients with chronic and complex illnesses, questions of cost and access become increasingly important. As a master’s-prepared nurse, you must be able to develop policies that will ensure the delivery of care that is effective and can be provided in an ethical and equitable manner.
SHOW LESS
By successfully completing this assessment, you will demonstrate your proficiency in the following course competencies and assessment criteria:
Competency 1: Design evidence-based advanced nursing care for achieving high-quality population outcomes.
Propose a policy and guidelines that will lead to improved outcomes and quality of care for a specific issue in a target population.
Competency 2: Evaluate the efficiency and effectiveness of interprofessional interventions in achieving desired population health outcomes.
Analyze the potential for an interprofessional approach to implementing a proposed policy to increase the efficiency or effectiveness of the care setting to achieve high quality outcomes.
Competency 3: Analyze population health outcomes in terms of their implications for health policy advocacy.
Advocate the need for a proposed policy in the context of current outcomes and quality of care for a specific issue in a target population.
Competency 4: Communicate effectively with diverse audiences, in an appropriate form and style, consistent with organizational, professional, and scholarly standards.
Communicate proposal in a professional and persuasive manner, writing content clearly and logically with correct use of grammar, punctuation, and spelling.
Integrate relevant sources to support assertions, correctly formatting citations and references using APA style.
CONTEXT:
As a master's-prepared nurse, you have a valuable viewpoint and voice with which to advocate for policy developments. As a nurse leader and health care practitioner, often on the front lines of helping individuals and populations, you are able to articulate and advocate for the patient more than any other professional group in health care. This is especially true of populations that may be underserved, underrepresented, or are otherwise lacking a voice. By advocating for and developing policies, you are able to help drive improvements in outcomes for specific populations. The policies you advocate for could be internal ones (just within a specific department or health care setting) that ensure quality care and compliance. Or they could be external policies (local, st.
Develop a 10- to 12- slide PowerPoint Presentation designed for .docxbradburgess22840
Develop a 10- to 12- slide PowerPoint Presentation designed for training the staff at a local high school. The PowerPoint Presentation should focus on strategies that promote communication skills among adolescents.
Students are encouraged to approach the assignment creatively, adding graphics, visuals, charts and/or graphs to their work. Slides should be designed to address the selected topic clearly and concisely. Each slide should be developed with professional presentation style (e.g., bulleted items in brief statements rather than complete sentences). Notes should complement the slides and provide details useful to the speaker if an oral presentation were to be given.
Creating the PowerPoint Presentation
The PowerPoint Presentation:
Must be 10 to 12 slides, and formatted according to APA style as outlined by the Ashford Writing Center.
Must include a title slide with the following:
Title of the training
Student’s name
Course name and number
Instructor’s name
Date submitted
Must present a thesis statement regarding why social skills training would be appropriate for adolescents.
Must explain different types of communication (e.g., aggressive and assertive).
Must share four strategies on how adolescents could improve their communication skills.
Must create at least three hypothetical scenarios of problems that adolescents might encounter, including one that involves cultural/ethnic issues. The scenarios should show how adolescents could use improved communication skills to solve these problems.
Must develop conclusions that reiterate the opening thesis statement, include a summary of the social skills training discussed, and offer evidence of its effectiveness.
Must use at least four scholarly sources (in addition to the course text), including a minimum of two from the Ashford Online Library. References are to be provided as needed within the slides.
Must include a separate reference slide, formatted according to APA style as outlined in the Ashford Writing Center.
.
DetailsPlease answer the following questions. 1. Desc.docxbradburgess22840
Meiosis involves two rounds of cell division that result in four haploid cells from one diploid cell. A cross between a GgBb male and GgBb female would result in a 1:1:1:1 ratio of offspring with green/black, green/brown, purple/black, and purple/brown phenotypes according to a Punnett square. A mating between a normal female and hemophilic male would result in all male offspring being hemophilic according to a Punnett square, with 50% of total offspring being hemophilic. Linked genes are located close together on the same chromosome and may not assort independently during meiosis, but they are not an exception to Mendel's law of
Despite the literature supporting technology use in schools as ben.docxbradburgess22840
Despite the literature supporting technology use in schools as beneficial for students, and despite the wide use of social technology, schools continue to be slow to change its integration in the classroom (Livingstone, 2012). It is imperative that teachers increase their use of technology in the classroom in order to prepare our K-12 students referred to as "digital natives," for the 21st century. Though many schools have technology available for use (Alger & Kopcha, 2008), barriers exist in incorporating technology into lesson plans, namely teacher reluctance (Keengwe, Onchwari, & Wachira, 2008). Teachers' hesitation in using technology more frequently is due to a number of factors, such as lack of time to learn new technology and incorporate it into lesson plans, beliefs around using technology in instruction, availability of working technology and technical support, comprehensive professional development, and a culture that promotes using new technology, self-efficacy, and teaching methods (Alger & Kopcha, 2008).
Literature Review
Self-Efficacy toward Technology
According to Bandura (1986) individuals possess a self-system that determines how much effort people will expend on any activity. Bandura also asserts that self-efficacy beliefs may be a strong predictor of related performance. Studies have shown a positive correlation between self-efficacy in technology and technology ability (Anderson & Maninger, 2007; Anderson, Grouulx, & Maninger, 2011). According to the technology acceptance model introduced by Davis (1989), there is a correlation between users' perceived ease of use and predicted adoption of technology. In his study investigating Moodles, Yeou (2016) found self-efficacy to be a critical factor in undergraduates' use of the technology tool. In a similar study investigating pre-service teachers, Albion (2001) found that self-efficacy was the most significant factor in predicting technology use. Pre-service and in-service teachers who possess high self-efficacy in regard to technology are more apt to use technology in the classroom because they are more confident in their ability. In their study investigating teachers' use of technology, Holden and Rada (2011) found that self-efficacy directly influenced individuals' ease of use and usability of technology.
Need for Technology Integration
With the adoption of the National Education Technology Plan (NETP), providing access to technology is no longer sufficient; the NETP stresses that schools are expected to ensure "all students understand how to use technologies as a tool to engage in creative, productive, lifelong learning" (p. 16 Herold, 2016). A key element in the plan is the need to move from passive to active use of technology. Often referred to as the "digital use and divide," a gap exists between learners who are using technology in active, creative ways to support their learning and those who predominantly use technology for passive content consumption.
To develop .
This document contains notifications from Sakai's version control system about recent changes made in Source code repositories. It describes 14 separate revisions made between January 4th and 5th, 2008. The revisions include changes to code related to gradebook, site management, messaging, and other tools.
Description:
Ch .17:
Newborn transitioning
Ch. 18:
Nursing management of the
newborn
Ch.19:
Nursing Management at risk:
Pregnancy-related complications
Ch.20:
Nursing Management of the
Pregnancy at Risk: Health
conditions and vulnerable populations
Ch. 21:
Nursing management of
labor and birth at risk
Ch. 22:
Nursing management of the
postpartum woman at risk
.
Description of the assignment The following 4 men created a p.docxbradburgess22840
Description of the assignment:
The following 4 men created a paradigm shift within Western culture: Luther, Columbus, Gutenberg, and Charles Darwin. In this assignment, explain which one of these you deem to have had the most influence on Western culture. Provide concrete reasons that clarify your position. If you include sources, cite them in current APA format. This assignment must be 250–300 words and must include the word count in parentheses. S
.
Description of the AssignmentThis assignment presents a mo.docxbradburgess22840
Description of the Assignment
This assignment presents a modified method for conducting a concept analysis of
one
concept that is important and useful to the nurse practitioner role. The concept for this assignment must be supported by a published
nursing
theory. The selected concept is identified and then the elements of the analysis process are applied in order to synthesize knowledge for application as demonstrated through the creation of a model case. Theoretical applications of the concept are also discussed. Non-nursing theories may
not
be used. Scholarly literature is incorporated throughout the analysis.
Only the elements identified in this assignment should be used for this concept analysis.
Possible Concepts:
The following concepts are not required; students may select one of these concepts or find another concept. Each selected concept must be associated with a nursing theory; the use of non-nursing theories is
not
allowed. If you have any questions regarding your concept or the nursing theory, please consult with your faculty member for assistance.
Please note: the concepts of caring or cultural humility are not permitted for this assignment.
Adaptation
Burnout
Civility
Comfort
Compassion
Compassion fatigue
Competence
Empowerment
Engagement
Health
Leadership
Meaningfulness
Modeling
Noise
Pain
Palliative care
Quality of life
Resilience
Self-care
Sensory overload
Situational awareness
Criteria for Content
Definition/Explanation of the selected nursing concept
Defines/explains the concept using scholarly literature (a dictionary maybe used for this section
only
)
Support from nursing literature is required.
2.
Defining attributes:
A minimum of
three (3)
attributes are required.
Support from nursing literature is required.
Explanation: An attribute identifies characteristics of a concept. For this question, the characteristics of the selected nursing concept are identified and discussed.
Antecedent and Consequence
1 antecedent
of the selected nursing concept.
1 consequence
of the selected nursing concept.
Support from nursing literature is required.
Explanation:
An antecedent is an identifiable occurrence that happens before an event. An antecedent precedes a selected nursing concept. A consequence follows or is the result of an event. The selected consequence follows or is the result of the selected nursing concept.
4.
Model Case
1 Model Case
is created by the student and discussed substantively by demonstrating within the case each of the following areas:
Definition
All identified attributes
Theoretical Applications of the Concept
Explain how the concept applies to the selected nursing theory.
Support from nursing literature is required.
Reflection
Reflect on how the concept analysis findings apply to your advanced nursing practice, specifically as an NP.
Self-reflection may be written in first-person.
Preparing the Assi.
Description of theNationalMilitary Strategy2018.docxbradburgess22840
Description of the
National
Military
Strategy
2018
The Joint Staff
1
Overview
The 2018 National Military Strategy (NMS) provides the
Joint Force a framework for protecting and advancing U.S.
national interests. Pursuant to statute, it reflects a
comprehensive review conducted by the Chairman with the
other members of the Joint Chiefs of Staff and the unified
combatant commanders.
As an overarching military strategic framework, this
strategy implements the substantial body of policy and
strategy direction provided in the 2017 National Security
Strategy, the 2018 National Defense Strategy (NDS), the
Defense Planning Guidance (DPG), and other documents.
The 2018 NMS provides the Chairman’s military advice for
how the Joint Force implements the defense objectives in
the NDS and the direction from the President and the
Secretary of Defense.
The 2018 NMS also reflects lessons learned from
implementing global integration over the last two years. The
strategy articulates a continuum of strategic direction to
frame global integration into three strategy horizons to meet
the challenges of the existing and future security
environment. Force employment addresses planning, force
management, and decisionmaking to fulfill the defense
objectives of the NDS. Force development adapts functions,
capabilities, and concepts to improve the current Joint
Force. Force design innovates to enable the Joint Force to
do what it does differently to retain a competitive advantage
against any adversary.
The vision of the Joint Force articulated in the 2018 NMS is
a Joint Force capable of defending the homeland and
projecting power globally, now and into the future.
2
Strategic Approach
From its global perspective, the NMS premises an adaptive
and innovative Joint Force capable of employing its
capabilities seamlessly across multiple regions and all
domains -- continuing the transition from a regional to a
global mindset and approach.
This strategy
anchors its
approach against a
set of clearly
identified security
trends outlined in
the NDS (see inset).
These trends,
especially those
posed by the
reemergence of
great power
competition with China and Russia, represent the most
difficult challenges facing the Joint Force. However, the full
scope of global integration must recognize uncertainty and
be vigilant for emerging threats to the security and interests
of the United States, its allies and partners. In a security
environment where the homeland is no longer a sanctuary
and every operating domain is contested, competitors and
adversaries will continue to operate across geographic
regions and span multiple domains to offset or erode Joint
Force advantages.
To achieve military advantage over competitors and
adversaries, the NMS introduces the notion of joint
combined arms, defined as the conduct of operational art
through the integration of joint capabilities.
Description This is a 4 page paper about either a creative genius o.docxbradburgess22840
Description: This is a 4 page paper about either a creative genius of your choosing (Thomas Edison? Einstein? Michelangelo? Beyonce? Lucille Ball?) or a creative business (DuPont, Corning, IDEO? Pixar?). You can either read a full biography or research the person or organization using several sources. The paper should include: Description and background of the person/organization, 2) why you chose him/her/it, 3) what this person/org achieved (briefly), 4) how he/she/it fuels their creativity (his or her own, or if a company, its workforce) and 5) include a self reflection. Knowing what they do, what are some things YOU DO to fuel your creativity? What else could you do going forward? . #4 and #5 are most important. At the end of the paper, summarize by listing at least ten to fifteen things that this individual did to fuel his/her/its creativity. Here are some examples:
Da Vinci kept journals and notebooks. He dissected eyes and other body parts. He learned many mediums - painting sculpting, etc.
Ian Flemming (author), designed golf courses in his spare time.
Steven Hillenburg, the creator of Spongebob, had been a marine biology professor who had a keen interest in art and began drawing visual images for his student which he then began animating. He continuously worked on acquiring new skills. He watched old movies.
Beyonce learned dressmaking from her mom, who designed all of her early costumes. Her mom had sewn clothing for priests and nuns in exchange for Beyonce’s tuition.
Etsy has employee-led workshops where associates teach others their hobbies, and they regularly engage their shop owners in planning
The important thing about this project is that you learn and be able to share not just what they achieved, but what they did to nurture their creativity. You must include sources.
.
Describe your experience with electronic healthmedical record.docxbradburgess22840
Describe your experience with electronic health/medical records (EHR/EMR).
Have you used a health care IT system as a patient/provider? If yes, what system(s) did you use?
What were your impressions of the system?
Did you find it user-friendly?
Did you have concerns about privacy/security?
Did it seem to make health care seeking/delivery easier or more burdensome?
.
Description Develop a paper describing how the knowledge, skill.docxbradburgess22840
Description:
Develop a paper describing how the knowledge, skills, or theories
of this course
have been applied or could be applied, in a practical manner to your current work environment. If you are not currently working, share times when you have or could observe these theories and knowledge applied to an employment opportunity in your field of study.
Requirements:
Provide a >500 word (2 or more pages) paper (excluding title and reference pages in page count). The paper should include a title page, body (include Introduction and Conclusion sections), and a reference page. An abstract is not required for this assignment. Use proper APA formatting of the entire paper including sources on the reference page and citations in the body of the paper.
.
Describing Research FindingsResearchers take many steps to p.docxbradburgess22840
Describing Research Findings
Researchers take many steps to prepare, organize, and analyze research data. In this discussion, you will examine the importance of taking a systematic approach to describing research findings. Be sure to address the following in your main post:
What is the purpose of computing descriptive statistics and exploratory analyses?
Why should researchers graph their data? What are the benefits of graphing?
How might you assess the distribution of data?
What does the “spread” of data tell us?
What does Pearson
r
tell us about two variables?
.
Description I. Introduction A. Summarize the client. What is the rat.docxbradburgess22840
Description I. Introduction A. Summarize the client. What is the rationale for seeking counseling?
II. Biopsychosocial Summary
A. Describe the problem that brought the client to treatment. i. Make sure to address any problems, issues, or challenges the client may be facing.
B. Explain the symptoms affecting the client. i. What are the behavioral symptoms? ii. What are the cognitive symptoms? iii. What are the emotional symptoms? iv. What are the physiological symptoms?
C. Identify any environmental factors that may be contributing to the client's problem.
D. Identify any potential harmful behavior: i. Aggression ii. Harm to others iii. Harm to self iv. Criminal activity v. Impulsive behaviors vi. High-risk activity
E. Determine if the client has a family history of the diagnosis. Consider how this may affect the client. F. Use evidence-based research to support the biological factors presented in the case.
G. Outline how the client identifies him- or herself in regard to cultural characteristics. Make sure to add rationale for any answers that are not straightforward. i. What are the addressing factors?
a. Age and generational influences
b. Developmental disabilities (acquired at birth or during childhood)
c. Disabilities acquired later in life (e.g., traumatic brain injury, multiple sclerosis, stroke)
d. Religion and spirituality
e. Ethnic and racial identity
f. Socioeconomic status
g. Sexual orientation
h. Indigenous heritage
i. National origin j. Gender
H. Summarize how the client culturally identifies him- or herself.
i. With the identifiers above, how does the client culturally identify him- or herself? ii. What is the order of importance for the client? Assessment III. Co-occurring Disorders
A. Identify any co-occurring disorders. B. Describe the initial DSM diagnosis. i. What is the overall descriptor of the diagnosis? ii. What criteria must be met to meet the diagnosis? iii. Describe which client behaviors are being used to meet the diagnostic criteria.
C. Discuss the rationale behind the diagnosis. i. Identify what other diagnoses should be ruled out. Make sure to provide rationale. ii. Identify limitations with this diagnosis. Make sure to provide rationale.
D. Use evidence-based research to support your justification. IV. Addiction Assessments
A. Describe how the assessment was administered.
B. Describe the assessment scoring.
C. Summarize the assessment results.
i. How do you interpret the results? Plan V. Recommendations
A. Summarize what you recommend for this client based on the information collected.
i. Describe what you recommend for recovery.
ii. Describe what you recommend for relapse prevention.
resources you would provide to the client. Rubric Guidelines for Submission: Consider using the headings from the critical elements outlined above when drafting your DAP note, as you will do this when you submit for your final project. You may also consider using double spac.
Describes the use of Computers in Nursing in general clearly and com.docxbradburgess22840
Describes the use of Computers in Nursing in general clearly and comprehensively.
Address the significance of Computers, attributes of Computers (i.e., accuracy, cost, accessibility, etc.), and provide specific examples with rationale of situations in which Computers as an educational tool would provide advantages as well as disadvantages.
Relate the use of Computers to the appropriate professional standards and competencies.
.
ISO/IEC 27001, ISO/IEC 42001, and GDPR: Best Practices for Implementation and...PECB
Denis is a dynamic and results-driven Chief Information Officer (CIO) with a distinguished career spanning information systems analysis and technical project management. With a proven track record of spearheading the design and delivery of cutting-edge Information Management solutions, he has consistently elevated business operations, streamlined reporting functions, and maximized process efficiency.
Certified as an ISO/IEC 27001: Information Security Management Systems (ISMS) Lead Implementer, Data Protection Officer, and Cyber Risks Analyst, Denis brings a heightened focus on data security, privacy, and cyber resilience to every endeavor.
His expertise extends across a diverse spectrum of reporting, database, and web development applications, underpinned by an exceptional grasp of data storage and virtualization technologies. His proficiency in application testing, database administration, and data cleansing ensures seamless execution of complex projects.
What sets Denis apart is his comprehensive understanding of Business and Systems Analysis technologies, honed through involvement in all phases of the Software Development Lifecycle (SDLC). From meticulous requirements gathering to precise analysis, innovative design, rigorous development, thorough testing, and successful implementation, he has consistently delivered exceptional results.
Throughout his career, he has taken on multifaceted roles, from leading technical project management teams to owning solutions that drive operational excellence. His conscientious and proactive approach is unwavering, whether he is working independently or collaboratively within a team. His ability to connect with colleagues on a personal level underscores his commitment to fostering a harmonious and productive workplace environment.
Date: May 29, 2024
Tags: Information Security, ISO/IEC 27001, ISO/IEC 42001, Artificial Intelligence, GDPR
-------------------------------------------------------------------------------
Find out more about ISO training and certification services
Training: ISO/IEC 27001 Information Security Management System - EN | PECB
ISO/IEC 42001 Artificial Intelligence Management System - EN | PECB
General Data Protection Regulation (GDPR) - Training Courses - EN | PECB
Webinars: https://pecb.com/webinars
Article: https://pecb.com/article
-------------------------------------------------------------------------------
For more information about PECB:
Website: https://pecb.com/
LinkedIn: https://www.linkedin.com/company/pecb/
Facebook: https://www.facebook.com/PECBInternational/
Slideshare: http://www.slideshare.net/PECBCERTIFICATION
Assessment and Planning in Educational technology.pptxKavitha Krishnan
In an education system, it is understood that assessment is only for the students, but on the other hand, the Assessment of teachers is also an important aspect of the education system that ensures teachers are providing high-quality instruction to students. The assessment process can be used to provide feedback and support for professional development, to inform decisions about teacher retention or promotion, or to evaluate teacher effectiveness for accountability purposes.
This presentation was provided by Steph Pollock of The American Psychological Association’s Journals Program, and Damita Snow, of The American Society of Civil Engineers (ASCE), for the initial session of NISO's 2024 Training Series "DEIA in the Scholarly Landscape." Session One: 'Setting Expectations: a DEIA Primer,' was held June 6, 2024.
How to Manage Your Lost Opportunities in Odoo 17 CRMCeline George
Odoo 17 CRM allows us to track why we lose sales opportunities with "Lost Reasons." This helps analyze our sales process and identify areas for improvement. Here's how to configure lost reasons in Odoo 17 CRM
Executive Directors Chat Leveraging AI for Diversity, Equity, and InclusionTechSoup
Let’s explore the intersection of technology and equity in the final session of our DEI series. Discover how AI tools, like ChatGPT, can be used to support and enhance your nonprofit's DEI initiatives. Participants will gain insights into practical AI applications and get tips for leveraging technology to advance their DEI goals.
Main Java[All of the Base Concepts}.docxadhitya5119
This is part 1 of my Java Learning Journey. This Contains Custom methods, classes, constructors, packages, multithreading , try- catch block, finally block and more.
The simplified electron and muon model, Oscillating Spacetime: The Foundation...RitikBhardwaj56
Discover the Simplified Electron and Muon Model: A New Wave-Based Approach to Understanding Particles delves into a groundbreaking theory that presents electrons and muons as rotating soliton waves within oscillating spacetime. Geared towards students, researchers, and science buffs, this book breaks down complex ideas into simple explanations. It covers topics such as electron waves, temporal dynamics, and the implications of this model on particle physics. With clear illustrations and easy-to-follow explanations, readers will gain a new outlook on the universe's fundamental nature.
Thinking of getting a dog? Be aware that breeds like Pit Bulls, Rottweilers, and German Shepherds can be loyal and dangerous. Proper training and socialization are crucial to preventing aggressive behaviors. Ensure safety by understanding their needs and always supervising interactions. Stay safe, and enjoy your furry friends!
This presentation includes basic of PCOS their pathology and treatment and also Ayurveda correlation of PCOS and Ayurvedic line of treatment mentioned in classics.
A workshop hosted by the South African Journal of Science aimed at postgraduate students and early career researchers with little or no experience in writing and publishing journal articles.
This slide is special for master students (MIBS & MIFB) in UUM. Also useful for readers who are interested in the topic of contemporary Islamic banking.
How to Add Chatter in the odoo 17 ERP ModuleCeline George
In Odoo, the chatter is like a chat tool that helps you work together on records. You can leave notes and track things, making it easier to talk with your team and partners. Inside chatter, all communication history, activity, and changes will be displayed.
A review of the growth of the Israel Genealogy Research Association Database Collection for the last 12 months. Our collection is now passed the 3 million mark and still growing. See which archives have contributed the most. See the different types of records we have, and which years have had records added. You can also see what we have for the future.
Term ProjectComparative Financial Statement Analysis of Spir.docx
1. Term Project
Comparative Financial Statement Analysis of Spirit Airlines and
Jet Blue, 2015-2017
ACC 770- Managerial Accounting
I. Introduction
II. Business History and Future
a. Industry
2. b. Spirit Airline
c. JetBlue
III. Financial Analysis
a. Ratio analysis explanation
i. Liquidity ratios
ii. Activity Ratio
iii. Solvency Ratio
iv. Profitability Ratio
b. Horizontal and Vertical Analysis
i. Overview
ii. Complementary application
IV. Liquidity Analysis
a. Industry
b. Spirit Airlines
c. JetBlue
V. Activity Analysis
a. Industry
b. Spirit Airlines
c. JetBlue
VI. Solvency Analysis
a. Industry
b. Spirit Airlines
c. JetBlue
VII. Profitability Analysis
a. Industry
b. Spirit Airlines
c. JetBlue
VIII. Horizontal and Vertical Analysis
IX. Comparative Analysis
a. Creditworthiness analysis
i. Short-term
ii. Long-term
b. Investment attractiveness
c. Recommendations
X. Summary and conclusions
XI. References/ Bibliography
3. XI. Appendices
Introduction:The report is the partial requirement of Managerial
Accounting course. The objective is analyzing and comparing
two companies of same industry for the purpose of forming
sensible decision bases on financial statements, historical data
and market news about its standing.The report has analyzed and
compared Spirit airline and JetBlue Airline. The scope of the
report is to see the trends of industry thereby, analyze
companies position in terms of industry. Moreover, past
analysis also provide an assistance in forming recommendations
and insight of the particular company.The methodology of
entire report is mainly on ratio calculations and its
interpretations. Then it provides brief summary of evaluating
short term and long term creditworthiness along with the
investment attractiveness.The future of airline industry is
slightly unpredictable for the perspective of investment,
because demand for air tickets is increasing but demand for
stocks has decreased overtime. Business History, Overview and
FutureIndustry History and Overview:
Since the birth of flight in 1903, air travel has emerged as a
crucial means of transportation for people, products and
animals. The hundred-plus years following the invention of the
first aircraft have brought about a revolution in the way
people travel. The airline business is a major industry, relied
upon by millions not only for transportation but also as a way of
making a living.
In early years, flying was considered a risk endeavor. In 1925, a
development of an act “Air Mail Act” bring much revolution in
airline industry by allowing the postmaster to contract with
private airlines to deliver mail. Shortly thereafter, the Air
Commerce Act gave the Secretary of Commerce power to
establish airways, certify aircraft, license pilots, and issue and
enforce air traffic regulations. The first
commercial airlines included Pan American, Western Air
4. Express and Ford Transport Service. Within 10 years, many
modern-day airlines, had emerged as major players.
In 1938, Civil Aeronautics Board, commonly called CAB was
established. This board served numerous functions, the two
most significant being determining airlines' routes of travel and
regulating prices for passenger fares. And further in 1958, the
Federal Aviation Agency came in to being, now known as the
Federal Aviation Administration (FAA), to manage safety
operations, and resulting disbandment of CAB as FAA took
control of its operations and now evolved with numerous
functions in current era. Such as, aircraft and airmen safety and
certifications along with providing repair stations, airport
compliances, air traffic control and airmen and aircraft trainings
and testing.
Airline Industry is benefiting from growing income level in the
country, allowing people to fly to their destinations in short
span of time. Growth in tourism is also a major strength for the
industry resulting increase in number of domestic and
international air travelling.
Air travel has continued to grow over time and is one of those
industries that are far away from reaching their peak. This can
be partly attributed to the ever growing population and the
increase in the propensity of people to fly. Another major
advantage of the industry is low cost growing airlines can also
share similar strengths with big brand names in this industry
such as safety and speed, both main attributions can easily
apply to both players of the industry. Airline staff consists of
highly trained personnel, which is a major strength, to any
organization in the industry.
Despite of the strengths, Airline industry facing mountain of
problems as well. In past “9/11” impacted the industry with
substantial decreased in travel business. The event greatly
magnified the airlines’ issues, leading to a sharp decline in
customers and significantly higher operating costs. Losses
continued for years; the industry as a whole didn't return to
profitability until 2006. A relatively stable period followed,
5. although controversies arose over service quality and passenger
treatment in terms of flight delays, particularly those involving
planes waiting on the runway. In 2010 and 2011, the U.S.
Department of Transportation issued a series of rules mandating
that the airlines provide adequate modifications for passengers
in extenuating circumstances. As a result, airline industry
showed much improvement in safety and speed and now overall,
air travel has marked safety record and has generally accepted
as a safe and fast way to travel.
Other problems that industry is facing such as pilot shortages,
too much congestion in skies because of too many airplanes
travelling at same time, environmental issue like toxic smoke or
odors from plan’s engine, dramatic increase in animal related
incidents, high operation cost, climate challenges like
Hurricanes, passengers’ comfort and health issues (transfer of
communicable diseases) and etc.
Industry Future:
One can predict an innovative future in the industry in terms of
more customized air travel, comfort, privacy and fastest mode
of travel with more airports and runways. Future seems to be
more demanding however, experts predicting war on resources.
For example, on fuel prices and exchanges.
Several aircraft manufacturers, including Airbus, Boeing,
Bombardier and Embraer, estimate the future demand for air
transport in the form of revenues. The most recent estimates
suggest that demand for air transport will increase by an
average of 4.3% per annum over the next 20 years. That implies
that demand for air travel will increase by a factor of 2.3 over
the period. If this growth path is achieved, then in 2036 the air
transport industry will contribute 15.5 million direct jobs and
$1.5 trillion of GDP to the world economy.
6. Spirit Airlines
History and Overview:
The company was founded in 1964 as Clipper Trucking
Company in Michigan, and in 1974 changed its name to Ground
Air Transfer, Inc. In 1983, the company started doing business
as Charter One, a Detroit-based charter tour operator providing
travel packages to entertainment destinations such as Atlantic
City, Las Vegas and the Bahamas. In 1992, Charter One
changed its name to Spirit Airlines, brought jet equipment into
the fleet, and thereafter began adding scheduled passenger
service to destinations such as Fort Lauderdale, Detroit, Myrtle
Beach, Los Angeles and New York. Spirit relocated its
headquarters to Miramar, Florida in December 1999. Expansion
continued with the addition of the Chicago market, as well as
coast-to-coast service to Los Angeles. In November 2001, Spirit
inaugurated service to San Juan, Puerto Rico and implemented a
fully-integrated Spanish language customer service plan,
including a website and dedicated reservation line. May and
June 2002 brought new service to Las Vegas, as well as
expanded service in nearly every market. Fall of 2003 brought
Spirit to Washington, DC’s Reagan National Airport and
Cancun, Mexico. In fall 2004, Spirit introduced service to Santo
Domingo, Dominican Republic.
Transition to Low-Cost Carrier and Ultra Low Cost Carrier
Investment funds managed by Oak tree gained control of Spirit
after making investments in 2004 and 2005 bringing a change in
business strategy and positioning of Spirit as a low-cost carrier
with a focus on expanding Caribbean and Latin American
routes. Several unprofitable domestic routes were closed and
Fort Lauderdale-Hollywood International Airport was
established as Spirit’s main base of operations. In 2006, Indigo
acquired a majority stake in the airline, and Spirit began
implementing its Ultra Low Cost Carrier (ULCC) business
model and further expanded its Caribbean and Latin American
7. routes.
From 2005 – 2011, Spirit kept added new flights and this period
is full of expansion to Bahamas, Jamaica and US Virgin Islands
to Puerto Rica. In 2009, Spirit added Santiago, Dominican
Republic, and Medellin and Armenia, Colombia, to its route
map, along with new service from Fort Lauderdale to both Los
Angeles and Las Vegas, as well as additional service in existing
markets. Expansion in existing markets continued in 2010 along
with new service to Barranquilla, Colombia.
The company operates approximately 450 daily flights to 60
destinations in the United States, the Caribbean, and Latin
America. As of December 31, 2017, the company had a fleet of
112 Airbus single-aisle aircraft comprising 31 A319s, 51
A320ceos, 5 A320neos, and 25 A321ceos.
Their ULCC business model provides customers very low,
unbundled base fares with a range of optional services, allowing
customers the freedom to choose only the options they value.
The success of the model is driven by our low cost structure,
which permits them to offer very low base fares while
maintaining one of the highest profit margins in the industry.
They aggressively use low fares to stimulate air travel demand
in order to increase passenger volume. Company strive to be
recognized by our customers and potential customers as the
low-fare leader in the markets we serve.
Future of Spirit Airlines
The two things that stand out most about Spirit Airlines are its
low fares and high number of complaints. Spirit has improved
on time performance and cut its complaint rate by more than
half in last few years, and continue to strive for in future.
According to their leadership, they will grow capacity from 4%
to 6% over the next three years and their goal is to have 80% of
flights arrive on time in next two years. They also report
expected operating cost raise due to new pilot contract from $85
8. million to $90 million annually, which reduces earnings per
share by about a dollar.
JetBlue:
Brief History and Overview:
The JetBlue Airways Corporation is a low-cost airline that was
founded by Utah entrepreneur David Neeleman. JetBlue’s
corporate headquarters is located in Forest Hills, New York and
the airline’s main hub is based on JFK airport in New York
City. In the airline’s early years, it was considered to be one of
the fastest growing airlines within the U.S. market. JetBlue was
incorporated on August 24, 1998 and its operations commenced
in early 2000. Originally, the corporation was known as New
Air but in July of 1999 it changed the corporation’s name to
JetBlue Airways. From the airline’s first flight, it has been able
to “cater to the niche market comprising of customers that it
defines as ‘underserved customers’—those looking for better
features and benefits that aren’t provided by low-cost carriers
and at a reasonable price that aren’t provided by network
carriers”
JetBlue started with two newly leased Airbus with its first route
from New York to Fort Lauderdale, Florida. Within six months,
company began service to Buffalo. And in a year they grew
rapidly, had 300 call centers with the option of employees
working at home saved company’s overhead cost with big
margin.
In December 2000, JetBlue announced millionth customers and
third profitable month. This was considered an amazing
achievement in a short period of time in airline businesses
because, this was the time when start up national airlines were
forced to file bankruptcy due to rising fuel prices. It reported
about $100 million in revenues but no annual profit yet. By this
time, the company was flying to ten destinations. In February
2001, JetBlue filled a higher percentage of its seats (79.9
percent) than any other U.S. carrier. Further, the "JetBlue"
effect was credited with lower fares and increasing service at
9. other airlines operating in New York.
By June 2001, it was operating a fleet of 14 planes with 76
flights a day. It further planned to acquire a new plane every
five weeks until 2008. However, Airbus was unable to deliver
enough new planes in time, Jet Blue announced plan to buy as
many as 48 planes for as much as $2.5 billion from Paris Air
Show in June 2001. At the time, the company had another 68
planes already on order and 15 in service.
The company was touted as the first airline launched from
scratch in the computer age. Pilots received laptop computers. A
"telemedicine" service was introduced, allowing in-flight
consultation with physicians. They are first among in airlines,
which aired taped shows, launched with joint venture between
Harris corporation and Sextant in-flight systems. Their in-flight
entertainment system boasted 24 channels of live satellite
television broadcast at every seat.
In June 2014, JetBlue introduced Mint, first premium-class
option, on flights from New York to Los Angeles and San
Francisco operated with Airbus A321-200 aircraft outfitted with
16 lie-flat seats, four of which are suites. With Mint, JetBlue
introduced an alternative to outdated business class offerings.
In November 2015, JetBlue expanded its highly successful Mint
service on flights to the Caribbean, from New York (JFK) to
Aurba and Barbados, two of its most popular Caribbean routes.
It continued to expand with mint new routes between New York
and Grenada and between Boston and Aruba.
Jet blue become the first airline to resume commercial flights to
Cuba after more than 55 years of air travel to Cuba limited to
charter services. JetBlue had fled the first regularly scheduled
flight from US to Cuba, left footprint for other national carriers.
The low- cost carrier was one of ten U.S. airlines that received
tentative approval from America’s Department of
Transportation (DoT) to launch Cuban services. The two former
Cold War enemies restored diplomatic ties 2016.
Future of JetBlue:
JetBlue is facing decline in its share return since last three
10. years continuously, is now looking to boost earnings by
expanding in three key cities and plan to sell more travel
services such as car rentals and hotels.
They announced a plan on Oct 2018 to broaden their revenue.
This initiative would result in earnings per share of as much as
$3 in 2020, that would top the $2.21 average of analysts’
estimates compiled by Bloomberg. Company is targeting a net
operating profit margin of 10 percent in 2020, up from 7.3
percent this year, and a return on invested capital of as much as
13 percent compared with 8.2 percent. JetBlue said it has
achieved $171 million of savings under a previously announced
program to reduce structural costs by $250 million to $300
million by 2020.Financial Statements and Analysis
11. SPIRIT AIRLINE - Ratios
Liquidity
12/31/2017
12/31/2016
12/31/2015
12/31/2014
Current
Current Asset
Current Liability
1.98
1.83
2.20
1.97
Quick
Current Assets - Inventory
Current liability
1.98
1.83
2.2
1.97
Asset Management/ Activity Ratio
Average collection period
Average Net Account Receivable
One day Sales
12. 16.43
12.60
5.91
4.81
Inventory turnover
Cost of goods sold
Average inventory
N/A
N/A
N/A
N/A
Account Receivable Turn over
Net Credit Sales
Average net Account Receivables
22.22
56.45
75.76
85.15
Financial Leverage
Debt
Total Liabilities
Total Assets
0.57
0.56
0.52
0.37
Times interest earned
EBIT
Interest Expense
9.32
17.05
57.92
13. 40.58
Profitability
Return on Net Sales
Net Income
Net Sales
0.16
0.11
0.15
0.12
Return on Assets
Net Income + interest Expense
Average total Assets
0.11
0.09
0.13
0.15
Return on stockholders' common equity
Net Income - Preferred dividend
Average common shareholders' equity
60086.57
37839.86
45317.14
32209.14
Earnings Per Share of common Stock
Net Income - Preferred dividend
Numbers of shares of common stock outstanding
6.06
3.76
4.38
3.08
Market-based/ Investment
Dated 12/31/2017
14. 12/31/2016
12/31/2015
12/31/2014
Price-to earnings
Market Price per share of common Stock
Earnings per share
7.38
15.39
9.1
24.7
Dividend Yield
Dividend per share of common (or preferred) stock
market Price per Share
No Dividend
N/A
N/A
N/A
Book Value per share of common Stock
Total Shareholders' equity - Preferred Equity
Number of shares of common stock outstanding
26.06
20.12
17.13
13.78
JETBLUE Ratios
Liquidity
12/31/2017
12/31/2016
16. Sales
Average Net Assets
0.72
0.71
0.74
0.74
Account Receivable Turn over
Net Credit Sales
Average net Account Receivables
28.63
31.81
41.66
42.77
Financial Leverage
Debt
Total Liabilities
Total Assets
0.51
0.57
0.63
0.68
Times interest earned
EBIT
Interest Expense
11.76
12.74
9.96
3.79
Profitability
17. Return on Net Sales
Net Income
Net Sales
0.16
0.11
0.11
0.07
Return on total Assets
Net Income + interest Expense
Average total Assets
0.13
0.09
0.09
0.06
Return on stockholders' common equity
Net Income - Preferred dividend
Average common shareholders' equity
286.75
189.75
169.25
100.25
Earnings Per Share of common Stock
Net Income - Preferred dividend
Numbers of shares of common stock outstanding
2.08
2.22
1.98
1.19
Market-based/ Investment
Dated 12/31/2017
12/31/2016
12/31/2015
12/31/2014
Price-to earnings
Market Price per share of common Stock
18. Earnings per share
6.35
10.19
11.44
13.33
Dividend Yield
Dividend per share of common (or preferred) stock
market Price per Share
No Dividend
N/A
N/A
N/A
Book Value per share of common Stock
Total Shareholders' equity - Preferred Equity
Number of shares of common stock outstanding
15.06
11.91
9.97
8.16
Financial AnalysisLiquidity Analysis
19. Current Ratio
2014
2015
2016
2017
Spirit airline
1.97
2.20
1.83
1.98
JetBlue
0.62
0.60
0.63
0.50
Industry
1.6
1.5
1.6
1.5
Current Ratio: It measures the ability to pay current liabilities
with its current assets. Spirit Airline’s current ratio is above
average than industry ratio showing positive sign in terms of
meeting current liabilities. Spirit Airline has more ability to
meet its current liabilities than JetBlue. In addition, Spirit
Airline performance for its current ratio has increased in 2017
as compare to 2016. On contrary, Jet Blue current ratio
performance has decline.
Quick Ratio
2014
2015
2016
20. 2017
Spirit Airline
1.97
2.2
1.83
1.98
JetBlue
0.6
0.58
0.61
0.48
Industry
1.1
0.9
1
0.7
Although, service industry doesn’t have much inventory but still
it is worthy to measure quick ratio to see true liquidity.
Inventory is least liquid asset in current assets, thereby, quick
ratio shows ability to pay all current liabilities if they come due
immediately. Again, Spirit Airline is above average ratio than
industry and JetBlue is below average industry ratio. Spirit
Airline is performing very well in terms of liquidity ratio and
its performance from is consistent and improved from 2016 to
2017. On the other hand, JetBlue Quick ratio performance has
declined.
Activity Ratio
Day’s sales in receivables
2014
2015
2016
2017
Spirit Airline
4.81
21. 5.91
12.6
16.43
JetBlue
8.53
8.76
11.48
12.75
Industry
19.8
33.5
19.7
29.6
It shows how many day’s sales remain in account receivable. In
other words, how many days it takes to collect the average level
of receivables. Lower ratio indicates that companies are
receiving payments faster. JetBlue and Spirit Airline both
receivables are below than average, which means that, both
companies are performing well in collecting their account
receivables. However, JetBlue is relatively consistent in this
ratio as compare to Spirit Airline. From 2014 to 2015, Spirit
Airline average receivable was better than JetBlue but in 2016-
2017, JetBlue improved. In a nutshell, JetBlue is better than
Spirit, because it is consistent, improving and less days in
account receivable in recent years.
Assets Turnover
2014
2015
2016
2017
Spirit Airline
1.21
0.85
22. 0.74
0.64
JetBlue
0.74
0.74
0.71
0.72
Industry
0.89
0.96
0.9
0.84
It measures the company’s ability to generate sales from its
assets. In other words, it shows how efficiently a company can
use its assets to generate sales. In general, higher is better.
Spirit Airline ratio has declined from 2014 to 2017, whereas,
JetBlue is relatively consistent in utilizing their assets. Both
companies are performing below average that means not
performing good in terms of industry averages. In comparison
on both industry, JetBlue is relatively good. Moreover, Spirit
Airline ratio has decline with big margin in comparison to
industry which is a question mark in company’s worth for
utilizing its assets.
Account Receivable Turnover
2014
2015
2016
2017
Spirit Airline
42.77
41.66
31.81
28.63
23. JetBlue
85.15
75.76
56.45
22.2
Industry
27.26
29.14
30.69
25.85
It measures ability to collect cash from credit customers.
Above, JetBlue has improved a lot in its collection. In 2017,
JetBlue has performed well from industry averages and spirit
airline is close to industry ratio. In general, JetBlue is good
than industry averages and spirit airline.Solvency Ratio
Debt Ratio
2014
2015
2016
2017
Spirit Airline
0.37
0.52
0.56
0.57
JetBlue
0.68
0.63
0.57
0.51
Industry
0.32
0.33
24. 0.37
0.36
It indicates percentage of assets finance by debt. Both
companies have more debt ratio than industry, which means
that, both companies have more default risk than industry. In
other words, it has more assets financed by debts as compare to
industry. Spirit Airline is increasing its debt ratio whereas,
JetBlue is reducing its leverage. In general, JetBlue is closer to
industry averages.
Time Interest Earned Ratio
2014
2015
2016
2017
Spirit Airline
40.58
57.92
17.05
9.32
JetBlue
3.79
9.96
12.74
11.76
Industry
12.66
19.56
15.67
14.33
It measures the number of times operating income can cover
interest expense. The declining TIE ratio of spirit airline
25. indicating financial trouble in meeting its liabilities. JetBlue is
consistently improving but both companies are below industry
ratio. In general, JetBlue is better than spirit but not good as
industry is doing.Profitability Ratio
Return on Net Sales
2014
2015
2016
2017
Spirit Airline
0.12
0.15
0.11
0.16
JetBlue
0.07
0.11
0.11
0.16
Industry
0.03
0.04
0.035
0.057
This ratio shows the percentage of each sales dollar earned as
net income. This measure provides insight into how much profit
is being produced per dollar of sales. An increasing ROS
indicates that company is growing more efficiently, while a
decreasing ROS could signal financial troubles. Both companies
are above industry averages signaling positive sign for
generating income from sales. However, spirit airline has
improved from 2014 to 2015 and then its decline in 2016 and
improved again in 2017. This see-saw curve showing
inconsistency in its profitability. On the other hand, JetBlue is
26. relatively consistent in its performance and it also had a
tendency to improve a lot as shown in graph. Base on this
scenario, one could predict JetBlue for its profitability in long-
run.
Return on Assets
2014
2015
2016
2017
Spirit Airline
0.15
0.13
0.09
0.11
JetBlue
0.06
0.09
0.09
0.13
Industry
0.04
0.027
0.045
0.046
ROA measures how profitable a company uses it assets. Both
companies are above from averages which is a good sign.
JetBlue is performing well than Spirit Airline. Spirit Airline
showed a deep dip in this ratio. From 2014 to 2016, spirit
airline was declining and it spike in 2017. On Contrary, JetBlue
was upward trending, consistently improving. In its ROA one
could recommend for JetBlue.
Return on Shareholders' Common Equity
27. 2014
2015
2016
2017
Spirit Airline
32209.1
45317.1
37839.8
60086.6
JetBlue
100.25
169.25
189.75
286.75
Industry
Return on stockholder’s equity (ROSE) gauges how much is
earned with the money invested by common shareholders. Spirit
Airline seems upward direction, far above than JetBlue. Every $
invested by shareholder in Spirit Airline is giving multiple of
1000 times return and JetBlue is in 100s. For Investment
perspective, Spirit is better. Moreover, ROE of Spirit is also
higher than JetBlue. As far as stock performance is concerned,
in 2017, Spirit Airline is relatively consistent in stock prices
while, JetBlue seems volatile and with more swings. The
average decline is stock price of JetBlue is 1.51% and Spirit
decline is 0.75%.
Earnings Per Share
2014
2015
28. 2016
2017
Spirit Airline
3.08
4.38
3.76
6.06
JetBlue
1.19
1.98
2.22
3.47
Industry
5.2
7.46
0.82
-7.54
Earnings Per Share (EPS) gives the amount of net income per
share of the company’s common stock. The sharp decline in
airline industry’s EPS has various reasons, but major reason
includes, raising oil price, and its seems that demand for
seats/air tickets have risen sharply from last few years, but
demand for share decline. Another news catching point is
American Airline whose overall performance reduced resulting
low EPS, disturbed the industry ratios. To compare both
companies, Spirit Airline EPS is better than JetBlue.Investment
Ratio
Price to Earnings Ratio
2014
2015
2016
2017
Spirit Airline
29. 24.7
9.1
15.39
7.38
JetBlue
13.33
11.44
10.19
6.35
Price to Earning indicates the market price of $1 of earnings.
High PE ratio generally indicates high earnings but it is not
necessary a better investment decision because it generally
consider that stock is overvalued and soon will decline. On
contrary, low PE ratio indicates stock is undervalued.
Comparing JetBlue and Spirit Airline, if we look into trend, it
seems like Spirit may increase in future and JetBlue will
decrease. Other perspective is JetBlue is consistent and Spirit is
volatile but it depends on investor if he/she is risk averse or risk
taker to marginalize return.
Book Value per share of common Stock
2014
2015
2016
2017
Spirit Airline
13.78
17.13
20.12
26.06
JetBlue
8.16
9.97
11.91
15.06
30. It indicates the recorded accounting amount for each share of
common stock outstanding. Although higher gap between book
value and share price indicates stock either undervalued or
overvalued. Both companies’ book value is upward trending and
there is a lower gap among their share price and book value,
which is a positive sign for those who are risk averse.
Horizontal and Vertical Analysis
Spirit Airline Horizontal Analysis:
Income Statement:
As Shown below, total revenue from the base year of 2014 is
upward trending, so as with the gross profit raise by 60% in
2017 from base year 2014. However, operating income showed a
dip from base year mainly because of increasing expenses.
Spirit Airline has achieved significant growth in its net income
by 87% in 2017.
Balance Sheet:
Total Assets have an increasing trend which is mainly because
of significant addition in property, plant and equipment. This
signaling growth and addition in company’s net worth. In long
run, these assets insulate growth in firm value. Current Assets
has also increase from 2016 to 2017 signaling liquidity.
On the other hand, total liabilities have significantly raised to
401.38% in 2017 which is referring to high default (credit) risk.
Thereby, TIE ratio dropped sharply. This has reduced its
creditworthiness both short term and long term both because
there is a decreasing trend in income before tax.
Spirit Airline Vertical Analysis:
Income Statement:
Net income portion from total revenue is 12% in 2014 and it
keep on increasing from 12% to 16% in 2017. Cost of revenue is
31. 69% in 2014 and its struggled to take it down to 64% of
revenue. However, operating income is in declining trend
because of increasing operating expenses.
Balance Sheet (Vertical Analysis):
Current assets and fixed asset are more or less equally
proportionate. Whereas, equity is more than liability. This
signaling either shareholders are subjected to more contribution
and because of more equity, leveraging risk is lower.
JETBLUE Horizontal Analysis:
Income Statement:
From 2014 to 2017, Revenue has an increasing trend and cost of
revenue is decreasing, which insulting increasing trend of gross
profit. However, operating expense has increased over time,
which reduced the operating income from 258.27% on 2016 to
196.85% of revenue in 2017. Interest expense has reduced to
63.43% from 76.87% in 2016. Its net income also has an
increasing trend.
Balance Sheet:
Its liquidity pattern has reduced significantly by 24% but net
tangible assets has an increasing trend. JetBlue retained
earnings has increased significantly to 358.58% in 2017
signaling long term growth and big projects implementation
benefiting firm value. It has also a diminishing liabilities
patterns signaling less diminishing interest expense insulating
net income.
JETBLUE Vertical Analysis:
Income Statement:
Net income pattern has increased with sufficient proportion
from 2014 to 2017. It was 6.89% in 2014 and it lead to 16.35%
in 2017. They have lowered their liabilities which reduced its
interest expense. Its operating expense proportion has also
reduced, allowing operating income to raise.
Balance Sheet:
Its liquidity pattern is not appealing but its net tangible assets
32. has increased overtime. It seems, less concentration on
shareholders’ equity signaling less demands for its share. They
have reduced its long term liability signaling less credit risk for
investors.
Comparative Analysis:
Creditworthiness:
Short-term analysis:
If an investor is seeking to invest in short-term market, then
Spirit airline is a good decision. Moreover, they don’t have
33. anything lock up in inventory but JetBlue has, which has
reduced its liquidity. Spirit Airline’s liquidity is above average
than industry ratio showing positive sign in terms of meeting
current liabilities. Spirit Airline has more ability to meet its
current liabilities than JetBlue. In addition, Spirit Airline
performance for its current ratio has increased in 2017 as
compare to 2016. On contrary, Jet Blue current ratio
performance has decline.
Long Term Analysis:
Both companies have more debt ratio than industry, which
means that, both companies have more default risk than
industry. In other words, it has more assets financed by debts as
compare to industry. Spirit Airline is increasing its debt ratio
whereas, JetBlue is reducing its leverage. In general, JetBlue is
closer to industry averages.
Talking about TIE ratio which measures the number of times
operating income can cover interest expense. The declining TIE
ratio of spirit airline indicating financial trouble in meeting its
liabilities. JetBlue is consistently improving but both companies
are below industry ratio. In general, JetBlue is better than spirit
but not good as industry is doing.
Investment Attractiveness:
An increasing ROS indicates that company is growing more
efficiently, while a decreasing ROS could signal financial
troubles. Both companies are above industry averages signaling
positive sign for generating income from sales. However, spirit
airline has improved from 2014 to 2015 and then its decline in
2016 and improved again in 2017. This see-saw curve showing
inconsistency in its profitability. On the other hand, JetBlue is
relatively consistent in its performance and it also had a
tendency to improve a lot as shown in graph. Base on this
scenario, one could predict JetBlue for its profitability in long-
run.
Measuring attractiveness in terms of return on assets. As shown
34. in graphs above,
Both companies are above from averages which is a good sign.
JetBlue is performing well than Spirit Airline. Spirit Airline
showed a deep dip in this ratio. From 2014 to 2016, spirit
airline was declining and it spike in 2017. On Contrary, JetBlue
was upward trending, consistently improving. In its ROA one
could recommend for JetBlue. However, talking about return on
equity, passed records shows that Spirit is returning to
shareholder’s lot more than JetBlue, it also looks like that
JetBlue is improving. EPS ratio of Spirit airline is also more
pronounced then JetBlue.
Commenting on Price to earnings ratio of both companies, High
PE ratio generally indicates high earnings but it is not necessary
a better investment decision because it generally consider that
stock is overvalued and soon will decline. On contrary, low PE
ratio indicates stock is undervalued. Comparing JetBlue and
Spirit Airline, if we look into trend, it seems like Spirit may
increase in future and JetBlue may decrease. Other perspective
is JetBlue is consistent then Spirit. It depends on investor if
she/he is risk taker or risk averse to expand returns.
In a nutshell, for profitability point of view, JetBlue seems like
a fast growing company than spirit. But if we see past pattern of
stock performance, spirit may take the lead if it improves on
above ratio.Conclusion:Both airlines are well known airlines of
US. However, JetBlue’s fleet is one of the youngest and most
fuel-efficient in the industry, also has some of the best
amenities for a “value” airline. As a result, the company has
been posting strong sales and earnings gains in recent quarters.
We look for the good times to continue. JetBlue should also
benefit from its efforts to continue to expand other margin-
enhancing premium goods and services. While there are some
risks, including considerable industry competition, along with
the fact the results are highly dependent on the price of fuel, we
think the positives outweigh the negatives. While the stock
price is near an all-time high, investors could still see some
room for price appreciation, given bright outlook. Assuming the
35. success of its expansion plans, there could also be some appeal
for longer-term investors, as well. As also discussed above,
horizontal and vertical analyses of JetBlue is more pronounced
and its financial statements too.On Contrary, Spirit Airline is
facing trouble in its operations because of high attrition rate and
diminishing sales. It has constantly increasing its cost but not
the revenue. It also has limited success in its non-core business.
It need to work on its financial planning and Research and
development to compete with others and improve its
profitability.Reference:
http://ir.spirit.com/financials-filings/overview
http://ir.spirit.com/financial-information/annual-reports
http://ir.spirit.com/financials-filings/sec-filings
https://www.nasdaq.com/symbol/save/financials?query=income-
statement
https://www.marketwatch.com/investing/stock/save/financials
https://quotes.wsj.com/SAVE/financials
https://finance.yahoo.com/quote/save/financials/
http://blueir.investproductions.com/investor-relations/financial-
information/reports/annual-reports
https://www.nasdaq.com/symbol/jblu/financials?query=income-
statement
https://finance.yahoo.com/quote/JBLU/financials/
https://www.marketwatch.com/investing/stock/jblu/financials
https://quotes.wsj.com/JBLU/financials
http://financials.morningstar.com/ratios/r.html?t=JBLU
https://www.reuters.com/finance/stocks/income-
statement/JBLU.O
http://blueir.investproductions.com/~/media/Files/J/Jetblue-IR-
V2/Annual-Reports/jetblue-2017-annual-report.pdf
https://www.businessinsider.com/airlines-biggest-business-
problems-2018-4#labor-relations-6
https://getawaytips.azcentral.com/airline-industry-swot-
analysis-12208038.html
https://traveltips.usatoday.com/history-airline-industry-
100074.html
37. 52.5
62.9
Current Liabilities / Inventory (%)
999.9
999.9
999.9
978.2
Total Liabilities / Net Worth (%)
104.3
135.9
135.3
145.6
Fixed Assets / Net Worth (%)
93.1
133.3
116.1
96
Efficiency
Median
Median
Median
Median
Collection Period (days)
19.8
33.5
19.7
29.6
Sales / Inventory (times)
56.3
54.1
48.6
37.1
Assets / Sales (%)
100.3
111.7
125.9
38. 125
Sales / Net Working Capital (times)
5.9
4.9
5.3
3.6
Accounts Payable / Sales (%)
4.2
4.5
5.8
5.8
Profitability
Median
Median
Median
Median
Return on Sales (%)
3.3
4.4
3.5
5.7
Return on Assets (%)
3.9
2.7
4.5
4.6
Return on Net Worth (%)
8.3
7.1
12.8
13.2
Median INDUSTRY Variance
2015
49. Spirit Airline 2014 2015 2016 2017 32209.14 45317.14
37839.800000000003 60086.57 JetBlue 2014 2015
2016 2017 100.25 169.25 189.75 286.75
Industry 2014 2015 2016 2017
Earning Per Share
Spi rit Airline 2014 2015 2016 2017 3.08 4.38 3.76 6.06 JetBlue
2014 2015 2016 2017 1.19 1.98 2.2200000000000002
3.47 Industry 2014 2015 2016 2017 5.2 7.46 0.82 -7.54
Price to Earning Ratio
Spirit Airline 2014 2015 2016 2017 24.7 9.1 15.39 7.38
JetBlue 2014 2015 2016 2017 13.33 11.44 10.19
6.35
Book Value per Share of Common Stock
Spirit Airline 2014 2015 2016 2017 13.78 17.13 20.12
26.06 JetBlue 2014 2015 2016 2017 8.16
9.9700000000000006 11.91 15.06
50. Term Project
Comparative Financial Statement Analysis of Ruth’s Hospitality
Group and Flanigan’s Enterprises, 2016-2018
Prepared by
Rene Carbonell
Table of Contents
51. I. Introduction
II. Business history and future
a. Industry
b. Ruth’s Hospitality Group
c. Flanigan’s Enterprises
III. Financial Analysis
a. Ratio analysis explanation
i. Liquidity ratios
ii. Activity ratios
iii. Solvency ratios
iv. Probability ratios
b. Horizontal and vertical analysis
i. Overview
ii. Complementary application
IV. Liquidity analysis
a. Industry
b. Ruth’s Hospitality Group
c. Flanigan’s Enterprises
V. Activity analysis
a. Industry
b. Ruth’s Hospitality Group
c. Flanigan’s Enterprises
VI. Solvency analysis
a. Industry
b. Ruth’s Hospitality Group
c. Flanigan’s Enterprises
VII. Profitability analysis
a. Industry
b. Ruth’s Hospitality Group
c. Flanigan’s Enterprises
VIII. Horizontal and vertical analysis
IX. Comparative analysis
a. Creditworthiness analysis
i. Short-term
ii. Long-term
b. Investment attractiveness analysis.
52. c. Recommendations and current developments
X. Summary and conclusions
XI. References/Biography
XII. Appendices
a. Analysis tables- Ruth’s Hospitality Group Income Statement
b. Analysis tables- Flanigan’s Enterprises Income Statement
I. Introduction
According to the study or analysis of Financial Statements, it is
a method of reviewing and analyzing the accounting reports
(financial statements) of a company to evaluate its projected
past, present or future performance. This process allows a better
business or financial decision based on the results analyzed in
the financial statements.
It is a requirement for companies listed on the United States
stock exchange, to present their financial statements to
53. Securities and Exchange Commission (SEC). This allows the
performance to be assessed over the years through the annual
report presented to interested parties. As the financial
statements are prepared to meet the requirements, the second
step in the process is to analyze them effectively so that future
profitability and cash flows can be forecast.
Therefore, the main objective of the analysis of the financial
statements is to use information about the company's past
performance to predict how it will do in the future. Another
important purpose of analyzing the financial statements is to
identify potential problem areas and solve them.
There may be different stakeholders in the analysis of financial
statements. These can be classified into internal and external
users. Internal users refer to the administration of the company
that analyzes the financial statements to make decisions related
to the company's operations. On the other hand, external users
do not necessarily belong to the company, but they still have
some kind of financial interest. These include owners, investors,
creditors, government, employees, customers and the general
public.
Company managers, large or small, need to analyze and use the
financial statements to make intelligent decisions about
performance. You make the right decisions through an efficient
analysis of the financial statements can be a very valuable tool
for any manager or manager of any company. For example, they
can measure the cost per distribution channel, or how much cash
they have left, of their accounting reports and make decisions
based on these analysis results.
Small business owners need a lot of financial information about
their operations in order to determine the profitability of the
company. It helps to make decisions as if to continue operating
the business, whether to improve business strategies or abandon
the business altogether.
People who have bought shares or shares in a company need
54. financial information to analyze the company's performance.
They use financial statement analysis to determine what to do
with their investments in the company. Then, depending on how
the company is doing, they will keep their shares, sell them or
buy more.
Creditors are interested in knowing if a company will be able to
make their payments when they expire. They use the cash flow
analysis of the company's accounting records to measure the
liquidity of the company or its ability to make short-term
payments.
The governing and regulatory bodies of the state analyze the
analysis of the financial statements to determine how the
economy performs in general in order to plan its financial and
industrial policies. Tax authorities also analyze a company's
statements to calculate the tax burden that the company has to
pay.
Employees need to know if their employment is safe and if there
is a possibility of a raise. They want to be aware of the
profitability and stability of their company. Employees may also
be interested in knowing the financial position of the company
to see if there can be expansion plans and, therefore, career
prospects for them.
Customers need to know about the company's ability to serve its
customers in the future. The need to know the stability of the
company's operations increases if the customer (that is, a
distributor or supplier of specialized products) depends entirely
on the company for its supplies.
II. Business history and future
a. Industry
The hospitality industry is a great field within the goods and
services industry that includes smaller fields such as hotels and
accommodation, event planning, theme parks, transportation,
cruise lines and other fields within the tourism industry.
Since the hotel industry is broad, it is very important to define a
55. set of financial indexes that can be used to analyze companies
throughout the industry, regardless of operations. The hotel
industry will therefore have many amounts of fixed and tangible
assets and, therefore, requires a very specific set of financial
indexes to accurately analyze the industry and reach
conclusions based on the performance of individual companies.
The following are key financial reasons that an interested party
can use to analyze companies within the hotel industry. The
following are key financial reasons that an interested party can
use to analyze companies within the hotel industry:
· Liquidity Ratios provide stakeholders with information
regarding a company's ability to meet its short-term financial
obligations. The hospitality industry needs a high amount of
working capital and has a lot of short-term financial obligations
to cover, making liquidity ratios an integral part of the
industry's analysis.
· Financial leverage ratios give stakeholders an understanding
of the long-term solvency of a firm in the hospitality industry.
These ratios measure a company's ability to meet its long-term
debt obligations.
· Profitability ratios measure a company's level of profitability,
at the gross profit, operating profit, and net profit levels. For
companies in the hospitality industry, billions of dollars are
generated, and many companies are long-established, meaning
high profit margins should be generated at all levels.
b. Ruth's Hospitality Group, Inc. is a Delaware corporation
formerly known as Ruth's Chris Steak House, Inc. The Company
was founded in 1965, when Ruth Fertel mortgaged her home for
$ 22,000 to buy "Chris Steak House", a restaurant of 60 seats
located near the New Orleans Fair Grounds race track. After a
fire destroyed the original restaurant, Ruth moved her restaurant
to a new facility with a capacity of 160 seats. As the terms of
the original purchase prevented the use of the name "Chris
Steak House" in a new restaurant, Ruth added her name to that
56. of the original restaurant, thus creating the "Ruth’s Chris Steak
House" brand.
The Company began to expand in 1972, when Ruth opened a
second restaurant in Metairie, located in a suburb of New
Orleans. In 1976, another restaurant was opened in Baton
Rouge, Louisiana, which was Ruth's first Chris Steak House,
which would be owned by a franchise. In 2005, the Company
and certain selling shareholders completed an initial public
offering of the Company's common shares, which is currently
listed on the Nasdaq Global Select Market with the symbol
"RUTH".
At the end of the year, specifically on December 30, 2018, there
were 156 Ruth's Chris Steak House restaurants, which included
78 restaurants owned by the Company, three restaurants that
operated under contractual agreements and 75 restaurants owned
by franchisees, including 20 international restaurants Franchise
ownership in Aruba, Canada, China, Hong Kong, Indonesia,
Japan, Mexico, Singapore and Taiwan.
On December 12, 2017, the entire company saw the acquisition
of all the assets of six Ruth's Chris Steak House, owned by a
franchise, located in Hawaii (the “Hawaiian restaurants”) as
very necessary or essential $ 35.4 million cash purchase. The
results of operations, financial position and cash flows of
Hawaiian restaurants are included in the consolidated financial
statements at the date of acquisition.
The Company uses a 52 or 53 week reporting period that ends
on the last Sunday of December. The period ended December
31, 2017 (fiscal year 2017) had a reporting period of 53 weeks.
The periods that ended on December 30, 2018 (fiscal year 2018)
and December 25, 2016 (fiscal year 2016) had a 52-week
reporting period. The consolidated financial statements are
prepared in accordance with accounting principles generally
accepted in the United States and include the financial
statements of Ruth’s Hospitality Group, Inc. and its wholly
owned subsidiaries. The Company adopted a strategy to provide
total return to shareholders by maintaining a healthy core
57. business, growing with a disciplined investment approach and
returning excess capital to shareholders. The company strives to
maintain a healthy core business by increasing sales through
traffic, managing operating margins and leveraging its
infrastructure. The Company is committed to disciplined growth
in markets with attractive sales attributes and solid financial
returns. The Company sees in its franchisee program a point of
competitive differentiation and always seeks to increase its
franchise-owned restaurant locations. The Company may also
consider acquiring franchise-owned restaurants on good terms
that it considers beneficial for both the Company and the
franchisee.
c. As of September 29, 2018, Flanigan's Enterprises, Inc., a
Florida corporation, together with its subsidiaries, operates 26
units, which consist of restaurants, liquor stores and combined
liquor / package stores that we own or have operational control
over and partial ownership in; and grants a franchise of five
additional units, consisting of two restaurants and three
combined restaurants / liquor stores in package.
Flanigan's joined Florida in 1959 and began operating as a chain
of small cocktail lounges and liquor stores throughout South
Florida. By 1970, he had established a chain of salons and
liquor stores "Big Daddy's" between Vero Beach and
Homestead, Florida. From 1970 to 1979, Flanigan's experienced
an expansion of its liquor store and salon operations throughout
Florida and opened clubs in five other "Sun Belt" states. In
1975, Flanigan interrupted most of its package shop operations
in Florida, except in the South Florida areas of Miami-Dade,
Broward, Palm Beach and Monroe counties. In 1982 he
expanded the club's operations to the Philadelphia,
Pennsylvania area, as a general partner of several limited
partnerships that the company organized. In March 1985,
Flanigan's began franchising packages of liquor stores and
salons in the South Florida area.
During fiscal year 1987, they began to renovate their
classrooms to provide a full meal service in restaurants, and
58. subsequently renewed and added the food service in most of
their classrooms. Food sales currently represent approximately
76.4% and bar sales approximately 23.6% of total restaurant
sales.
Its package liquor stores emphasize high-volume businesses by
providing customers with a wide variety of branded and private
label products at discounted prices. Its restaurants offer
alcoholic beverages and full service meals with abundant
portions and reasonable prices, served in a relaxed, friendly and
informal atmosphere.
Flanigan carries out its operations directly and through a series
of limited companies and wholly owned subsidiaries. Its
subsidiaries and limited partnerships (with the exception of the
limited partnership, where they are not the general partner, who
owns and operates their franchised restaurant in Fort
Lauderdale, Florida) are informed in a consolidated manner.
Flanigan's executive officers have created an employee culture,
food culture and business strategy in their company that has
been critical to their success and that can be difficult to
replicate under another administrative team.
The company has a 52/53 week fiscal year ending on the last
Saturday of September. Fiscal year 2018 ended on September
29, 2018, fiscal year 2017 ended on September 30, 2017 and
fiscal year 2016 ended on October 1, 2016.
III. Financial Analysis
a. Ratio analysis explanation
i. Liquidity ratios = Current assets/Current liabilities
Ruth’s
36,352
=0.78
46,902
2018
37,045
61. 2018 – 0.3127
2017 – 0.3861
2016 – 0.2404
Flanigan’s
2018 – 0.2338
2017 – 0.2287
2016 – 0,1919
iv. Probability ratios
Gross profit margin= Net sales – COG/ Net Sales
Ruth’s
2018 – 27.8476
2017 – 27.2449
2016 – 27.432
Flanigan’s
2018 – 59.9003
2017 – 59.1461
2016 – 60.4538
Return on total assets = Net income + Interest expenses /
Average total assets
Ruth’s
2018 – 16.3385
2017 – 12.493
2016 – 14.8237
Flanigan’s
62. 2018 – 8.0131
2017 – 7.2551
2016 – 8.8101
Return on equity = net income returned / shareholders’ equity
Ruth’s
2018 – 46.1545
2017 – 38.0421
2016 – 38.9259
Flanigan’s
2018 – 13.0376
2017 – 11.4994
2016 – 13.6815
b. Horizontal and vertical analysis
Ruth’s
Operating income for fiscal year 2018 increased from fiscal
year 2017 by $5.0 million to $51.7 million. Operating income
for fiscal year 2018 was favorably impacted by a $37.0 million
increase in restaurant sales, which was offset by increased food
and beverage costs, restaurant operating expenses, marketing
and advertising, general and administrative costs and
depreciation and amortization expenses. The Company had a
$3.9 million loss on impairment during fiscal year 2017 that did
not reoccur in fiscal year 2018. Higher restaurant sales were
attributable to an increase in new Company-owned restaurant
sales partially offset by sales at comparable Company-owned
restaurants. After-tax income from continuing operations during
fiscal year 2018 increased from fiscal year 2017 by $11.4
million to $41.6 million. Income tax expense decreased $7.4
63. million primarily due to the passage of the 2017 Tax Act which
reduced the statutory rate from 35% to 21%. Fiscal year 2018
net income increased from fiscal year 2017 by $11.5 million to
$41.7 million.
Operating income for fiscal year 2017 decreased from fiscal
year 2016 by $877 thousand to $46.7 million. Operating income
for fiscal year 2017 was favorably impacted by a $27.3 million
increase in restaurant sales, which was offset by increased food
and beverage costs, restaurant operating expenses, marketing
and advertising, general and administrative costs, depreciation
and amortization expenses and pre-opening costs. The Company
also had a $3.9 million loss on impairment during fiscal year
2017. Higher restaurant sales were attributable both to an
increase in comparable Company-owned restaurant sales and
new restaurants. After-tax income from continuing operations
during fiscal year 2017 decreased from fiscal year 2016 by $510
thousand to $30.2 million. Fiscal year 2017 net income
decreased from fiscal year 2016 by $328 thousand to $30.1
million.
Flanigan’s
Total revenue for their fiscal year 2018 increased $6,675,000 or
6.25% to $113,497,000 from $106,822,000 for their fiscal year
2017 due to increased menu prices and increased restaurant
traffic. Effective September 3, 2017 we increased certain menu
prices for their bar offerings to target an increase to their total
bar revenues of approximately 4.9% annually and effective
September 16, 2017 we increased certain menu prices for their
food offerings to target an increase to their total food revenues
of approximately 4.0% annually, (the “Price Increases 2017”).
We anticipate that total revenue for their fiscal year 2019 will
decrease when compared to their fiscal year 2018 due to the fire
at their combination restaurant/package liquor store located at
2505 N. University Drive, Hollywood, Florida (Store #19),
subsequent to the end of their fiscal year 2018, which will cause
this location to be closed for their entire fiscal year 2019, offset
to a lesser extent by increased restaurant traffic. Fiscal year
64. 2018 total revenue for their Store #19 was $5,333,000.
IV. Liquidity analysis
Ruth’s
The liquidity in the company has remained stable over the last
three years, cash, inventory and accounts receivable have been
stable. In 2018 we have the highest availability of cash while
the accounts receivable have decreased, the inventory has
increased but not significantly.
The principal sources of cash during fiscal year 2018 were net
cash provided by operating activities and borrowings under
their senior credit facility. The principal uses of cash during
fiscal year 2018 were for principal repayments under the senior
credit facility, capital expenditures, common stock repurchases
and dividend payments. Cash flows from discontinued
operations are combined with the cash flows from continuing
operations within each of the categories on their statement of
cash flows.
In 2016 the principal sources of cash during fiscal year 2016
were net cash provided by operating activities and borrowings
under their prior senior credit facility. Their principal uses of
cash during fiscal year 2016 were for capital expenditures,
principal repayments under their prior senior credit facility,
common stock repurchases and dividend payments. Cash flows
from discontinued operations are combined with the cash flows
from continuing operations within each of the categories on
their statement of cash flows.
Flanigan’s
The Liquidity has changed in the last three years favorable way.
In 2018 is the year with more cash and less accounts receivable.
Although the inventory and accounts payable has increased with
respect to 2017 and 2016, but it has not affected the company's
liquidity capacity.
As of September 29, 2018, the company had cash of
approximately $13,414,000, an increase of $3,529,000 from
their cash balance of $9,885,000 as of September 30, 2017.
Their cash increased during the first quarter of their fiscal year
65. 2018, because the company borrowed $3.50 million from their
Credit Line just prior to its conversion to the Term Loan on
December 28, 2017.
V. Activity analysis
Inventory turnover
Ruth’s
Inventory turnover ratio can be defined as a ratio showing how
many times a company's inventory is sold and replaced over a
period. Saying this we can notice that in year 2016 was the year
when the inventory was sales over 37 days approximately, even
though doesn’t have a material variation during the last three
years.
Flanigan’s
Inventory turnover ratio can be defined as a ratio showing how
many times a company's inventory is sold and replaced over a
period. Saying this we can notice that in year 2016 and 2017
were the years when the inventory were sales over 15 days
approximately, even though doesn’t have a material variation
during the last three years
Accounts Receivable Turnover
Receivable turnover from 2016 to 2018 prove that both
companies are effectives in extending credit as well as
collecting debts.
Days of Receivable
Ruth’s
Flanigan’s has the lower of days sales in receivables from 2016
to 2018. Days sales in receivables can be defined as the average
number of days it takes to collect outstanding receivable
amounts from customers which is between 2 and 1 days.
Although Ruth’s has between 19 and 15 days.
VI. Solvency ratios
Debt ratio
The ratios aren’t greater than 1 showing that the debt isn’t
66. funded by assets. In other words, the companies has more assets
then liabilities.
A high ratio also indicates that a company may be putting itself
at a risk of default on its loans if interest rates were to rise
suddenly. A lower the debt ratio, the less leverages a company
is, implying greater financial risk. At the same time, leverage is
an important tool that companies use to grow, and many
businesses find sustainable uses for debt.
In this case during the three years Flanigan’s has the lower
ratio.
VII. Probability ratios
Gross profit margin are used to measure a company's
profitability at various cost levels, including gross margin,
operating margin, pretax margin, and net profit margin. The
margins shrink as layers of additional costs are taken into
consideration, such as the cost of goods sold (COGS), operating
and nonoperating expenses, and taxes paid.
Gross margin measures how much a company can mark up sales
above COGS. Operating margin is the percentage of sales left
after covering additional operating expenses. The pretax margin
shows a company's profitability after further accounting for
non-operating expenses. Net profit margin concerns a company's
ability to generate earnings after taxes.
Flanigan’s has the best Gross profit margin between both
company current profit margin of 59%
Return on total assets Profitability is assessed relative to costs
and expenses, and it is analyzed in comparison to assets to see
how effective a company is in deploying assets to generate sales
and eventually profits. The term return in the ROA ratio
customarily refers to net profit or net income, the amount of
earnings from sales after all costs, expenses, and taxes.
The more assets a company has amassed, the more sales and
potentially more profits the company may generate. As
economies of scale help lower costs and improve margins,
returns may grow at a faster rate than assets, ultimately
67. increasing return on assets.
Every dollar that Flanigan’s has invested in assets generates
8.01 cents of net income. Flanigan’s is better at converting its
investment into profits, compared with Ruth’s.
VIII. Horizontal and vertical analysis
Ruth’s
Fiscal Year 2018 Compared to Fiscal Year 2017
Restaurant sales increased $37.0 million, or 9.5%, to $427.4
million during fiscal year 2018 from fiscal year 2017. The
increase was attributable to a $41.1 million increase in new or
relocated restaurants offset by a $4.1 million decrease from
comparable Company-owned restaurants. Excluding
discontinued operations, total operating weeks during fiscal
year 2018 increased to 4,027 from 3,715 during fiscal year
2017. The 53rd week contributed $12.4 million in sales in fiscal
year 2017. Comparable Company-owned restaurant sales
increased 1.4% on a comparable 52-week basis, which consisted
of an average check increase of 1.7%, and 0.3% decrease in
traffic counts. Comparable restaurant sales and traffic were
negatively affected by approximately 50 basis points due to the
shift of the New Year’s Eve holiday into fiscal year 2019. New
restaurant sales primarily increased in fiscal year 2018 due to
an increase in 294 operating weeks from the acquisition of the
Hawaiian Restaurants in December 2017.
Franchise income increased $374 thousand, or 2.1%, to $17.9
million during fiscal year 2018 from fiscal year 2017. The
increase is primarily attributable to the reclassification of $1.5
million in franchisee advertising fees due to the adoption of
Topic 606 and an increase in comparable franchisee-owned
restaurant sales of 1.0%. This was offset by the acquisition of
the Hawaii Restaurants which decreased sales-based royalty
income by $1.6 million during fiscal year 2018.
Other operating income increased $138 thousand, or 2.0%, to
$7.0 million during fiscal year 2018 from fiscal year 2017.
Other operating income includes their share of income from
68. managed restaurants, gift card breakage revenue and
miscellaneous restaurant income. The increase in other
operating income was primarily due to an increase of $106
thousand in income from restaurants operating under contractual
agreements, including the new location in Reno, NV.
Food and beverage costs increased $3.8 million, or 3.2%, to
$120.1 million during fiscal year 2018 from fiscal year 2017.
Food and beverage costs, as a percentage of restaurant sales,
decreased 170 basis points to 28.1% compared to fiscal year
2017 largely due to a decrease of 8.4% in total beef costs and an
increase in average check of 1.7%.
Restaurant operating expenses increased $20.8 million, or
11.2%, to $206.3 million during fiscal year 2018 from fiscal
year 2017. Restaurant operating expenses, as a percentage of
restaurant sales, increased 75 basis points to 48.3% compared to
fiscal year 2017 primarily due to an increase in occupancy
expenses.
Marketing and advertising expenses increased $3.9 million, or
30.8% to $16.6 million during fiscal year 2018 from fiscal year
2017. Marketing and advertising, as a percent of total revenue,
increased 60 basis points to 3.7% compared to fiscal year 2017.
The increase in marketing and advertising expenses during
fiscal year 2018 was attributable to a planned increase in
advertising in addition to the reclassification of $1.7 million in
certain administrative support costs that have been historically
charged to general and administrative costs.
General and administrative expenses increased $4.6 million or
13.9% to $37.3 million during fiscal year 2018 from fiscal year
2017. The increase in general and administrative costs was
primarily attributable to $3.5 million in incentive- based
compensation costs and $906 thousand in Hawaii Restaurants
acquisition and integration costs.
Depreciation and amortization expense increased $3.5 million to
$18.5 million during fiscal year 2018, primarily due to property
additions related to new restaurants and remodel projects placed
in service within the last twelve months including $2.5 million
69. of depreciation and amortization related to the Hawaii
Restaurants.
Pre-opening costs remained relatively unchanged at $1.9 million
in fiscal year 2018 compared to $2.0 million in fiscal year 2017.
During fiscal year 2018 we incurred no loss on impairment
charges, compared to fiscal year 2017, during which we
recognized a $3.9 million loss on impairment of long-lived
assets at a Ruth’s Chris Steak House restaurant.
Interest expense increased $918 thousand to $1.7 million during
fiscal year 2018 from fiscal year 2017. The increase in expense
was primarily due to higher average debt balances during fiscal
year 2018 compared to fiscal year 2017.
During fiscal year 2018 we recognized $73 thousand of other
expense. During fiscal year 2017 we recognized $53 thousand of
other income.
During fiscal year 2018 we recognized $8.2 million in income
tax expense. The effective tax rate, including the impact of
discrete items, decreased to 16.5% during fiscal year 2018
compared to 34.1% during fiscal year 2017. The effective tax
rate decreased during fiscal year 2018 primarily due to the
passage of the 2017 Tax Act, which was signed into law on
December 22, 2017. The 2017 Tax Act significantly revised
U.S. tax law, and included many changes that impacted the
Company, most notably a reduction of the statutory corporate
tax rate from 35% to 21%.
Income from continuing operations of $41.6 million during
fiscal year 2018 increased by $11.4 million compared to fiscal
year 2017 due to the factors noted above.
Income (loss) from discontinued operations, net of income taxes
during fiscal year 2018 was income of $80 thousand compared
to a loss of $108 thousand during fiscal year 2017. Discontinued
operations includes the recurring revenues and expenses of
closed restaurants and related income taxes.
Net income was $41.7 million during fiscal year 2018 compared
to $30.1 million net income during fiscal year 2017 due to the
factors noted above.
70. Fiscal Year 2017 Compared to Fiscal Year 2016
Restaurant sales increased $27.3 million, or 7.5%, to $390.4
million during fiscal year 2017 from fiscal year 2016. The
increase was attributable to a $14.5 million increase in
comparable Company-owned restaurant sales and $12.8 million
from new or relocated restaurants. Excluding discontinued
operations, total operating weeks during fiscal year 2017
increased to 3,715 from 3,489 during fiscal year 2016. The 53rd
week contributed $12.4 million in sales in fiscal year 2017.
Comparable Company-owned restaurant sales increased 1.0% on
a comparable 53-week basis, which consisted of an average
check increase of 1.0%, and flat traffic.
Franchise income increased $244 thousand, or 1.4%, to $17.5
million during fiscal year 2017 from fiscal year 2016. The
increase is primarily attributable to an increase in comparable
franchisee-owned restaurant sales of 1.3% offset by a $90
thousand decrease in fees from new or re-located locations or
ownership transfers
Other operating income increased $1.3 million, or 24.5%, to
$6.8 million during fiscal year 2017 from fiscal year 2016.
Other operating income includes their share of income from
managed restaurants, gift card breakage revenue and
miscellaneous restaurant income. The increase in other
operating income was primarily due to an increase of $972
thousand in income from restaurants operating under contractual
agreements, including the new location in Tulsa, OK. Fiscal
year 2017 gift card breakage revenue increased $326 thousand
from fiscal year 2016 due to an increase in gift card sales.
Food and beverage costs increased $9.3 million, or 8.7%, to
$116.4 million during fiscal year 2017 from fiscal year 2016.
Food and beverage costs, as a percentage of restaurant sales,
increased 32 basis points to 29.8% compared to fiscal year 2016
largely due to a 4.2% increase in total beef costs.
Restaurant operating expenses increased $12.4 million, or 7.2%,
to $185.4 million during fiscal year 2017 from fiscal year 2016.
Restaurant operating expenses, as a percentage of restaurant
71. sales, decreased 14 basis points to 47.5% compared to fiscal
year 2016 primarily due to a reduction in performance-based
compensation.
Marketing and advertising expenses increased $1.3 million, or
11.6% to $12.7 million during fiscal year 2017 from fiscal year
2016. Marketing and advertising, as a percent of total revenue,
increased 11 basis points to 3.1% compared to fiscal year 2016.
The increase in marketing and advertising expenses during
fiscal year 2017 was attributable to a planned increase in
advertising.
General and administrative expenses increased $1.2 million or
3.8% to $32.7 million during fiscal year 2017 from fiscal year
2016. General and administrative expenses, as a percentage of
total revenue decreased from 8.2% in fiscal year 2016 to 7.9%
in fiscal year 2017 primarily driven by the leverage of the 53rd
week in fiscal year 2017.
Depreciation and amortization expense increased $1.6 million to
$15.0 million during fiscal year 2017, primarily due to property
additions related to new restaurants and remodel projects placed
in service in fiscal years 2016 and 2017.
Pre-opening costs remained relatively unchanged at $2.0
million, during both fiscal years 2017 and 2016.
During fiscal year 2017 we recognized a $3.9 million loss on
impairment related to the impairment of long-lived assets at a
Ruth’s Chris Steak House restaurant.
Interest expense decreased $333 thousand to $821 thousand
during fiscal year 2017 from fiscal year 2016. The decrease in
expense was primarily due to $302 thousand in lower
amortization of deferred financing costs during fiscal year 2017
compared to fiscal year 2016.
During fiscal year 2017 we recognized $53 thousands of other
income. During fiscal year 2016 we recognized $10 thousands
of other income.
During fiscal years 2017 and 2016 we recognized $15.7 million
in income tax expense. The effective tax rate increased to
34.1% during fiscal year 2017 compared to 33.7% during fiscal
72. year 2016. The increase in the effective tax rate in 2017 was
primarily due to the $1.1 million expense recognized related to
the remeasurement of the Company’s net deferred tax assets
resulting from the passage of the Tax Cuts and Jobs Act (the
“2017 Tax Act”), partially offset by a 160 basis point reduction
in their state income taxes.
The 2017 Tax Act significantly revised many aspects of U.S. tax
law, most notably reducing the statutory corporate tax rate from
35% to 21% effective January 1, 2018. Since the 2017 Tax Act
was signed into law on December 22, 2017, the Company was
required to remeasure its net deferred tax assets to reflect the
lower tax rate at which they were expected to be realized. The
revaluation of the Company’s net deferred tax assets resulted in
a one-time, non-cash tax charge of $1.1 million.
Income from continuing operations of $30.2 million during
fiscal year 2017 decreased by $510 thousand compared to fiscal
year 2016 due to the factors noted above.
Loss from discontinued operations, net of income taxes during
fiscal year 2017 was a loss of $108 thousand compared to a loss
of $290 thousand during fiscal year 2016. Discontinued
operations includes the recurring revenues and expenses of
closed restaurants and related income taxes. The fiscal year
2017 loss from discontinued operations is primarily attributable
to expenses related to the Mitchell’s Restaurants. The fiscal
year 2016 loss from discontinued operations is primarily
attributable to $842 thousand of occupancy related costs from a
closed Ruth’s Chris Steak House restaurant partially offset by a
$466 thousand benefit from the extinguishment of a liability
related to Mitchell’s Restaurant gift cards and a $186 thousand
income tax benefit.
Flanigan’s
Restaurant revenue generated from the sale of food, including
non-alcoholic beverages, at restaurants totaled $70,545,000 for
their fiscal year 2018 as compared to $66,917,000 for their
fiscal year 2017. The increase in restaurant revenue from the
sale of food at restaurants for their fiscal year 2018 as compared
73. to their fiscal year 2017 is due to the Price Increases 2017 and
increased restaurant traffic. Comparable weekly restaurant food
sales (for restaurants open for all of their fiscal years 2018 and
2017, which consists of ten restaurants owned by us and eight
restaurants owned by affiliated limited partnerships) was
$1,357,000 and $1,287,000 for their fiscal years 2018 and 2017,
respectively, an increase of 5.44%. Comparable weekly
restaurant food sales for Company owned restaurants only was
$714,000 and $679,000 for their fiscal years 2018 and 2017,
respectively, an increase of 5.15%. Comparable weekly
restaurant food sales for affiliated limited partnership owned
restaurants only was $643,000 and $608,000 for their fiscal
years 2018 and 2017, respectively, an increase of 5.76%. We
anticipate that restaurant revenue from the sale of food for their
fiscal year 2019 will decrease when compared to their fiscal
year 2018 due to the fire at their Store #19 subsequent to the
end of their fiscal year 2018, which we expect will cause this
location to be closed for their entire fiscal year 2019, offset to a
lesser extent by increased restaurant traffic. Fiscal year 2018
restaurant revenue from the sale of food for their Store #19 was
$3,498,000.
Restaurant revenue generated from the sale of alcoholic
beverages at restaurants totaled $21,760,000 for their fiscal year
2018 as compared to $20,476,000 for their fiscal year 2017. The
increase in restaurant revenue from the sale of alcoholic
beverages from restaurants for their fiscal year 2018 as
compared to their fiscal year 2017 is due to the Price Increases
2017 and increased traffic, but also partially due to the price
discounts offered by the Company to promote its Joe’s Pale Ale
draft beer during the second and third quarters of their fiscal
year 2017. Comparable weekly restaurant bar sales (for
restaurants open for all of their fiscal years 2018 and 2017,
which consists of ten restaurants owned by us and eight
restaurants owned by affiliated limited partnerships) was
$418,000 and $393,000 for their fiscal years 2018 and 2017,
respectively, an increase of 6.36%. Comparable weekly
74. restaurant bar sales for Company owned restaurants only was
$197,000 and $188,000 for their fiscal years 2018 and 2017,
respectively, an increase of 4.79%. Comparable weekly
restaurant bar sales for affiliated limited partnership owned
restaurants only was $221,000 and $205,000 for their fiscal
years 2018 and 2017, respectively, an increase of 7.80%. We
anticipate that restaurant revenue from the sale of alcoholic
beverages at restaurants for their fiscal year 2019 will decrease
when compared to their fiscal year 2018 due to the fire at their
Store #19 subsequent to the end of their fiscal year 2018, which
we expect will cause this location to be closed for their entire
fiscal year 2019, offset to a lesser extent by increased restaurant
traffic. Fiscal year 2018 restaurant revenue from the sale of
alcoholic beverages at restaurants for their Store #19 was
$748,000.
Revenue generated from sales of liquor and related items at
package liquor stores totaled $18,559,000 for their fiscal year
2018 as compared to $16,842,000 for their fiscal year 2017, an
increase of $1,717,000 or 10.19%. This increase was primarily
due to increased package liquor store traffic. The weekly
average of same store package liquor store sales, which includes
all nine (9) Company owned package liquor stores, was
$357,000 and $324,000 for their fiscal years 2018 and 2017,
respectively. We anticipate that revenue generated from the sale
of liquor and related items at package liquor stores for their
fiscal year 2019 will increase when compared to their fiscal
year 2018, but that the increase will be offset by a loss of
revenue due to the fire at their Store #19 subsequent to the end
of their fiscal year 2018, which we expect will cause this
location to be closed for their entire fiscal year 2019, offset to a
lesser extent by increased package liquor store traffic. Fiscal
year 2018 revenue from sales of liquor and related items at
package liquor stores at their Store #19 was $1,087,000.
Operating costs and expenses, (consisting of cost of
merchandise sold, payroll and related costs, occupancy costs
and selling, general and administrative expenses), for their
75. fiscal year 2018 increased $5,489,000 or 5.46% to $106,053,000
from $100,564,000 for their fiscal year 2017. The increase was
primarily due to an expected general increase in food costs,
offset by actions taken by management to reduce and/or control
costs and expenses. We anticipate that their operating costs and
expenses will increase through their fiscal year 2019 due to an
expected general increase in food costs, offset by the
elimination of most operating costs and expenses at their Store
#19 due to the fire subsequent to the end of their fiscal year
2018, which will cause this location to be closed for their entire
fiscal year 2019. Fiscal year 2018 operating costs and expenses
at their Store #19 was $2,211,000. Operating costs and expenses
decreased as a percentage of total sales to approximately
93.44% in their fiscal year 2018 from 94.14% in their fiscal
year 2017.
Gross profit for food and bar sales for their fiscal year 2018
increased to $60,172,000 from $55,786,000 for their fiscal year
2017. Their gross profit margin for restaurant food and bar sales
(calculated as gross profit reflected as a percentage of
restaurant food and bar sales), was 65.19% for their fiscal year
2018 and 63.83% for their fiscal year 2017. The increase in
gross profit margin for food sales and bar sales was due
primarily to the Price Increases 2017. We anticipate that their
gross profit for restaurant food and bar sales will decrease
during their fiscal year 2019 primarily to higher food costs.
Gross profit for package liquor store sales for their fiscal year
2018 increased to $5,180,000 from $4,808,000 for their fiscal
year 2017. Their gross profit margin (calculated as gross profit
reflected as a percentage of package liquor store sales) for
package liquor store sales was 27.91% for their fiscal year 2018
and 28.55% for their fiscal year 2017. We anticipate that their
gross profit margin for package liquor store sales will decrease
during their fiscal year 2019 due to price adjustments to remain
competitive with local competitors.
Payroll and related costs for their fiscal year 2018 increased
$2,073,000 or 6.32% to $34,868,000 from $32,795,000 for their
76. fiscal year 2017 due partially to payroll and related costs
associated with higher restaurant sales which require additional
payroll and related costs for employees such as cooks and
bartenders and higher pay rates. Payroll and related costs as a
percentage of total sales was 30.72% for their fiscal year 2018
as compared to 30.70% for their fiscal year 2017. We anticipate
that their payroll and related costs will decrease through their
fiscal year 2019 due to the elimination of most payroll and
related costs at their Store #19 due to the fire subsequent to the
end of their fiscal year 2018, which will cause this location to
be closed for their entire fiscal year 2019. Fiscal year 2018
payroll and related costs at their Store #19 was $1,494,000.
Occupancy costs (consisting of rent, common area maintenance,
repairs, real property taxes and amortization of leasehold
interests) for their fiscal year 2018 increased $294,000 or 5.41%
to $5,726,000 from $5,432,000 for their fiscal year 2017. We
anticipate that their occupancy costs will remain stable
throughout their fiscal year 2019.
Selling, general and administrative expenses (consisting of
general corporate expenses, including but not limited to
advertising, insurance, professional costs, clerical and
administrative overhead) for their fiscal year 2018 increased
$1,251,000 or 6.69% to $19,947,000 from $18,696,000 for their
fiscal year 2017. Selling, general and administrative expenses
increased as a percentage of total sales in their fiscal year 2018
to 17.57% as compared to 17.50% in their fiscal year 2017. We
anticipate that their selling, general and administrative expenses
will increase throughout their fiscal year 2019 due primarily to
increases across all categories.
Depreciation and amortization for their fiscal year 2018, which
is included in selling, general and administrative expenses,
increased $136,000 or 5.10% to $2,803,000 from $2,667,000 for
their fiscal year 2017. As a percentage of revenue, depreciation
and amortization expense was 2.47% of revenue for their fiscal
year 2018 and 2.50% of revenue for their fiscal year 2017.
Interest expense for their fiscal year 2018 increased $153,000 to
77. $753,000 from $600,000 for their fiscal year 2017. The increase
in interest expense, net, is due to their borrowing the available
balance on their Credit Line ($3.5 million for a total amount
borrowed on the Credit Line of $5.5 million) during the first
quarter of their fiscal year 2018. We anticipate that interest
expense will remain stable throughout their fiscal year 2019.
Income taxes for their fiscal year 2018 was $1,371,000 and
$1,370,000 for their fiscal year 2017. Income taxes during their
fiscal year 2018 were approximately equal to their fiscal year
2017 due to a reduction of $336,000 to their deferred tax asset
due to the corporate tax rate reduction, which reduction was a
part of their current tax expense during the thirteen weeks
ended December 31, 2017.
Net income for their fiscal year 2018 increased $1,000,000 or
22.78% to $5,390,000 from $4,390,000 for their fiscal year
2017. Net income for their fiscal year 2018 increased when
compared to their fiscal year 2017 primarily due higher revenue
and the Price Increases 2017, offset by increased food costs and
overall expenses. As a percentage of sales, net income for their
fiscal year 2018 is 4.75%, as compared to 4.11% for their fiscal
year 2017.
Net income attributable to stockholders for their fiscal year
2018 increased $657,000 or 21.75% to $3,677,000 from
$3,020,000 for their fiscal year 2017. Net income attributable to
stockholders for their fiscal year 2018 increased when compared
to their fiscal year 2017 primarily due to the Price increases
2017, offset by increased food costs and overall expenses. As a
percentage of sales, net income for their fiscal year 2018 is
3.24%, as compared to 2.83% for their fiscal year 2017.
Liquidity and Capital Resources
We fund their day to day operations through cash generated
from operations. As of September 29, 2018, we had cash of
approximately $13,414,000, an increase of $3,529,000 from
their cash balance of $9,885,000 as of September 30, 2017.
Their cash increased during the first quarter of their fiscal year
2018, because we borrowed $3.50 million from their Credit Line
78. just prior to its conversion to the Term Loan on December 28,
2017. During the second quarter of their fiscal year 2018, we
paid on March 30, 2018 a dividend of $.25 per share and during
the fourth quarter of their fiscal year 2018, we also purchased
the real property and improvements which are contiguous to the
real property we own where their franchised restaurant located
at 1479 E. Commercial Boulevard, Fort Lauderdale, Florida
(Store #15) operates for $550,000 cash at closing. We believe
that their current cash availability from their cash on hand,
positive cash flow from operations and borrowed funds will be
sufficient to fund their operations and planned capital
expenditures for at least the next twelve months.
Capital Expenditures
In addition to using cash for their operating expenses, we use
cash to fund the development and construction of new
restaurants and to fund capitalized property improvements for
their existing restaurants. We acquired property and equipment
of $5,511,000, (of which $81,000 was for the purchase of a
vehicle for debt; $2,486,000 was for construction in progress;
and $146,000 was deposits recorded in other assets as of
September 30, 2017), during their fiscal year 2018, which
amount included $446,000 for renovations to four(4) existing
Company owned restaurants. We acquired property and
equipment of $7,220,000, (of which $24,000 was for the
purchase of a vehicle for debt; $2,419,000 was for construction
in progress; and $489,000 was deposits recorded in other assets
as of October 1, 2016), during their fiscal year 2017, which
amount included $2.475 million for the purchase of real
property, $1,272,000 for construction and redevelopment of a
new package store on the same, $635,000 for the construction of
a catering kitchen and $428,000 for renovations to four (4)
existing Company owned restaurant and two (2) existing
Company owned package liquor stores. We anticipate the cost
of this refurbishment in their fiscal year 2019 will be
approximately $450,000, which funds will be provided from
operations.
79. Debt
As of September 29, 2018, the end of their fiscal year 2018, we
had long term debt of $14,576,000, as compared to $12,398,000
as of September 30, 2017. Their long term debt increased as of
September 29, 2018 as compared to September 30, 2017 due to
the $3,500,000 we borrowed on their Credit Line (now included
as part of the Term Loan). As of September 29, 2018, we are in
compliance with the covenants of all loans with their lender.
We repaid long term debt, including auto loans, financed
insurance premiums and mortgages in the amount of $2,500,000
and $1,793,000 in their fiscal years 2018 and 2017,
respectively.
The working capital increased by 57.48% as of September 29,
2018 from September 30, 2017 primarily due to the $3,500,000
we borrowed against their Credit Line during their fiscal year
2018 prior to the Credit Line converting to the Term Loan.
During their fiscal year 2018, we used working capital of
approximately $2,157,000 towards the renovation of their
restaurant located at 13205 Biscayne Boulevard, North Miami,
Florida. We also used $550,000 to fund the purchase price of
their acquisition of the real property and improvements
contiguous to the real property we own where their franchised
restaurant located at 1479 E. Commercial Boulevard, Fort
Lauderdale, Florida (Store #15) operates. During their fiscal
year 2017, we used working capital of approximately
$1,272,000 to build a new building on a parcel of real property
we own which is near their combination package liquor store
and restaurant located at 13205 Biscayne Boulevard, North
Miami, Florida, (Store #20) and re-located their package liquor
store to the new building. We also used $2,475,000, ($2,000,000
of which was drawn on their Credit Line), to fund the purchase
price of their acquisition of the vacant real property which is
contiguous to the real property we own where their new package
liquor store located at 13185 Biscayne Boulevard, North Miami,
Florida, (Store #20P) and their restaurant located at 13205
Biscayne Boulevard, North Miami, Florida (Store #20R)
80. operate. We also used $635,000 for the construction of a
catering kitchen adjacent to their restaurant located at 2600
Davie Boulevard, Fort Lauderdale, Florida.
IX. Comparative analysis
Creditworthiness is how a lender determines that you
will default on your debt obligations, or how worthy you are to
receive new credit. The creditworthiness is what creditors look
at before they approve any new credit to you.
Creditworthiness is determined by several factors including the
repayment history and credit score. Some lending institutions
also consider available assets and the number of liabilities you
have when they determine the probability of default.
Both company can be attractive to investors’ but Flanigan’s is
more attractive in general.
XII. Appendices
Ruth’s
Table page 36 Income Statement 2018-2016
Table page 43 Vertical Income Statement 2018-2016
Table page 75 Balance Sheet 2018-2017
Table Page 76 Income Statement 2018-2016
Flanigan’s
Table page 66 Balance Sheet 2018-2017
Table Page 68 Income Statement 2018-2017