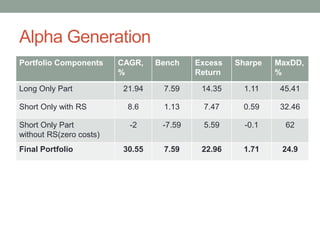
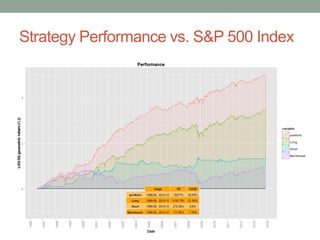
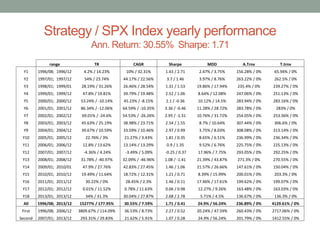
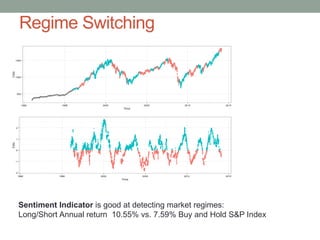
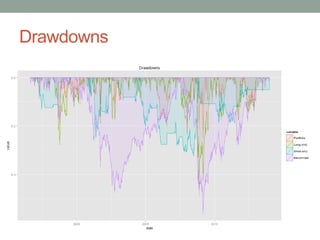
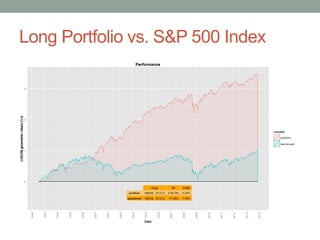
SYSTEMATIC STOCK
PICKING STRATEGY
Summary
• Fully systematic strategy based on scoring algorithm to
assemble stocks for long and short portfolios
• Short only-part of the portfolio substantially reduces
drawdowns during turbulent times.
• Regime switching indicator to switch on and off short
component.
• Two independently profitable substrategies, to get the
final more robust portfolio.
• Simulated performance from 1996 of
• CAGR: 30%
• Sharpe: 1.71
Alpha Generation
• Long-only part of the portfolio generates 22% vs SPX
generates 7.59%
• Short only part of the portfolio generates 8.6% vs
benchmark of 1.13%
• Combining long and short reduces drawdowns and
achieves the total performance of 30% with Sharpe 1.71
Alpha Generation
Portfolio Components CAGR,
%
Bench Excess
Return
Sharpe MaxDD,
%
Long Only Part 21.94 7.59 14.35 1.11 45.41
Short Only with RS 8.6 1.13 7.47 0.59 32.46
Short Only Part
without RS(zero costs)
-2 -7.59 5.59 -0.1 62
Final Portfolio 30.55 7.59 22.96 1.71 24.9
Strategy Performance vs. S&P 500 Index
Strategy / SPX Index yearly performance
Ann. Return: 30.55% Sharpe: 1.71
range TR CAGR Sharpe MDD A.Trnv T.trnv
Y1 1996/08; 1996/12 4.2% / 14.23% 10% / 32.31% 1.43 / 2.71 2.47% / 3.75% 156.28% / 0% 65.94% / 0%
Y2 1997/01; 1997/12 54% / 23.74% 44.17% / 22.56% 3.7 / 1.46 3.97% / 8.76% 263.22% / 0% 262.5% / 0%
Y3 1998/01; 1999/01 28.19% / 31.26% 26.46% / 28.54% 1.31 / 1.53 19.86% / 17.94% 235.4% / 0% 239.27% / 0%
Y4 1999/01; 1999/12 47.8% / 19.81% 39.79% / 19.48% 2.52 / 1.06 8.64% / 12.08% 247.06% / 0% 251.13% / 0%
Y5 2000/01; 2000/12 53.24% / -10.14% 45.23% / -8.15% 2.1 / -0.36 10.12% / 14.5% 283.94% / 0% 283.16% / 0%
Y6 2001/01; 2001/12 86.34% / -12.06% 64.59% / -10.35% 3.36 / -0.46 11.28% / 28.72% 283.78% / 0% 283% / 0%
Y7 2002/01; 2002/12 69.01% / -24.6% 54.53% / -26.26% 2.95 / -1.31 10.76% / 31.72% 254.05% / 0% 253.36% / 0%
Y8 2003/01; 2003/12 45.63% / 25.19% 38.98% / 23.71% 2.54 / 1.55 8.7% / 10.64% 307.44% / 0% 306.6% / 0%
Y9 2004/01; 2004/12 39.67% / 10.59% 33.59% / 10.46% 2.97 / 0.99 3.75% / 8.03% 308.08% / 0% 313.14% / 0%
Y10 2005/01; 2005/12 22.76% / 3% 21.27% / 3.43% 1.81 / 0.35 8.65% / 6.51% 236.99% / 0% 236.34% / 0%
Y11 2006/01; 2006/12 12.8% / 13.62% 13.14% / 13.29% 0.9 / 1.35 9.52% / 6.76% 225.75% / 0% 225.13% / 0%
Y12 2007/01; 2007/12 -4.36% / 4.24% -3.49% / 5.09% -0.25 / 0.37 17.96% / 7.75% 293.05% / 0% 292.25% / 0%
Y13 2008/01; 2008/12 31.78% / -40.97% 32.09% / -46.96% 1.08 / -1.41 21.39% / 43.87% 271.3% / 0% 270.55% / 0%
Y14 2009/01; 2010/01 47.9% / 27.76% 42.83% / 27.45% 1.46 / 1.06 21.57% / 26.66% 147.61% / 0% 150.04% / 0%
Y15 2010/01; 2010/12 19.49% / 11.64% 18.72% / 12.31% 1.21 / 0.71 8.39% / 15.99% 200.01% / 0% 203.3% / 0%
Y16 2011/01; 2011/12 30.22% / 0% 28.45% / 2.3% 1.46 / 0.11 17.46% / 17.61% 199.62% / 0% 199.07% / 0%
Y17 2012/01; 2012/12 0.01% / 11.52% 0.78% / 11.63% 0.06 / 0.98 12.27% / 9.26% 163.48% / 0% 163.03% / 0%
Y18 2013/01; 2013/12 34% / 31.3% 30.04% / 27.87% 2.68 / 2.78 5.71% / 4.5% 136.67% / 0% 136.3% / 0%
All 1996/08; 2013/12 15277% / 177.95% 30.55% / 7.59% 1.71 / 0.41 24.9% / 56.24% 236.89% / 0% 4129.61% / 0%
First 1996/08; 2006/12 3809.67% / 114.09% 36.53% / 8.73% 2.27 / 0.52 20.24% / 47.59% 260.43% / 0% 2717.06% / 0%
Second 2007/01; 2013/12 293.31% / 29.83% 21.62% / 5.91% 1.07 / 0.28 24.9% / 56.24% 201.79% / 0% 1412.55% / 0%
Regime Switching
Sentiment Indicator is good at detecting market regimes:
Long/Short Annual return 10.55% vs. 7.59% Buy and Hold S&P Index
Sentiment indicator summary
• Using Sentiment Indicator to Open/Close short only portfolio
depending on the market sentiment
• Calculating the composite index from:
• VIX Index, Put-Call ratio, NYSE Margin Debt, NYSE Volume , AAII
sentiment, Dividend Premium, Closed-end funds premium, first-year
IPO return.
• Controlling for the economic cycle by regressing the index to
macro data:
• Industrial production; Consumer consumption – non-durables,
durables, services; Payments; Utility rate.
• Use the residuals from the regressions to determine sentiment
phase of market as:
• “BEAR”
• “BULL”
This indicator allows to increase the annual performance of the
short only portfolio from -5% to 8%
Testing the strategy on historical data
• Analyzing about 3000 companies at any point in time
• Using the historical data from S&P Capital IQ (Compustat DB)
• No survivorship bias
• Point-in-time data: fundamental and macro data as they were seen on
any particular date
• Quarterly financial data from 1990
• Standardized data
• Weekly rebalancing
• Equal weighted portfolio with max. weight 7% per position
• Conservative commission of 0.2%
• Borrowing costs: 5%
• Sentiment Indicator for Regime Switching
• Using official data from FRED
• Trailing 5-years window
Strategy Details: Score Calculations
• Create composite value score as sum of four individual scores
• derived from fundamentals: profitability, growth, safety, payout,
• using about 40 corporate fundamentals from standardized reports
• filter out the companies with capitalization less then median.
• Long Only Portfolio
• Pick up companies with the highest overall composite score and
lowest P/B
• Short-Only Portfolio
• Pick up companies with the lowest individual scores and highest P/B
for short-side portfolio
• Move to cash depending on the current market regime
For each company in the asset universe we derive a score which
defines its position relative to the others.
ADDITIONAL STATISTICS
Drawdowns
Market Cap Distributions:
largest 100 mcap steps 14%
20%
34%
24%
8%
Long
26%
32%
25%
14%
3%
Short
17%
24%
31%
21%
7%
Total Portfolio
1-5
6-10
11-15
16-20
21-25
Current possible lowest cap at 1.6 bln
Long Portfolio vs. S&P 500 Index
Statistics: Long Portfolio / SPX Index
Ann. Return: 21.94 Sharpe: 1.11
range TR CAGR Sharpe MDD A.Trnv T.trnv
Y1 1996/08; 1996/12 2.95% / 14.23% 7.06% / 32.31% 1.18 / 2.71 1.68% / 3.75% 108.17% / 0% 45.64% / 0%
Y2 1997/01; 1997/12 41.34% / 23.74% 35.28% / 22.56% 3.6 / 1.46 5.98% / 8.76% 141.79% / 0% 141.4% / 0%
Y3 1998/01; 1999/01 13.79% / 31.26% 14.94% / 28.54% 0.7 / 1.53 27.79% / 17.94% 189.95% / 0% 193.07% / 0%
Y4 1999/01; 1999/12 18.15% / 19.81% 17.56% / 19.48% 1.15 / 1.06 11.74% / 12.08% 174.11% / 0% 176.97% / 0%
Y5 2000/01; 2000/12 22.25% / -10.14% 21.36% / -8.15% 1.37 / -0.36 6.86% / 14.5% 164.34% / 0% 163.89% / 0%
Y6 2001/01; 2001/12 60.17% / -12.06% 50.29% / -10.35% 2.14 / -0.46 18.9% / 28.72% 129.12% / 0% 128.77% / 0%
Y7 2002/01; 2002/12 12.85% / -24.6% 13.78% / -26.26% 0.75 / -1.31 17.38% / 31.72% 173.9% / 0% 173.42% / 0%
Y8 2003/01; 2003/12 56.04% / 25.19% 45.89% / 23.71% 3.08 / 1.55 6.56% / 10.64% 186.21% / 0% 185.7% / 0%
Y9 2004/01; 2004/12 40.11% / 10.59% 34.42% / 10.46% 2.27 / 0.99 8.64% / 8.03% 152.24% / 0% 154.74% / 0%
Y10 2005/01; 2005/12 21.27% / 3% 20.11% / 3.43% 1.65 / 0.35 5.77% / 6.51% 126.08% / 0% 125.74% / 0%
Y11 2006/01; 2006/12 17.88% / 13.62% 17.27% / 13.29% 1.4 / 1.35 9.52% / 6.76% 172.54% / 0% 172.06% / 0%
Y12 2007/01; 2007/12 3.44% / 4.24% 4.75% / 5.09% 0.29 / 0.37 12.41% / 7.75% 172.12% / 0% 171.65% / 0%
Y13 2008/01; 2008/12 -14.86% / -40.97% -6.78% / -46.96% -0.16 / -1.41 45.41% / 43.87% 190.58% / 0% 190.05% / 0%
Y14 2009/01; 2010/01 51.1% / 27.76% 45.01% / 27.45% 1.53 / 1.06 21.57% / 26.66% 144.86% / 0% 147.24% / 0%
Y15 2010/01; 2010/12 23.56% / 11.64% 22.74% / 12.31% 1.16 / 0.71 17.63% / 15.99% 124.75% / 0% 126.8% / 0%
Y16 2011/01; 2011/12 11.35% / 0% 12.95% / 2.3% 0.62 / 0.11 17.46% / 17.61% 130.83% / 0% 130.47% / 0%
Y17 2012/01; 2012/12 2.08% / 11.52% 2.94% / 11.63% 0.22 / 0.98 14.43% / 9.26% 126.98% / 0% 126.63% / 0%
Y18 2013/01; 2013/12 34% / 31.3% 30.04% / 27.87% 2.68 / 2.78 5.71% / 4.5% 136.67% / 0% 136.3% / 0%
All 1996/08; 2013/12 3138.79% / 177.95% 21.94% / 7.59% 1.11 / 0.41 45.41% / 56.24% 154.08% / 0% 2686.05% / 0%
First 1996/08; 2006/12 1178.17% / 114.09% 25.76% / 8.73% 1.62 / 0.52 27.79% / 47.59% 159.01% / 0% 1658.9% / 0%
Second 2007/01; 2013/12 153.39% / 29.83% 16.26% / 5.91% 0.67 / 0.28 45.41% / 56.24% 146.73% / 0% 1027.14% / 0%
Short Portfolio vs. Short S&P 500 Index
Statistics: Short Strategy / Short SPX Index
Ann. Return: 8.6% Sharpe: 0.59
range TR CAGR Sharpe MDD A.Trnv T.trnv
Y1 1996/08; 1996/12 1.22% / -10.94% 2.94% / -27.23% 0.76 / -2.74 2.01% / 14.47% 48.11% / 0% 20.3% / 0%
Y2 1997/01; 1997/12 8.31% / -15.96% 8.89% / -16.66% 0.67 / -1.37 13.24% / 21.71% 121.43% / 0% 121.1% / 0%
Y3 1998/01; 1999/01 12.13% / 10.9% 11.53% / 10.73% 1.58 / 1.23 0.84% / 3.24% 45.45% / 0% 46.2% / 0%
Y4 1999/01; 1999/12 24.66% / 2.04% 22.23% / 2.34% 2.19 / 0.3 2.62% / 9.95% 72.96% / 0% 74.15% / 0%
Y5 2000/01; 2000/12 23.98% / 11.53% 23.87% / 11.56% 1.1 / 1.08 9.93% / 5.29% 119.6% / 0% 119.27% / 0%
Y6 2001/01; 2001/12 11.93% / 10.94% 14.3% / 12.27% 0.58 / 0.63 24.59% / 16.62% 154.65% / 0% 154.23% / 0%
Y7 2002/01; 2002/12 47.58% / 18.58% 40.75% / 18.99% 2.25 / 0.97 8.1% / 14.44% 80.16% / 0% 79.94% / 0%
Y8 2003/01; 2003/12 -6.89% / -0.57% -6.91% / -0.43% -1 / -0.08 8.31% / 3.56% 121.23% / 0% 120.9% / 0%
Y9 2004/01; 2004/12 -2.36% / -8.26% -0.83% / -8.2% -0.05 / -0.9 20.1% / 12.74% 155.84% / 0% 158.4% / 0%
Y10 2005/01; 2005/12 0.73% / -4.57% 1.17% / -4.33% 0.12 / -0.49 11.67% / 11.83% 110.9% / 0% 110.6% / 0%
Y11 2006/01; 2006/12 -4.34% / -4.21% -4.12% / -4.27% -0.5 / -1.08 6.45% / 4.61% 53.21% / 0% 53.07% / 0%
Y12 2007/01; 2007/12 -8.62% / -4.01% -8.25% / -3.29% -0.65 / -0.25 15.28% / 14.69% 120.93% / 0% 120.6% / 0%
Y13 2008/01; 2008/12 42.27% / 35.74% 38.87% / 38.95% 1.47 / 0.95 14.09% / 19.87% 80.72% / 0% 80.5% / 0%
Y14 2009/01; 2010/01 -2.2% / -0.91% -2.17% / -0.82% -1.4 / -0.18 0.94% / 0.78% 2.75% / 0% 2.8% / 0%
Y15 2010/01; 2010/12 -5.91% / -13.02% -4.02% / -12.63% -0.2 / -0.75 10.82% / 19.8% 75.27% / 0% 76.51% / 0%
Y16 2011/01; 2011/12 16.05% / -4.7% 15.5% / -4.03% 1.46 / -0.31 4.26% / 8.91% 68.79% / 0% 68.6% / 0%
Y17 2012/01; 2012/12 -2.44% / -6.42% -2.16% / -6.31% -0.27 / -0.77 3.76% / 10.21% 36.5% / 0% 36.4% / 0%
Y18 2013/01; 2013/12 0% / 0% 0% / 0% NaN / NaN 0% / 0% 0% / 0% 0% / 0%
All 1996/08; 2013/12 272.38% / 3.75% 8.6% / 1.3% 0.59 / 0.09 32.46% / 41.29% 82.81% / 0% 1443.56% / 0%
First 1996/08; 2006/12 174.93% / 3.6% 10.78% / 1.01% 0.73 / 0.09 27.53% / 31.26% 101.43% / 0% 1058.16% / 0%
Second 2007/01; 2013/12 35.45% / 0.15% 5.36% / 1.72% 0.37 / 0.09 18.63% / 41.29% 55.06% / 0% 385.41% / 0%

Systematic Stock picking strategy

  • 1.
  • 2.
    Summary • Fully systematicstrategy based on scoring algorithm to assemble stocks for long and short portfolios • Short only-part of the portfolio substantially reduces drawdowns during turbulent times. • Regime switching indicator to switch on and off short component. • Two independently profitable substrategies, to get the final more robust portfolio. • Simulated performance from 1996 of • CAGR: 30% • Sharpe: 1.71
  • 3.
    Alpha Generation • Long-onlypart of the portfolio generates 22% vs SPX generates 7.59% • Short only part of the portfolio generates 8.6% vs benchmark of 1.13% • Combining long and short reduces drawdowns and achieves the total performance of 30% with Sharpe 1.71
  • 4.
    Alpha Generation Portfolio ComponentsCAGR, % Bench Excess Return Sharpe MaxDD, % Long Only Part 21.94 7.59 14.35 1.11 45.41 Short Only with RS 8.6 1.13 7.47 0.59 32.46 Short Only Part without RS(zero costs) -2 -7.59 5.59 -0.1 62 Final Portfolio 30.55 7.59 22.96 1.71 24.9
  • 5.
  • 6.
    Strategy / SPXIndex yearly performance Ann. Return: 30.55% Sharpe: 1.71 range TR CAGR Sharpe MDD A.Trnv T.trnv Y1 1996/08; 1996/12 4.2% / 14.23% 10% / 32.31% 1.43 / 2.71 2.47% / 3.75% 156.28% / 0% 65.94% / 0% Y2 1997/01; 1997/12 54% / 23.74% 44.17% / 22.56% 3.7 / 1.46 3.97% / 8.76% 263.22% / 0% 262.5% / 0% Y3 1998/01; 1999/01 28.19% / 31.26% 26.46% / 28.54% 1.31 / 1.53 19.86% / 17.94% 235.4% / 0% 239.27% / 0% Y4 1999/01; 1999/12 47.8% / 19.81% 39.79% / 19.48% 2.52 / 1.06 8.64% / 12.08% 247.06% / 0% 251.13% / 0% Y5 2000/01; 2000/12 53.24% / -10.14% 45.23% / -8.15% 2.1 / -0.36 10.12% / 14.5% 283.94% / 0% 283.16% / 0% Y6 2001/01; 2001/12 86.34% / -12.06% 64.59% / -10.35% 3.36 / -0.46 11.28% / 28.72% 283.78% / 0% 283% / 0% Y7 2002/01; 2002/12 69.01% / -24.6% 54.53% / -26.26% 2.95 / -1.31 10.76% / 31.72% 254.05% / 0% 253.36% / 0% Y8 2003/01; 2003/12 45.63% / 25.19% 38.98% / 23.71% 2.54 / 1.55 8.7% / 10.64% 307.44% / 0% 306.6% / 0% Y9 2004/01; 2004/12 39.67% / 10.59% 33.59% / 10.46% 2.97 / 0.99 3.75% / 8.03% 308.08% / 0% 313.14% / 0% Y10 2005/01; 2005/12 22.76% / 3% 21.27% / 3.43% 1.81 / 0.35 8.65% / 6.51% 236.99% / 0% 236.34% / 0% Y11 2006/01; 2006/12 12.8% / 13.62% 13.14% / 13.29% 0.9 / 1.35 9.52% / 6.76% 225.75% / 0% 225.13% / 0% Y12 2007/01; 2007/12 -4.36% / 4.24% -3.49% / 5.09% -0.25 / 0.37 17.96% / 7.75% 293.05% / 0% 292.25% / 0% Y13 2008/01; 2008/12 31.78% / -40.97% 32.09% / -46.96% 1.08 / -1.41 21.39% / 43.87% 271.3% / 0% 270.55% / 0% Y14 2009/01; 2010/01 47.9% / 27.76% 42.83% / 27.45% 1.46 / 1.06 21.57% / 26.66% 147.61% / 0% 150.04% / 0% Y15 2010/01; 2010/12 19.49% / 11.64% 18.72% / 12.31% 1.21 / 0.71 8.39% / 15.99% 200.01% / 0% 203.3% / 0% Y16 2011/01; 2011/12 30.22% / 0% 28.45% / 2.3% 1.46 / 0.11 17.46% / 17.61% 199.62% / 0% 199.07% / 0% Y17 2012/01; 2012/12 0.01% / 11.52% 0.78% / 11.63% 0.06 / 0.98 12.27% / 9.26% 163.48% / 0% 163.03% / 0% Y18 2013/01; 2013/12 34% / 31.3% 30.04% / 27.87% 2.68 / 2.78 5.71% / 4.5% 136.67% / 0% 136.3% / 0% All 1996/08; 2013/12 15277% / 177.95% 30.55% / 7.59% 1.71 / 0.41 24.9% / 56.24% 236.89% / 0% 4129.61% / 0% First 1996/08; 2006/12 3809.67% / 114.09% 36.53% / 8.73% 2.27 / 0.52 20.24% / 47.59% 260.43% / 0% 2717.06% / 0% Second 2007/01; 2013/12 293.31% / 29.83% 21.62% / 5.91% 1.07 / 0.28 24.9% / 56.24% 201.79% / 0% 1412.55% / 0%
  • 7.
    Regime Switching Sentiment Indicatoris good at detecting market regimes: Long/Short Annual return 10.55% vs. 7.59% Buy and Hold S&P Index
  • 8.
    Sentiment indicator summary •Using Sentiment Indicator to Open/Close short only portfolio depending on the market sentiment • Calculating the composite index from: • VIX Index, Put-Call ratio, NYSE Margin Debt, NYSE Volume , AAII sentiment, Dividend Premium, Closed-end funds premium, first-year IPO return. • Controlling for the economic cycle by regressing the index to macro data: • Industrial production; Consumer consumption – non-durables, durables, services; Payments; Utility rate. • Use the residuals from the regressions to determine sentiment phase of market as: • “BEAR” • “BULL” This indicator allows to increase the annual performance of the short only portfolio from -5% to 8%
  • 9.
    Testing the strategyon historical data • Analyzing about 3000 companies at any point in time • Using the historical data from S&P Capital IQ (Compustat DB) • No survivorship bias • Point-in-time data: fundamental and macro data as they were seen on any particular date • Quarterly financial data from 1990 • Standardized data • Weekly rebalancing • Equal weighted portfolio with max. weight 7% per position • Conservative commission of 0.2% • Borrowing costs: 5% • Sentiment Indicator for Regime Switching • Using official data from FRED • Trailing 5-years window
  • 10.
    Strategy Details: ScoreCalculations • Create composite value score as sum of four individual scores • derived from fundamentals: profitability, growth, safety, payout, • using about 40 corporate fundamentals from standardized reports • filter out the companies with capitalization less then median. • Long Only Portfolio • Pick up companies with the highest overall composite score and lowest P/B • Short-Only Portfolio • Pick up companies with the lowest individual scores and highest P/B for short-side portfolio • Move to cash depending on the current market regime For each company in the asset universe we derive a score which defines its position relative to the others.
  • 11.
  • 12.
  • 13.
    Market Cap Distributions: largest100 mcap steps 14% 20% 34% 24% 8% Long 26% 32% 25% 14% 3% Short 17% 24% 31% 21% 7% Total Portfolio 1-5 6-10 11-15 16-20 21-25 Current possible lowest cap at 1.6 bln
  • 14.
    Long Portfolio vs.S&P 500 Index
  • 15.
    Statistics: Long Portfolio/ SPX Index Ann. Return: 21.94 Sharpe: 1.11 range TR CAGR Sharpe MDD A.Trnv T.trnv Y1 1996/08; 1996/12 2.95% / 14.23% 7.06% / 32.31% 1.18 / 2.71 1.68% / 3.75% 108.17% / 0% 45.64% / 0% Y2 1997/01; 1997/12 41.34% / 23.74% 35.28% / 22.56% 3.6 / 1.46 5.98% / 8.76% 141.79% / 0% 141.4% / 0% Y3 1998/01; 1999/01 13.79% / 31.26% 14.94% / 28.54% 0.7 / 1.53 27.79% / 17.94% 189.95% / 0% 193.07% / 0% Y4 1999/01; 1999/12 18.15% / 19.81% 17.56% / 19.48% 1.15 / 1.06 11.74% / 12.08% 174.11% / 0% 176.97% / 0% Y5 2000/01; 2000/12 22.25% / -10.14% 21.36% / -8.15% 1.37 / -0.36 6.86% / 14.5% 164.34% / 0% 163.89% / 0% Y6 2001/01; 2001/12 60.17% / -12.06% 50.29% / -10.35% 2.14 / -0.46 18.9% / 28.72% 129.12% / 0% 128.77% / 0% Y7 2002/01; 2002/12 12.85% / -24.6% 13.78% / -26.26% 0.75 / -1.31 17.38% / 31.72% 173.9% / 0% 173.42% / 0% Y8 2003/01; 2003/12 56.04% / 25.19% 45.89% / 23.71% 3.08 / 1.55 6.56% / 10.64% 186.21% / 0% 185.7% / 0% Y9 2004/01; 2004/12 40.11% / 10.59% 34.42% / 10.46% 2.27 / 0.99 8.64% / 8.03% 152.24% / 0% 154.74% / 0% Y10 2005/01; 2005/12 21.27% / 3% 20.11% / 3.43% 1.65 / 0.35 5.77% / 6.51% 126.08% / 0% 125.74% / 0% Y11 2006/01; 2006/12 17.88% / 13.62% 17.27% / 13.29% 1.4 / 1.35 9.52% / 6.76% 172.54% / 0% 172.06% / 0% Y12 2007/01; 2007/12 3.44% / 4.24% 4.75% / 5.09% 0.29 / 0.37 12.41% / 7.75% 172.12% / 0% 171.65% / 0% Y13 2008/01; 2008/12 -14.86% / -40.97% -6.78% / -46.96% -0.16 / -1.41 45.41% / 43.87% 190.58% / 0% 190.05% / 0% Y14 2009/01; 2010/01 51.1% / 27.76% 45.01% / 27.45% 1.53 / 1.06 21.57% / 26.66% 144.86% / 0% 147.24% / 0% Y15 2010/01; 2010/12 23.56% / 11.64% 22.74% / 12.31% 1.16 / 0.71 17.63% / 15.99% 124.75% / 0% 126.8% / 0% Y16 2011/01; 2011/12 11.35% / 0% 12.95% / 2.3% 0.62 / 0.11 17.46% / 17.61% 130.83% / 0% 130.47% / 0% Y17 2012/01; 2012/12 2.08% / 11.52% 2.94% / 11.63% 0.22 / 0.98 14.43% / 9.26% 126.98% / 0% 126.63% / 0% Y18 2013/01; 2013/12 34% / 31.3% 30.04% / 27.87% 2.68 / 2.78 5.71% / 4.5% 136.67% / 0% 136.3% / 0% All 1996/08; 2013/12 3138.79% / 177.95% 21.94% / 7.59% 1.11 / 0.41 45.41% / 56.24% 154.08% / 0% 2686.05% / 0% First 1996/08; 2006/12 1178.17% / 114.09% 25.76% / 8.73% 1.62 / 0.52 27.79% / 47.59% 159.01% / 0% 1658.9% / 0% Second 2007/01; 2013/12 153.39% / 29.83% 16.26% / 5.91% 0.67 / 0.28 45.41% / 56.24% 146.73% / 0% 1027.14% / 0%
  • 16.
    Short Portfolio vs.Short S&P 500 Index
  • 17.
    Statistics: Short Strategy/ Short SPX Index Ann. Return: 8.6% Sharpe: 0.59 range TR CAGR Sharpe MDD A.Trnv T.trnv Y1 1996/08; 1996/12 1.22% / -10.94% 2.94% / -27.23% 0.76 / -2.74 2.01% / 14.47% 48.11% / 0% 20.3% / 0% Y2 1997/01; 1997/12 8.31% / -15.96% 8.89% / -16.66% 0.67 / -1.37 13.24% / 21.71% 121.43% / 0% 121.1% / 0% Y3 1998/01; 1999/01 12.13% / 10.9% 11.53% / 10.73% 1.58 / 1.23 0.84% / 3.24% 45.45% / 0% 46.2% / 0% Y4 1999/01; 1999/12 24.66% / 2.04% 22.23% / 2.34% 2.19 / 0.3 2.62% / 9.95% 72.96% / 0% 74.15% / 0% Y5 2000/01; 2000/12 23.98% / 11.53% 23.87% / 11.56% 1.1 / 1.08 9.93% / 5.29% 119.6% / 0% 119.27% / 0% Y6 2001/01; 2001/12 11.93% / 10.94% 14.3% / 12.27% 0.58 / 0.63 24.59% / 16.62% 154.65% / 0% 154.23% / 0% Y7 2002/01; 2002/12 47.58% / 18.58% 40.75% / 18.99% 2.25 / 0.97 8.1% / 14.44% 80.16% / 0% 79.94% / 0% Y8 2003/01; 2003/12 -6.89% / -0.57% -6.91% / -0.43% -1 / -0.08 8.31% / 3.56% 121.23% / 0% 120.9% / 0% Y9 2004/01; 2004/12 -2.36% / -8.26% -0.83% / -8.2% -0.05 / -0.9 20.1% / 12.74% 155.84% / 0% 158.4% / 0% Y10 2005/01; 2005/12 0.73% / -4.57% 1.17% / -4.33% 0.12 / -0.49 11.67% / 11.83% 110.9% / 0% 110.6% / 0% Y11 2006/01; 2006/12 -4.34% / -4.21% -4.12% / -4.27% -0.5 / -1.08 6.45% / 4.61% 53.21% / 0% 53.07% / 0% Y12 2007/01; 2007/12 -8.62% / -4.01% -8.25% / -3.29% -0.65 / -0.25 15.28% / 14.69% 120.93% / 0% 120.6% / 0% Y13 2008/01; 2008/12 42.27% / 35.74% 38.87% / 38.95% 1.47 / 0.95 14.09% / 19.87% 80.72% / 0% 80.5% / 0% Y14 2009/01; 2010/01 -2.2% / -0.91% -2.17% / -0.82% -1.4 / -0.18 0.94% / 0.78% 2.75% / 0% 2.8% / 0% Y15 2010/01; 2010/12 -5.91% / -13.02% -4.02% / -12.63% -0.2 / -0.75 10.82% / 19.8% 75.27% / 0% 76.51% / 0% Y16 2011/01; 2011/12 16.05% / -4.7% 15.5% / -4.03% 1.46 / -0.31 4.26% / 8.91% 68.79% / 0% 68.6% / 0% Y17 2012/01; 2012/12 -2.44% / -6.42% -2.16% / -6.31% -0.27 / -0.77 3.76% / 10.21% 36.5% / 0% 36.4% / 0% Y18 2013/01; 2013/12 0% / 0% 0% / 0% NaN / NaN 0% / 0% 0% / 0% 0% / 0% All 1996/08; 2013/12 272.38% / 3.75% 8.6% / 1.3% 0.59 / 0.09 32.46% / 41.29% 82.81% / 0% 1443.56% / 0% First 1996/08; 2006/12 174.93% / 3.6% 10.78% / 1.01% 0.73 / 0.09 27.53% / 31.26% 101.43% / 0% 1058.16% / 0% Second 2007/01; 2013/12 35.45% / 0.15% 5.36% / 1.72% 0.37 / 0.09 18.63% / 41.29% 55.06% / 0% 385.41% / 0%