This survey asked teachers about their use of digital resources for grading assignments. It found that most teachers use Fronter (94%) and check for plagiarism using Ephorus in Fronter (41%) or by searching for text fragments online (53%). When students submit assignments digitally, most hand them in through Fronter (76%). To detect plagiarism, teachers rely on knowing students well from meeting them frequently and discussing topics in class.
The document appears to contain the results of a survey about careers, skills, and learning preferences among 117 respondents. Some key findings include:
- Most respondents have been writing code for less than 5 years.
- Over 60% study or work in computer science or IT fields.
- The most popular career preferences are programmer/software engineer and system administrator.
- Respondents feel moderately to very positive about succeeding in their preferred careers.
- Internships, real-world projects, and making their own projects are seen as important skills.
- Online resources, peers, and videos contribute significantly to learning.
- Exposure and opportunities are seen as helping achieve necessary career skills.
Findings from 2011 CASE/mStoner/Slover Linett Survey of Social Media & Advanc...Michael Stoner
These slides are from a presentation that Cheryl Slover-Linett and I did at the CASE Social Media & Community Conference. It's a report on key findings from the 2011 CASE/mStoner/Slover Linett Survey of Social Media & Advancement, along with some implications and recommendations.
The 2011 Edelman Trust Barometer found that globally, trust increased in all institutions. Emerging markets like China and Brazil saw the largest increases in trust in business and government. The US dropped significantly in trust in all institutions and now has similar trust levels as Russia. Technology was the most trusted industry globally while banks had the lowest trust levels. Quality, transparency, honesty, employee welfare and frequent communication were seen as most important for corporate reputation. People now rely more on search engines, online news, and hearing information multiple times from credentialed sources to determine what they believe about companies. Maintaining trust is important for protecting corporate reputation.
The 2011 Edelman Trust Barometer found that globally, trust increased in all institutions. Emerging markets like China and Brazil saw the largest increases in trust in business and government. The U.S. saw declines in trust across all institutions, similar to declines seen during the 2008-2009 financial crisis. Trust in NGOs is now on par with trust in business in emerging markets. Quality, transparency, employee welfare, and being a trustworthy company are the most important factors for corporate reputation. While CEOs increased in credibility as spokespeople, a "person like me" declined. Online search engines and news are now the primary sources for company information. Repetition increases believability, and an already trusted company needs less
The Mom Study 2013 surveyed over 900 mothers in the US from January to March 2013 about their planning and purchasing habits. It found that most moms shop for groceries multiple times per week, menu plan weekly, and use lists to stay organized. While some moms care about natural and organic products, most are split or say it is not a top priority, instead basing shopping decisions more on price factors like coupons and weekly specials. Moms shop at multiple grocery store chains each week rather than sticking to just one.
2012 Social Election Survey Report Presentation SlidesORI
The 2012 Social Election Survey explored how social media influenced perceptions and voter behavior in the 2012 U.S. presidential election. The objectives were to understand how the public used social media to learn about and engage in election discussions, the perceived credibility of social media versus other information sources, and how effectively candidates used social media. The survey collected demographics on 806 respondents and examined their interest in the election, top issues determining their vote, political engagement activities, sources of information, social media use, and sharing of political views on social media.
This document summarizes the findings of a survey exploring the role of social media in influencing perceptions and voter behavior in the 2012 US presidential election. Some key findings include:
- The economy was the top issue determining votes, followed by health care and the federal deficit.
- Four in ten used social media to keep up with political news, debate issues, and find others with similar views.
- While three in ten said social media moderately or extremely influenced their views of candidates, nearly half of 18-25 year olds reported influence.
- Sample tweets from November 2012 are presented to illustrate levels of reach and partisan leanings on social media around that time.
The survey collected responses from 1578 marketing and advertising professionals. Most respondents worked at full-service agencies in the US or other countries. Salaries varied significantly depending on role, experience, agency size, and location. Senior roles at large agencies in major cities like New York and San Francisco tended to earn the highest salaries. The survey provides a useful benchmark for compensation across the planning field.
The survey summarizes salaries and career histories of 1578 marketing and advertising professionals. On average, Assistant Planners earn $58,250 annually with 1.5 years of planning experience. Planners earn $77,830 on average with 4.7 years of experience. Senior Planners earn $135,583 with 6.3 years of experience. The largest represented cities are New York, Los Angeles, San Francisco, and Boston.
This survey collected responses from 176 people in Poland, Romania and Portugal about their internet usage. The majority were female (62%) and between ages 15-17 (83%). Most respondents had daily access to the internet (89%), usually at home (88%), and access at school (95%). Facebook was the most commonly used social network (78%). Respondents used the internet for movies/music (80%), socializing (63%), and schoolwork (62%). About half felt safe online (52%) while a quarter considered themselves addicted to the internet (25%).
This document summarizes findings from a 2012 survey on social media and technology usage. Key findings include:
- Over 90% of respondents are active on Facebook, nearly half on YouTube, and over a third on Twitter and Google+. Smartphone ownership is 60% overall.
- Younger respondents and women rely heavily on their mobile phones, especially for texting. Over a third of all respondents use their phone daily for email, calendars, and social media.
- Respondents are increasingly dependent on mobile devices and expect to use them for various tasks like banking, food ordering, and appointments. Post-purchase behaviors like reviews are also facilitated by mobile and social media.
The document provides information about an annual planning survey conducted by the author over several years. It includes details such as the growing number of participants, the author's career progression working for different agencies, and demographic information about the participants such as their job roles, experience levels, locations, and salaries. The survey aims to help planners understand compensation norms and negotiate salaries.
7th annual Planning Survey Report
Emotions about our jobs Career path
Students, Interns and Junior Planners
A note on salaries
Salary Results – US
Salary Results – Brazil
Salary Results – UK
Freelance
Open-ended responses Closing thoughts
The document summarizes the key findings of the 7th annual Planning Survey. It shows that over 2,100 people completed the survey in 2011, a significant increase from previous years. The majority of respondents work in full-service agencies and digital agencies. New categories were added for job titles like Global Head of Planning and Regional Planning Director. Most respondents are between 24-34 years old and work in medium or large sized companies. The document also provides breakdowns of respondents by gender, ethnicity, salary ranges and other demographics. It aims to be a definitive resource on the planner and strategist community globally.
John Massman discusses using data visualization and "emphatic graphs" to effectively present data analyses and their implications to stakeholders. He provides examples of how combining key information and foreseeable consequences into concise graphs helped a nonprofit improve operations and an adult-child mentoring program increase matching effectiveness and quantify benefits. Massman advocates analyzing voluminous demographic data to identify characteristics that correlate with long-term relationships and avoiding ineffective short matches.
The document summarizes research on the online and digital expectations of college-bound high school juniors and seniors, finding that most use social media like Facebook and conduct online research of colleges, with seniors being more engaged in the enrollment process than juniors. While the majority prefer finding academic and cost information on college websites, many schools are not meeting student expectations for content optimization and engagement across digital channels.
High Ed Web Ark - E-Expectations #hewebarJeremy Rex
1) The document summarizes key findings from a study on the e-expectations of high school juniors and seniors regarding college websites, social media, and communications.
2) It finds that while email is still important, mobile access is increasingly common, with over two-thirds of students having regular access to mobile devices.
3) The most influential factors for students are campus tours, college websites, and conversations with students/admissions staff, while print materials and search engines also help students build lists of potential schools.
John Massman presented on using data visualization to effectively communicate insights from data analyses. He discussed two case studies where emphatic graphs combining key information and consequences were used to have pointed discussions that led to positive outcomes. In one case, an analysis of 1700 adult-child matches identified characteristics that correlated with long-term relationships, directly resulting in a programmatic change. In another case, quantifying the benefits of long-term mentoring relationships allowed an organization to report tangible benefits to stakeholders. Massman advocated for data presentations that create "wow factors" to engage audiences.
The document contains several charts from Raddon Financial Group summarizing data from their National Online Consumer Research from Fall 2012 on consumers' use of mobile banking. The top three findings are:
1) The top five banks and credit unions have the highest rates of mobile penetration, with over 60% of their online customers having a smartphone or tablet and over 50% doing mobile banking.
2) 20% of online customers reported doing some online banking with their smartphone, while only 9% have downloaded a mobile banking app.
3) Over half of online consumers are "mobile ready" with a smartphone or tablet, and 22% own a tablet.
Wisdom of crowds business intelligence market study findings overviewYellowfin
The latest edition – based on 859 responses from professionals with first-hand experience using vendor products and services – analyzes market place trends throughout 2011 and assess user perceptions towards BI for the coming year. The study also compares and ranks 17 of the world’s foremost BI vendors, their solution and associated services. Yellowfin achieved the equal highest overall ranking (4.57 out of five), as well as best outright score in the study’s “Emerging Business Intelligence Vendors” sub-group.
Yellowfin outscored traditional big name players, including Microsoft, IBM, SAP Business Objects, MicroStrategy, SAS Institute and Oracle. Yellowfin also outperformed other high profile vendors, including Information Builders, Actuate, Qliktech, Tibco Spotfire, Dimensional Insight, Arcplan, Pentaho and Jaspersoft.
Vendors are ranked on a five-point scale, across 33 different criteria, based on seven categories, including: Sales experience, value, quality and usefulness of product, quality of technical support, quality and value of consulting services, integrity and whether existing clients would recommend the vendor and its product to others.
This document summarizes education data from Central Texas in 2012. It shows that disciplinary actions for students doubled from 5th to 6th grade. There were also large achievement gaps between racial/ethnic groups and income levels on standardized tests in 8th grade math and reading. The gaps persisted from 3rd grade through 8th grade. Only reading scores met the objective of 80% passage rates across all demographic groups.
The survey asked US consumers questions about their purchasing habits, phone usage, and demographics. Key findings:
- When considering purchases, most research on their phone or computer rather than asking friends.
- Many are criticized by friends for phone use but most say friends also use phones.
- Younger consumers are less ashamed of older/less cool phones than older groups.
- The first thing noticed about people is most often their phone rather than clothes, watch, or car.
- Most respondents were female, ages 18-35.
The Communications Industry Survey of Washington DC and Baltimore 2013 ReportWBandAMktRes
Through the promotion of our supporters, communications professionals in the Washington, DC and Baltimore regions were presented with a link to participate in a brief web survey aimed at understanding their perspectives on the current economy and job market, as well as their optimism for the future.
This annual study was first fielded in January and February of 2012, the results of which have been used as a baseline for the 2013 study, which was fielded in January of 2013.
The document discusses mobile apps and their impact on human lifestyle based on a survey. It begins with an introduction to mobile apps and their popularity. A survey was then conducted with 65 respondents on their mobile app usage habits and perceptions. The results showed most respondents use apps daily and they impact life significantly. Respondents reported apps help social networks but may reduce study/family time. Most prefer informative, communication and entertainment apps. The conclusion is apps have room for improvements like faster speed and more free options.
2012 mobile forecast doe higher educationIvonne Kinser
-Survey results from over 500 university administrators on their plans for mobile strategy
-How colleges are ranking the importance of mobile across the student lifecycle
-How mobile fits into colleges' long and short development plans
According to a survey by Raddon Financial Group:
1) Younger generations such as Gen Y are more likely to purchase a tablet in the next year compared to older generations.
2) Over half of online consumers have a smartphone or tablet.
3) Approximately one-quarter of respondents own a tablet, either alone or with a cell phone.
The DigitClass project is investigating the use of digital tools in European classrooms. This survey aims to gather data from teachers across Europe on their use of digital tools, perceptions of tools' impact on learning, support received, and future integration plans. The 17-question survey addresses topics like teaching methodology, digital skills proficiency, views on tools' benefits, technical support, integration frequency, and future outlook. Thank you for your contribution to this research.
More Related Content
Similar to Survey assessment and_plagiarism_digitally uk ws
The survey collected responses from 1578 marketing and advertising professionals. Most respondents worked at full-service agencies in the US or other countries. Salaries varied significantly depending on role, experience, agency size, and location. Senior roles at large agencies in major cities like New York and San Francisco tended to earn the highest salaries. The survey provides a useful benchmark for compensation across the planning field.
The survey summarizes salaries and career histories of 1578 marketing and advertising professionals. On average, Assistant Planners earn $58,250 annually with 1.5 years of planning experience. Planners earn $77,830 on average with 4.7 years of experience. Senior Planners earn $135,583 with 6.3 years of experience. The largest represented cities are New York, Los Angeles, San Francisco, and Boston.
This survey collected responses from 176 people in Poland, Romania and Portugal about their internet usage. The majority were female (62%) and between ages 15-17 (83%). Most respondents had daily access to the internet (89%), usually at home (88%), and access at school (95%). Facebook was the most commonly used social network (78%). Respondents used the internet for movies/music (80%), socializing (63%), and schoolwork (62%). About half felt safe online (52%) while a quarter considered themselves addicted to the internet (25%).
This document summarizes findings from a 2012 survey on social media and technology usage. Key findings include:
- Over 90% of respondents are active on Facebook, nearly half on YouTube, and over a third on Twitter and Google+. Smartphone ownership is 60% overall.
- Younger respondents and women rely heavily on their mobile phones, especially for texting. Over a third of all respondents use their phone daily for email, calendars, and social media.
- Respondents are increasingly dependent on mobile devices and expect to use them for various tasks like banking, food ordering, and appointments. Post-purchase behaviors like reviews are also facilitated by mobile and social media.
The document provides information about an annual planning survey conducted by the author over several years. It includes details such as the growing number of participants, the author's career progression working for different agencies, and demographic information about the participants such as their job roles, experience levels, locations, and salaries. The survey aims to help planners understand compensation norms and negotiate salaries.
7th annual Planning Survey Report
Emotions about our jobs Career path
Students, Interns and Junior Planners
A note on salaries
Salary Results – US
Salary Results – Brazil
Salary Results – UK
Freelance
Open-ended responses Closing thoughts
The document summarizes the key findings of the 7th annual Planning Survey. It shows that over 2,100 people completed the survey in 2011, a significant increase from previous years. The majority of respondents work in full-service agencies and digital agencies. New categories were added for job titles like Global Head of Planning and Regional Planning Director. Most respondents are between 24-34 years old and work in medium or large sized companies. The document also provides breakdowns of respondents by gender, ethnicity, salary ranges and other demographics. It aims to be a definitive resource on the planner and strategist community globally.
John Massman discusses using data visualization and "emphatic graphs" to effectively present data analyses and their implications to stakeholders. He provides examples of how combining key information and foreseeable consequences into concise graphs helped a nonprofit improve operations and an adult-child mentoring program increase matching effectiveness and quantify benefits. Massman advocates analyzing voluminous demographic data to identify characteristics that correlate with long-term relationships and avoiding ineffective short matches.
The document summarizes research on the online and digital expectations of college-bound high school juniors and seniors, finding that most use social media like Facebook and conduct online research of colleges, with seniors being more engaged in the enrollment process than juniors. While the majority prefer finding academic and cost information on college websites, many schools are not meeting student expectations for content optimization and engagement across digital channels.
High Ed Web Ark - E-Expectations #hewebarJeremy Rex
1) The document summarizes key findings from a study on the e-expectations of high school juniors and seniors regarding college websites, social media, and communications.
2) It finds that while email is still important, mobile access is increasingly common, with over two-thirds of students having regular access to mobile devices.
3) The most influential factors for students are campus tours, college websites, and conversations with students/admissions staff, while print materials and search engines also help students build lists of potential schools.
John Massman presented on using data visualization to effectively communicate insights from data analyses. He discussed two case studies where emphatic graphs combining key information and consequences were used to have pointed discussions that led to positive outcomes. In one case, an analysis of 1700 adult-child matches identified characteristics that correlated with long-term relationships, directly resulting in a programmatic change. In another case, quantifying the benefits of long-term mentoring relationships allowed an organization to report tangible benefits to stakeholders. Massman advocated for data presentations that create "wow factors" to engage audiences.
The document contains several charts from Raddon Financial Group summarizing data from their National Online Consumer Research from Fall 2012 on consumers' use of mobile banking. The top three findings are:
1) The top five banks and credit unions have the highest rates of mobile penetration, with over 60% of their online customers having a smartphone or tablet and over 50% doing mobile banking.
2) 20% of online customers reported doing some online banking with their smartphone, while only 9% have downloaded a mobile banking app.
3) Over half of online consumers are "mobile ready" with a smartphone or tablet, and 22% own a tablet.
Wisdom of crowds business intelligence market study findings overviewYellowfin
The latest edition – based on 859 responses from professionals with first-hand experience using vendor products and services – analyzes market place trends throughout 2011 and assess user perceptions towards BI for the coming year. The study also compares and ranks 17 of the world’s foremost BI vendors, their solution and associated services. Yellowfin achieved the equal highest overall ranking (4.57 out of five), as well as best outright score in the study’s “Emerging Business Intelligence Vendors” sub-group.
Yellowfin outscored traditional big name players, including Microsoft, IBM, SAP Business Objects, MicroStrategy, SAS Institute and Oracle. Yellowfin also outperformed other high profile vendors, including Information Builders, Actuate, Qliktech, Tibco Spotfire, Dimensional Insight, Arcplan, Pentaho and Jaspersoft.
Vendors are ranked on a five-point scale, across 33 different criteria, based on seven categories, including: Sales experience, value, quality and usefulness of product, quality of technical support, quality and value of consulting services, integrity and whether existing clients would recommend the vendor and its product to others.
This document summarizes education data from Central Texas in 2012. It shows that disciplinary actions for students doubled from 5th to 6th grade. There were also large achievement gaps between racial/ethnic groups and income levels on standardized tests in 8th grade math and reading. The gaps persisted from 3rd grade through 8th grade. Only reading scores met the objective of 80% passage rates across all demographic groups.
The survey asked US consumers questions about their purchasing habits, phone usage, and demographics. Key findings:
- When considering purchases, most research on their phone or computer rather than asking friends.
- Many are criticized by friends for phone use but most say friends also use phones.
- Younger consumers are less ashamed of older/less cool phones than older groups.
- The first thing noticed about people is most often their phone rather than clothes, watch, or car.
- Most respondents were female, ages 18-35.
The Communications Industry Survey of Washington DC and Baltimore 2013 ReportWBandAMktRes
Through the promotion of our supporters, communications professionals in the Washington, DC and Baltimore regions were presented with a link to participate in a brief web survey aimed at understanding their perspectives on the current economy and job market, as well as their optimism for the future.
This annual study was first fielded in January and February of 2012, the results of which have been used as a baseline for the 2013 study, which was fielded in January of 2013.
The document discusses mobile apps and their impact on human lifestyle based on a survey. It begins with an introduction to mobile apps and their popularity. A survey was then conducted with 65 respondents on their mobile app usage habits and perceptions. The results showed most respondents use apps daily and they impact life significantly. Respondents reported apps help social networks but may reduce study/family time. Most prefer informative, communication and entertainment apps. The conclusion is apps have room for improvements like faster speed and more free options.
2012 mobile forecast doe higher educationIvonne Kinser
-Survey results from over 500 university administrators on their plans for mobile strategy
-How colleges are ranking the importance of mobile across the student lifecycle
-How mobile fits into colleges' long and short development plans
According to a survey by Raddon Financial Group:
1) Younger generations such as Gen Y are more likely to purchase a tablet in the next year compared to older generations.
2) Over half of online consumers have a smartphone or tablet.
3) Approximately one-quarter of respondents own a tablet, either alone or with a cell phone.
Similar to Survey assessment and_plagiarism_digitally uk ws (20)
The DigitClass project is investigating the use of digital tools in European classrooms. This survey aims to gather data from teachers across Europe on their use of digital tools, perceptions of tools' impact on learning, support received, and future integration plans. The 17-question survey addresses topics like teaching methodology, digital skills proficiency, views on tools' benefits, technical support, integration frequency, and future outlook. Thank you for your contribution to this research.
The survey found that most teachers have a positive view of integrating digital tools in the classroom and believe it benefits students. Younger teachers tend to integrate digital tools more than older teachers. While many teachers feel confident in using digital tools themselves, some reported not receiving adequate training. Support from the school, such as professional development opportunities and technology support staff, influences how much teachers incorporate digital tools into their teaching.
The municipality of Kungälv is located in southwest Sweden along the coast. It has around 38,000 inhabitants and is known for its historic fortresses and churches from the medieval era. Nature is also prominent in Kungälv with forests and lakes. The adult education program in Kungälv offers a wide variety of theoretical and vocational courses to around 1,000 students each year. Classes are aimed at helping young adults and immigrants obtain skills for higher education or new careers. Courses include basic education, upper secondary education, Swedish for immigrants, and vocational programs in tourism, engineering, and healthcare.
This document outlines the structure and responsibilities for a website about a project on digital tools for education. It discusses categories for tools, case studies and videos to include on the site. Surveys will be used to gather information and results will be posted. Participants will provide a glossary of selected tools and suggestions for using tools in class by November 30th. Project coordinators will upload presentations and workshop information to designated areas of the site by set deadlines.
The 6th Workshop Grundvig Digital Classroom was a 4 day workshop from June 4-7, 2013 in Karamürsel, Turkey. The workshop focused on implementing digital tools in schools and included sessions on the project status, digital tools like smartboards, developing a website and glossary, evaluating survey results, and trips to a paper factory and Istanbul on other days.
Speakapps offers three tools - Langblog, Videochat, and Tandem - for improving oral communication skills as part of a European multilateral project. Langblog allows users to record and upload audio and video contributions by tying them to blog posts called activities. Videochat enables real-time video conversations. Tandem pairs users to practice conversational skills together through audio or video chat.
This document provides information about accommodations and programming at the Nordiska folkhögskolan from September 18-21, 2012 in Kungälv, Sweden. It details room prices and includes breakfast, and mentions transportation is available via bus from Göteborg. It provides contact information for booking and recommends places to stay in Göteborg if extending the trip over the weekend.
The document outlines a weekly schedule for a project taking place from Tuesday, February 12th to Friday, February 15th. On Tuesday, the current project status and additional work are discussed. Wednesday includes a presentation on survey results and a discussion on digital tools. Thursday features an introduction to the new digital campus and an excursion on Friday wraps up the week's activities with a social program before participants travel.
Dabbleboard is a digital whiteboard that allows for flowcharts, mind maps, organization charts, and freehand drawing. It is easy to use, fast, flexible, produces good-looking drawings, allows reusing drawings through a drag-and-drop library, enables sharing and real-time collaboration, and has a free version.
This document provides information and tasks related to the Digital Classroom project website. It includes:
1. Details on the content to include on the website such as tool definitions, recommendations, and a glossary.
2. Assignments for uploading content, photos, and presentations from each workshop by certain deadlines.
3. Instructions for using shared Google account credentials to upload materials and a reminder that each coordinator is responsible for their own institution's content.
4. An update that the survey for the project has started and details on collecting more responses by a deadline.
- The document proposes a survey to understand factors that affect teachers' integration of digital tools in classrooms. It discusses developing questions based on existing models and validated questionnaires, and using a combination of the Teacher Technology Questionnaire and Technology Implementation Questionnaire as a basis.
- It presents a proposal for a 5-section survey addressing teacher background, views on digital tools, ability level, support, and frequency of integration. Items would be adapted from existing questionnaires and the term "digital tools" defined upfront.
- Open discussion points include defining "digital tools," whether to compare same/different schools, using online or paper surveys, translations, and timetable.
The document summarizes information about the Center for Applied Research in Further Education (ZAW F) and its connection to the Graduate School of Business and Economics (WHL) in Lahr, Germany. ZAW F was established in 2004 as a non-profit research center that facilitates exchange between academics and practitioners in education. It is part of WHL, a distance education university, and focuses on research projects related to vocational education, elearning, and competence assessment. Currently ZAW F has around 580 students and 590 graduates and is part of a private network of higher education institutions with around 9,000 total students.
The document summarizes the status and next steps of the Grundtvig Project DIGITCLASS survey. It discusses that the questionnaire has been translated by all partners, Germany has set up the online survey, and Sweden has started collecting responses. It also notes additional testing and validation is needed, a target of 50 responses should be set with a deadline in October, and Germany will analyze the results for presentation and discussion at the next workshop on publishing findings.
This document contains an itinerary for a workshop taking place from September 18-21, 2012 in Kungälv, Sweden. The workshop will focus on populating a website and reviewing a survey on digital tools. Participants will tour local education centers, learn about distance learning programs, and have presentations from Germany and Spain on digital tools. The itinerary provides details on activities each day, including meals, transportation, and contact information.
WS1 - Presentation of Molde Adult Education CentreDigit Class
The Molde Adult Education Centre (MVO) provides various education and training programs to adults in the Molde region, including:
- Primary and lower secondary education for immigrants and refugees
- Norwegian language and civics courses for adult immigrants
- Education and training for adults with special needs
- Courses, seminars, and counseling services
The document outlines MVO's use of digital tools like Smart Boards, notebooks, learning programs, and software to enhance its education programs, particularly for teaching Norwegian as a second language and for students with special needs. Teachers are utilizing these tools to provide interactive, varied, and motivating lessons.
WS3 Molde - Some digital tools used at the Special department in MoldeDigit Class
The document provides instructions for creating animated clay films and digital audio books using various digital tools. It outlines steps for brainstorming characters and storylines, modeling clay figures, taking photos to create animation, and compiling the photos into movies. Additional details are given for creating digital audio books through inserting scanned photos, recorded audio, and found sounds into a PowerPoint presentation.
WS3 Molde - Molde showing - MS Photo story - a quick guide through the whole ...Digit Class
This document provides a quick guide to using the MS Photo Story application. The guide outlines 11 steps to create a photo story including importing and arranging pictures, adding a title, customizing pictures with tools, adding comments and recorded speech, customizing motion effects, adding music, setting save options, and saving the project for later editing or saving as a wmv file for playback on a PC.
WS3 Molde - Molde showing - MS Photo story - a quick guide through the whole ...
Survey assessment and_plagiarism_digitally uk ws
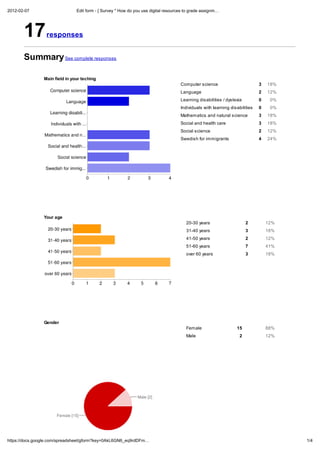
1. 2012-02-07 Edit form - [ Survey " How do you use digital resources to grade assignm
17 responses
Summar See comple e e pon e
Main field in our teching
Comp e cience 3 18%
Lang age 2 12%
Lea ning di abili ie / d le ia 0 0%
Indi id al i h lea ning di abili ie 0 0%
Ma hema ic and na al cience 3 18%
Social and heal h ca e 3 18%
Social cience 2 12%
S edi h fo immig an 4 24%
Your age
20-30 ea 2 12%
31-40 ea 3 18%
41-50 ea 2 12%
51-60 ea 7 41%
o e 60 ea 3 18%
Gender
Female 15 88%
Male 2 12%
https://docs.google.com/spreadsheet/gform?key=0AkL6GN6_eq9rdDFm 1/4
2. 2012-02-07 Edit form - [ Survey " How do you use digital resources to grade assignm
How man ears of teaching?
1-5 ears 2 12%
5-10 ears 5 29%
10-15 ears 1 6%
more than 15 ears 9 53%
Which programs have ou heard of?
Fronter 17 100%
Google Docs 11 65%
Other 15 88%
People ma select more than one
checkbo , so percentages ma add up to
more than 100%.
Which programs do ou use in our teaching/assesement?
Fronter 16 94%
Google Docs 1 6%
Other 5 29%
People ma select more than one
checkbo , so percentages ma add up to
more than 100%.
Have ou heard of Ephorus in Fronter?
Yes 13 76%
No 4 24%
Have ou used Ephorus?
Yes 7 41%
No 10 59%
https://docs.google.com/spreadsheet/gform?key=0AkL6GN6_eq9rdDFm 2/4
3. 2012-02-07 Edit form - [ Survey " How do you use digital resources to grade assignm
Does our students hand in their assignments digitall ?
Ye 12 71%
No 5 29%
If es on the above question, how do the mainl hand in assignments digitall ?
F on e 13 76%
Google Doc 0 0%
Th o gh e-mail 3 18%
On a USB-de ice 0 0%
O he 1 6%
How do ou check/control suspected plagiarism?
Epho in F on e 7 41%
Sea ch man all fo pecial f a e on he In e ne 9 53%
O he 13 76%
People ma elec mo e han one checkbo , o pe cen age
ma add p o mo e han 100%.
Please describe more in detail how ou detect plagiarism.
d e o he limi ed amo n of o d he den kno and he fac ha e mee hem a lea 15 ho pe eek e al ead ha e
a good idea ho ell he i e and ho he all e p e hem el e . he opic a e all e pe onal and he opic he e
hen he ie e all alked abo man ime befo e. hen e ha e na ional e am e al a da on a pape ho he
den a e ea ed in he cla oom o e can go back and check if e ge o e i h imila con en . e en if he cop each
o he he e i no g a an ha he pe on ne o o kno ho o i e ha ell ei he ...
Number of dail responses
https://docs.google.com/spreadsheet/gform?key=0AkL6GN6_eq9rdDFm 3/4
4. 2012-02-07 Edit form - [ Survey " How do you use digital resources to grade assignm
https://docs.google.com/spreadsheet/gform?key=0AkL6GN6_eq9rdDFm 4/4