Download as PDF, PPTX


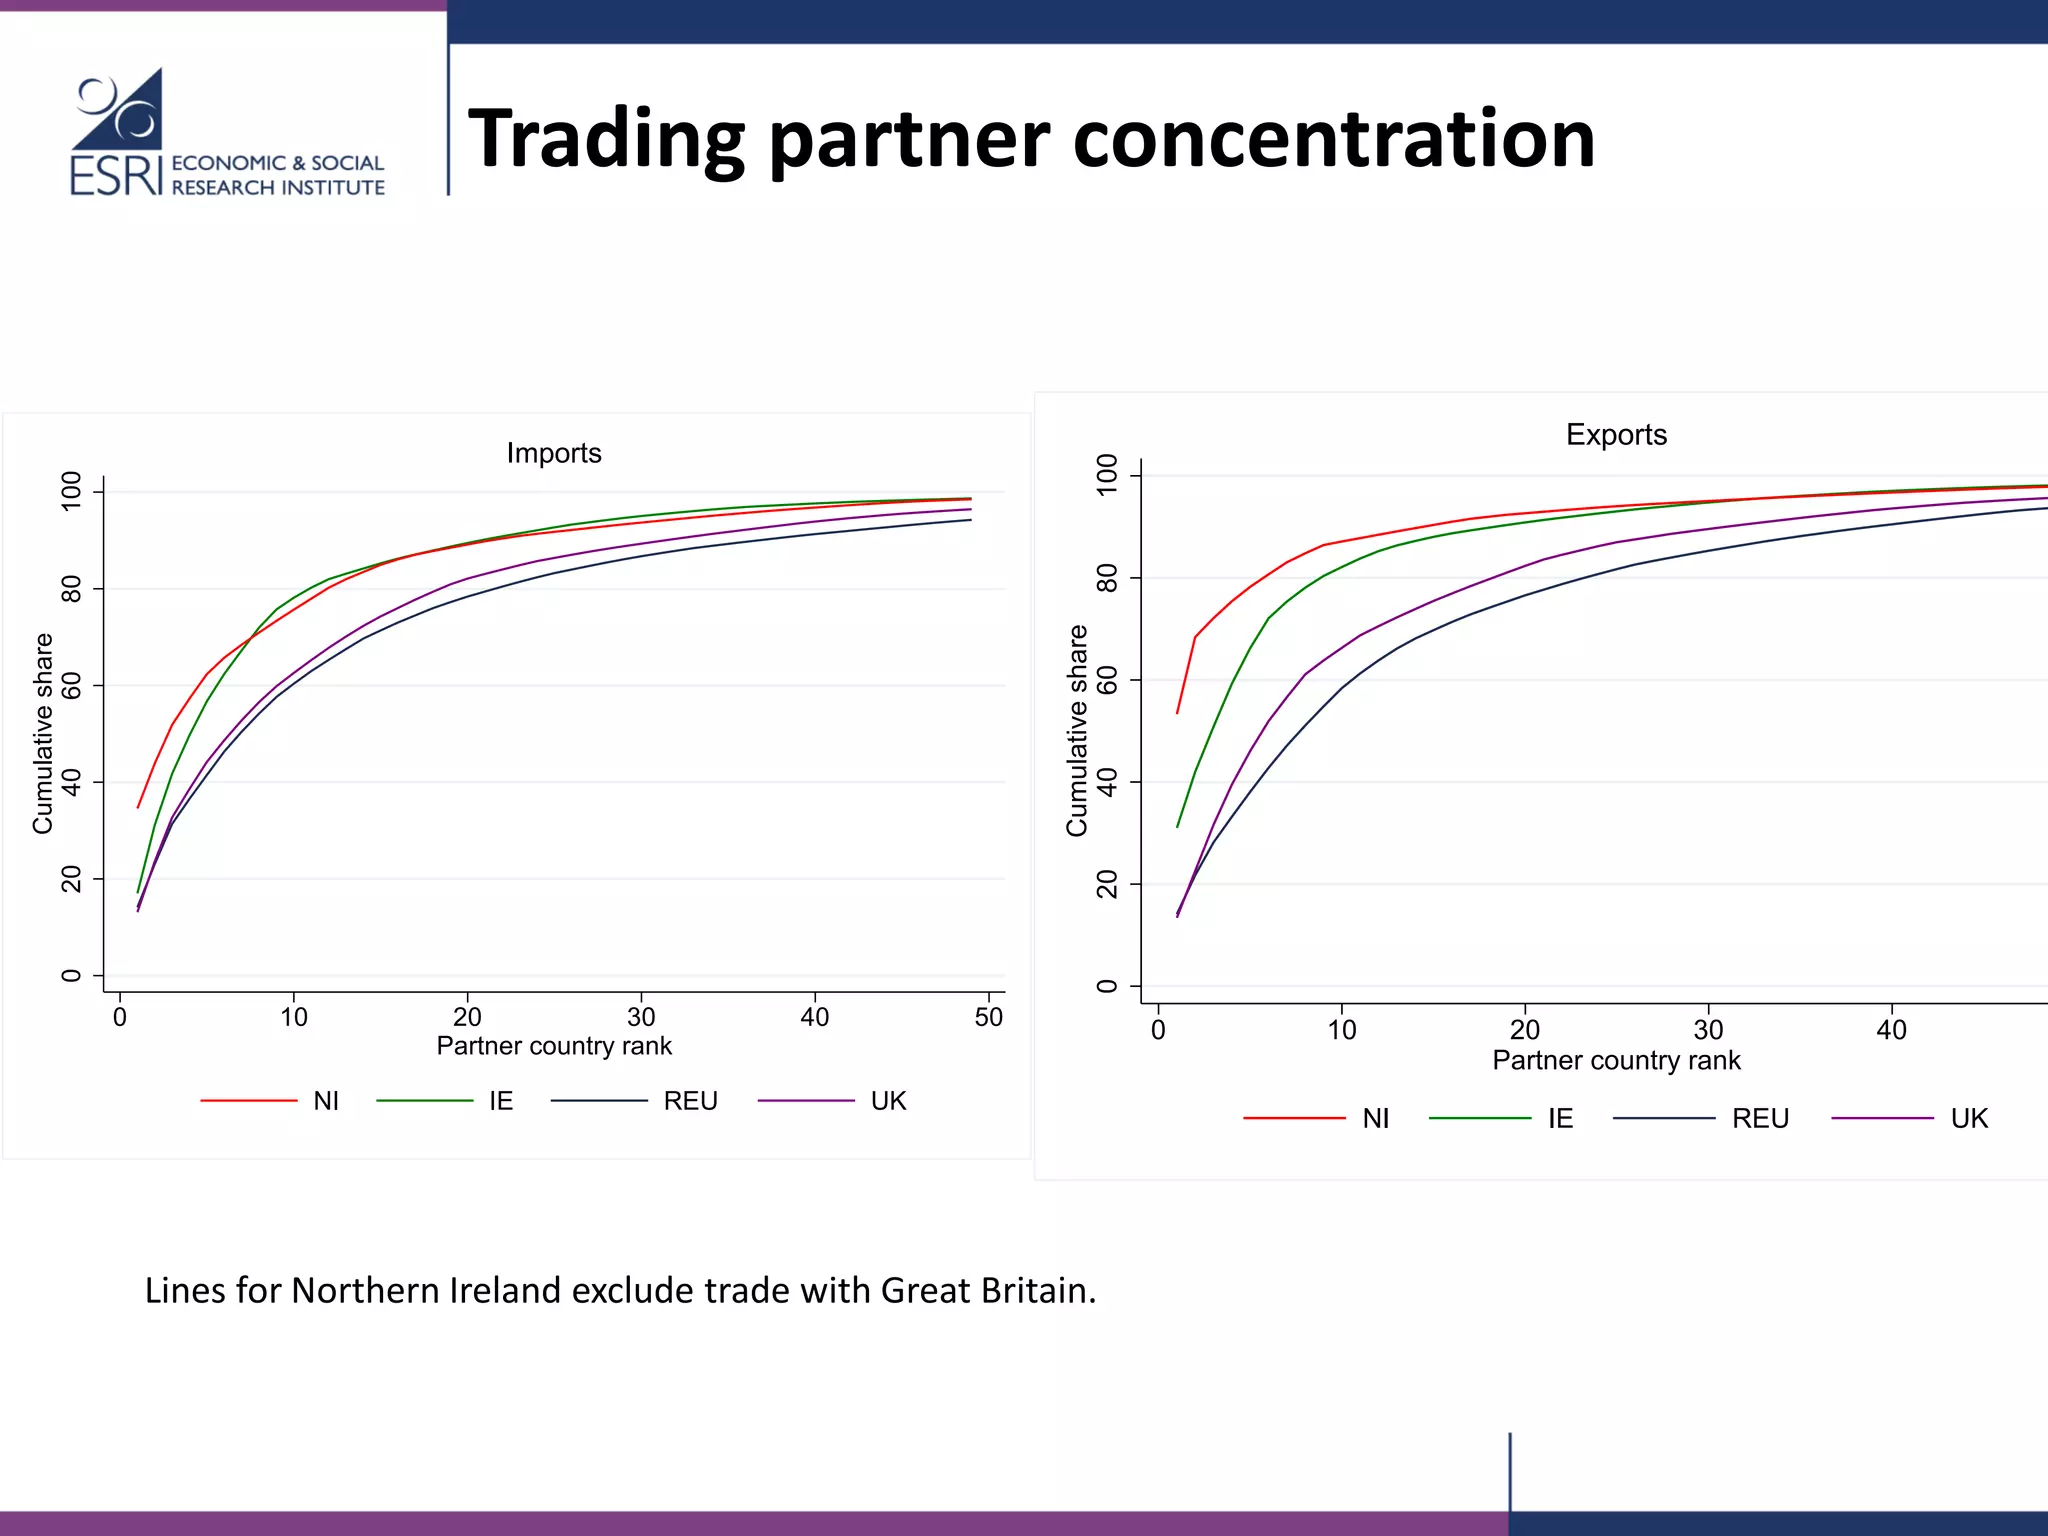


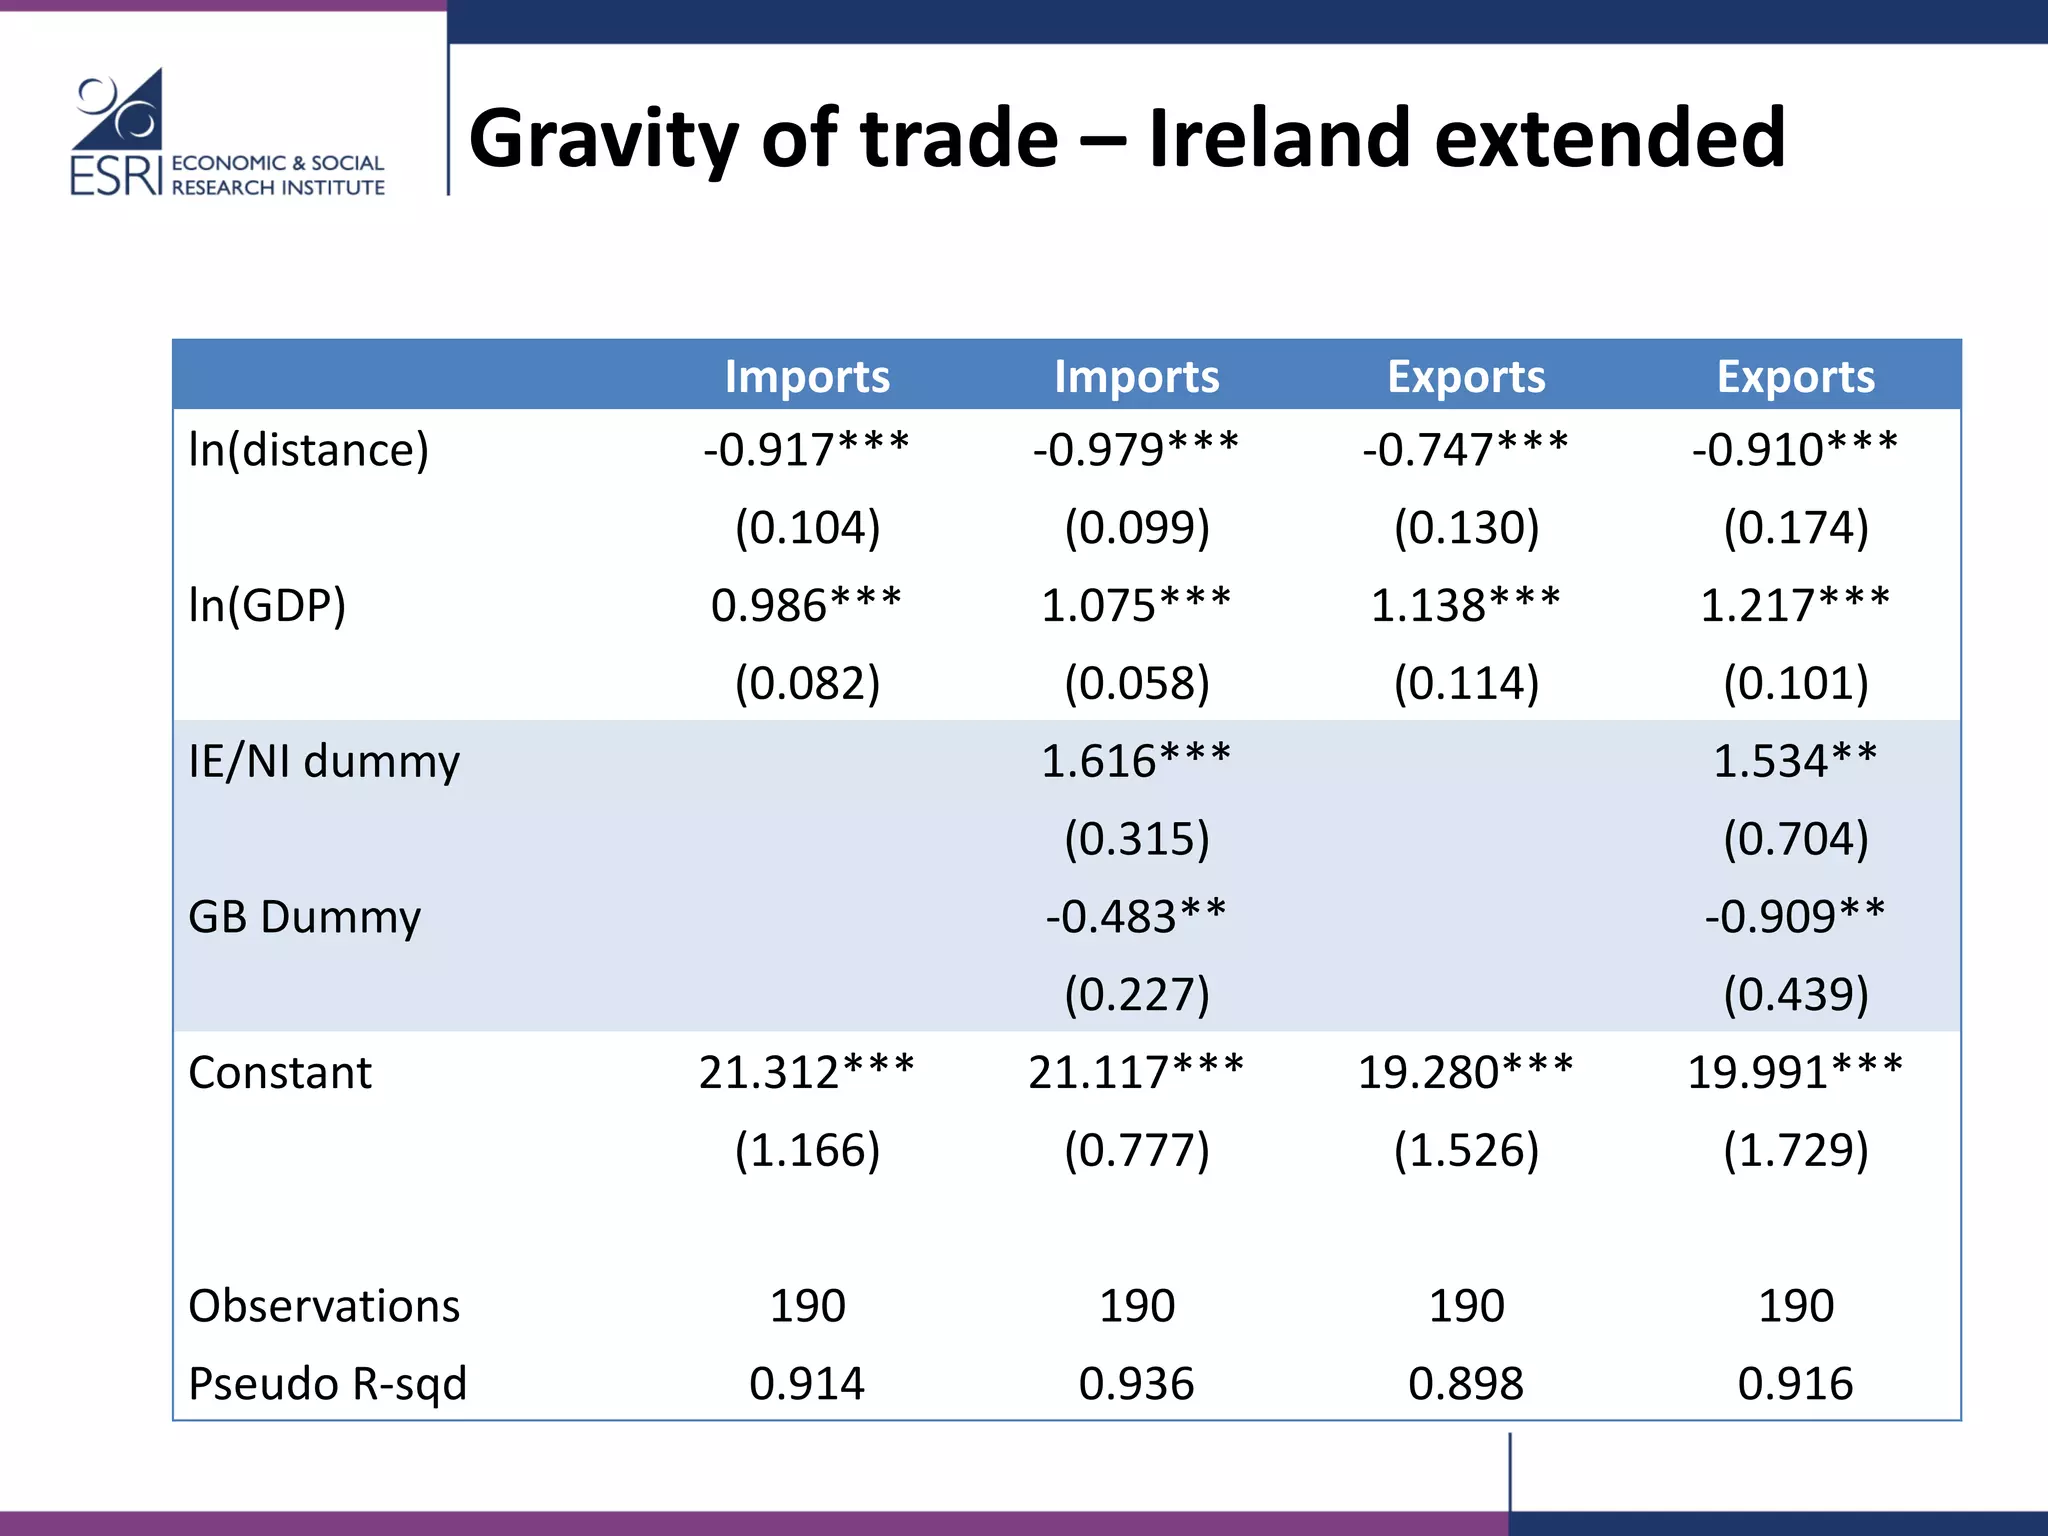


The document analyzes newly available Eurostat data on Northern Ireland's trade patterns, particularly post-Brexit, comparing it with Ireland's trade structures. Findings reveal that Northern Ireland's goods trade is significantly concentrated on cross-border exchanges with Ireland and highlights substantial economic integration between the two regions. Key insights include the predominance of the UK and EU in both regions' trade partners, alongside notable exports in the food and beverages sector.


