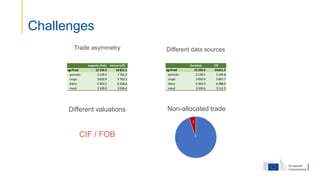
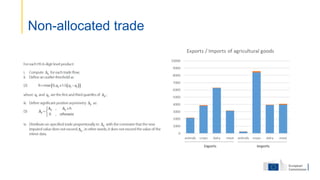
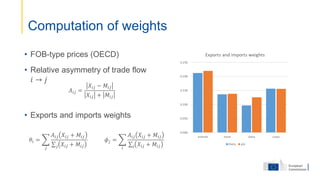
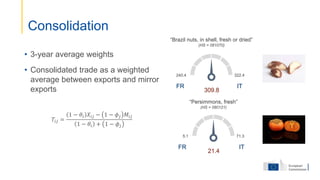
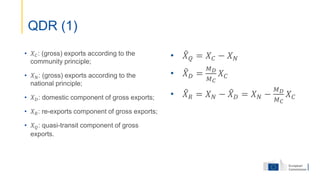
‘Solving’ trade in goods
asymmetries at Eurostat
Pedro MARTINS FERREIRA
Eurostat, Unit C5, International Global Accounts (IGA) team
OECD’ Regional Global Trade in Value Added Webinar
9 June 2021
• What does ‘balancing trade’ really means
• FIGARO’ approach
• Challenges / Improvements
Structure of my talk
Balancing trade
What does it really mean?
• Different measurement?
• Different coverage?
• Are both estimates equally
trustworthy?
• Two sample points of the same
phenomena?
A B
100 150
?
Balancing trade
cif/fob
non-alloc trade
weights
(weighted) average
FIGARO’s approach
Agricultural goods for France
Agricultural products
Crops
Live animals
Meat
Dairy products
Challenges
Trade asymmetry
CIF / FOB
exports (fob) mirror (cif)
agrProd 15 154.5 14 811.5
animals 2 139.5 1 701.0
crops 3 650.9 3 763.5
dairy 6 263.5 6 328.6
meat 3 100.6 3 018.4
Eurostat UN
agrProd 15 154.5 14 811.5
animals 2 139.5 2 149.8
crops 3 650.9 3 667.7
dairy 6 263.5 6 288.9
meat 3 100.6 3 112.3
Different valuations Non-allocated trade
Different data sources
re-exports
Challenges / Opportunity (?)
xEU
FR
EU
13.0 3.2
Other
EU
Other
xEU
Same
xEU
0.1
Other
EU
Same
EU
Other
EU
1.2
re-exports
Non-allocated trade
• FOB-type prices (OECD)
• Relative asymmetry of trade flow
𝑖 → 𝑗
• Exports and imports weights
Computation of weights
𝐴𝑖𝑗 =
𝑋𝑖𝑗 − 𝑀𝑖𝑗
𝑋𝑖𝑗 + 𝑀𝑖𝑗
𝜃𝑖 =
𝑗
𝐴𝑖𝑗 𝑋𝑖𝑗 + 𝑀𝑖𝑗
𝑗 𝑋𝑖𝑗 + 𝑀𝑖𝑗
𝜙𝑗 =
𝑖
𝐴𝑖𝑗 𝑋𝑖𝑗 + 𝑀𝑖𝑗
𝑖 𝑋𝑖𝑗 + 𝑀𝑖𝑗
• 3-year average weights
• Consolidated trade as a weighted
average between exports and mirror
exports
Consolidation
𝑇𝑖𝑗 =
1 − 𝜃𝑖 𝑋𝑖𝑗 − 1 − 𝜙𝑗 𝑀𝑖𝑗
1 − 𝜃𝑖 + 1 − 𝜙𝑗
240.4
“Brazil nuts, in shell, fresh or dried”
(HS = 081070)
322.4
FR IT
309.8
5.1
“Persimmons, fresh”
(HS = 080121)
71.3
FR IT
21.4
QDR & triangular trade
Breaking ‘gross consolidated flows’
• 𝑋𝐶: (gross) exports according to the
community principle;
• 𝑋𝑁: (gross) exports according to the
national principle;
• 𝑋𝐷: domestic component of gross exports;
• 𝑋𝑅: re-exports component of gross exports;
• 𝑋𝑄: quasi-transit component of gross
exports.
• 𝑋𝑄 = 𝑋𝐶 − 𝑋𝑁
• 𝑋𝐷 =
𝑀𝐷
𝑀𝐶
𝑋𝐶
• 𝑋𝑅 = 𝑋𝑁 − 𝑋𝐷 = 𝑋𝑁 −
𝑀𝐷
𝑀𝐶
𝑋𝐶
QDR (1)
Consistency between data sources
𝑀𝐷
𝑀𝐶
𝑋𝐶 ≤ 𝑋𝑁 ≤ 𝑋𝐶
Correcting bias for domestic exports
• domestic share of exports: ‘use table of domestic inputs’ / ‘use table’
• For each HS6 product within one CPA, create a matrix of HS6 products (row),
domestic / non-domestic (columns): RAS to match SUIOT domestic exports
QDR (2)
Quasi-transit and re-export partners
• Partners are taken from the distribution of original imports for which country of
origin is different from country of consignment.
QDR (3)
Triangular trade
A
B C
50
55
100
A
B C
50
5
100
A
B C
50
50
100
5
From orignal data to QDR
Q D R
agrProd 713.9 13 833.3 673.8
animals 71.9 1 918.0 18.1
crops 355.8 2 976.5 393.5
dairy 189.9 6 058.3 148.7
meat 96.2 2 880.6 113.5
exports (fob) non-alloc xfob
agrProd 15 154.5 279.6 15 429.2
animals 2 139.5 43.2 2 182.6
crops 3 650.9 130.3 3 780.0
dairy 6 263.5 56.6 6 317.4
meat 3 100.6 49.5 3 149.2
xfob mfob flow
agrProd 15 429.2 14 377.4 15 221.0
animals 2 182.6 1 666.2 2 008.0
crops 3 780.0 3 614.1 3 725.8
dairy 6 317.4 6 159.0 6 397.0
meat 3 149.2 2 938.1 3 090.2
imports (cif) ciffob mfob
agrProd 14 811.5 434.0 14 377.4
animals 1 701.0 34.8 1 666.2
crops 3 763.5 149.4 3 614.1
dairy 6 328.6 169.6 6 159.0
meat 3 018.4 80.2 2 938.1
ICIO
From orignal data to QDR
Q D R
agrProd 713.9 13 833.3 673.8
animals 71.9 1 918.0 18.1
crops 355.8 2 976.5 393.5
dairy 189.9 6 058.3 148.7
meat 96.2 2 880.6 113.5
exports (fob) non-alloc xfob
agrProd 15 154.5 279.6 15 429.2
animals 2 139.5 43.2 2 182.6
crops 3 650.9 130.3 3 780.0
dairy 6 263.5 56.6 6 317.4
meat 3 100.6 49.5 3 149.2
xfob mfob flow
agrProd 15 429.2 14 377.4 15 221.0
animals 2 182.6 1 666.2 2 008.0
crops 3 780.0 3 614.1 3 725.8
dairy 6 317.4 6 159.0 6 397.0
meat 3 149.2 2 938.1 3 090.2
imports (cif) ciffob mfob
agrProd 14 811.5 434.0 14 377.4
animals 1 701.0 34.8 1 666.2
crops 3 763.5 149.4 3 614.1
dairy 6 328.6 169.6 6 159.0
meat 3 018.4 80.2 2 938.1
To be added to ITSS
for a better estimate of “trade”
Geographical distribution of
re-export trade margins
Challenges / improvements
• What if asymmetry is ‘huge’?
• Operational: algorithm vs expert
assessment
• Product or partner miss
classification
• From ITGS to NA
• Better articulation between
asymmetry exercises and
compilation process
• Research on an algorithm that can
spot product / partner miss
classification
Challenges / improvements
Keep in touch
FIGARO
ESTAT-IGA@ec.europa.eu
https://ec.europa.eu/eurostat
Thank you
© European Union 2020
Unless otherwise noted the reuse of this presentation is authorised under the CC BY 4.0 license. For any use or reproduction of elements that are
not owned by the EU, permission may need to be sought directly from the respective right holders.
Slide xx: element concerned, source: e.g. Fotolia.com; Slide xx: element concerned, source: e.g. iStock.com

Solving’ trade in goods

  • 1.
    ‘Solving’ trade ingoods asymmetries at Eurostat Pedro MARTINS FERREIRA Eurostat, Unit C5, International Global Accounts (IGA) team OECD’ Regional Global Trade in Value Added Webinar 9 June 2021
  • 2.
    • What does‘balancing trade’ really means • FIGARO’ approach • Challenges / Improvements Structure of my talk
  • 3.
  • 4.
    • Different measurement? •Different coverage? • Are both estimates equally trustworthy? • Two sample points of the same phenomena? A B 100 150 ? Balancing trade cif/fob non-alloc trade weights (weighted) average
  • 5.
  • 6.
  • 7.
    Challenges Trade asymmetry CIF /FOB exports (fob) mirror (cif) agrProd 15 154.5 14 811.5 animals 2 139.5 1 701.0 crops 3 650.9 3 763.5 dairy 6 263.5 6 328.6 meat 3 100.6 3 018.4 Eurostat UN agrProd 15 154.5 14 811.5 animals 2 139.5 2 149.8 crops 3 650.9 3 667.7 dairy 6 263.5 6 288.9 meat 3 100.6 3 112.3 Different valuations Non-allocated trade Different data sources
  • 8.
    re-exports Challenges / Opportunity(?) xEU FR EU 13.0 3.2 Other EU Other xEU Same xEU 0.1 Other EU Same EU Other EU 1.2 re-exports
  • 9.
  • 10.
    • FOB-type prices(OECD) • Relative asymmetry of trade flow 𝑖 → 𝑗 • Exports and imports weights Computation of weights 𝐴𝑖𝑗 = 𝑋𝑖𝑗 − 𝑀𝑖𝑗 𝑋𝑖𝑗 + 𝑀𝑖𝑗 𝜃𝑖 = 𝑗 𝐴𝑖𝑗 𝑋𝑖𝑗 + 𝑀𝑖𝑗 𝑗 𝑋𝑖𝑗 + 𝑀𝑖𝑗 𝜙𝑗 = 𝑖 𝐴𝑖𝑗 𝑋𝑖𝑗 + 𝑀𝑖𝑗 𝑖 𝑋𝑖𝑗 + 𝑀𝑖𝑗
  • 11.
    • 3-year averageweights • Consolidated trade as a weighted average between exports and mirror exports Consolidation 𝑇𝑖𝑗 = 1 − 𝜃𝑖 𝑋𝑖𝑗 − 1 − 𝜙𝑗 𝑀𝑖𝑗 1 − 𝜃𝑖 + 1 − 𝜙𝑗 240.4 “Brazil nuts, in shell, fresh or dried” (HS = 081070) 322.4 FR IT 309.8 5.1 “Persimmons, fresh” (HS = 080121) 71.3 FR IT 21.4
  • 12.
    QDR & triangulartrade Breaking ‘gross consolidated flows’
  • 13.
    • 𝑋𝐶: (gross)exports according to the community principle; • 𝑋𝑁: (gross) exports according to the national principle; • 𝑋𝐷: domestic component of gross exports; • 𝑋𝑅: re-exports component of gross exports; • 𝑋𝑄: quasi-transit component of gross exports. • 𝑋𝑄 = 𝑋𝐶 − 𝑋𝑁 • 𝑋𝐷 = 𝑀𝐷 𝑀𝐶 𝑋𝐶 • 𝑋𝑅 = 𝑋𝑁 − 𝑋𝐷 = 𝑋𝑁 − 𝑀𝐷 𝑀𝐶 𝑋𝐶 QDR (1)
  • 14.
    Consistency between datasources 𝑀𝐷 𝑀𝐶 𝑋𝐶 ≤ 𝑋𝑁 ≤ 𝑋𝐶 Correcting bias for domestic exports • domestic share of exports: ‘use table of domestic inputs’ / ‘use table’ • For each HS6 product within one CPA, create a matrix of HS6 products (row), domestic / non-domestic (columns): RAS to match SUIOT domestic exports QDR (2)
  • 15.
    Quasi-transit and re-exportpartners • Partners are taken from the distribution of original imports for which country of origin is different from country of consignment. QDR (3)
  • 16.
    Triangular trade A B C 50 55 100 A BC 50 5 100 A B C 50 50 100 5
  • 17.
    From orignal datato QDR Q D R agrProd 713.9 13 833.3 673.8 animals 71.9 1 918.0 18.1 crops 355.8 2 976.5 393.5 dairy 189.9 6 058.3 148.7 meat 96.2 2 880.6 113.5 exports (fob) non-alloc xfob agrProd 15 154.5 279.6 15 429.2 animals 2 139.5 43.2 2 182.6 crops 3 650.9 130.3 3 780.0 dairy 6 263.5 56.6 6 317.4 meat 3 100.6 49.5 3 149.2 xfob mfob flow agrProd 15 429.2 14 377.4 15 221.0 animals 2 182.6 1 666.2 2 008.0 crops 3 780.0 3 614.1 3 725.8 dairy 6 317.4 6 159.0 6 397.0 meat 3 149.2 2 938.1 3 090.2 imports (cif) ciffob mfob agrProd 14 811.5 434.0 14 377.4 animals 1 701.0 34.8 1 666.2 crops 3 763.5 149.4 3 614.1 dairy 6 328.6 169.6 6 159.0 meat 3 018.4 80.2 2 938.1 ICIO
  • 18.
    From orignal datato QDR Q D R agrProd 713.9 13 833.3 673.8 animals 71.9 1 918.0 18.1 crops 355.8 2 976.5 393.5 dairy 189.9 6 058.3 148.7 meat 96.2 2 880.6 113.5 exports (fob) non-alloc xfob agrProd 15 154.5 279.6 15 429.2 animals 2 139.5 43.2 2 182.6 crops 3 650.9 130.3 3 780.0 dairy 6 263.5 56.6 6 317.4 meat 3 100.6 49.5 3 149.2 xfob mfob flow agrProd 15 429.2 14 377.4 15 221.0 animals 2 182.6 1 666.2 2 008.0 crops 3 780.0 3 614.1 3 725.8 dairy 6 317.4 6 159.0 6 397.0 meat 3 149.2 2 938.1 3 090.2 imports (cif) ciffob mfob agrProd 14 811.5 434.0 14 377.4 animals 1 701.0 34.8 1 666.2 crops 3 763.5 149.4 3 614.1 dairy 6 328.6 169.6 6 159.0 meat 3 018.4 80.2 2 938.1 To be added to ITSS for a better estimate of “trade” Geographical distribution of re-export trade margins
  • 19.
  • 20.
    • What ifasymmetry is ‘huge’? • Operational: algorithm vs expert assessment • Product or partner miss classification • From ITGS to NA • Better articulation between asymmetry exercises and compilation process • Research on an algorithm that can spot product / partner miss classification Challenges / improvements
  • 21.
  • 22.
    Thank you © EuropeanUnion 2020 Unless otherwise noted the reuse of this presentation is authorised under the CC BY 4.0 license. For any use or reproduction of elements that are not owned by the EU, permission may need to be sought directly from the respective right holders. Slide xx: element concerned, source: e.g. Fotolia.com; Slide xx: element concerned, source: e.g. iStock.com

Editor's Notes

  • #7 Agricultural products Standard Code List
  • #22 Delete/update as appropriate
  • #23 Update/add/delete parts of the copy right notice where appropriate. More information: https://myintracomm.ec.europa.eu/corp/intellectual-property/Documents/2019_Reuse-guidelines%28CC-BY%29.pdf