Downloaded 1,091 times
![Welcome! Session 3 – July 20, 2004 Instructor - Kevin Hawley [email_address]](https://image.slidesharecdn.com/strategic-business-planning-part-33785/85/Strategic-Business-Planning-Part-3-1-320.jpg)
![Welcome! Session 3 – July 20, 2004 Instructor - Kevin Hawley [email_address]](https://image.slidesharecdn.com/strategic-business-planning-part-33785/75/Strategic-Business-Planning-Part-3-1-2048.jpg)
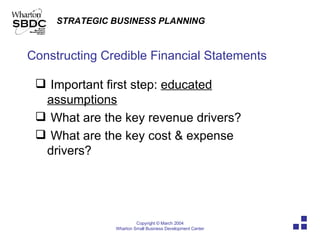
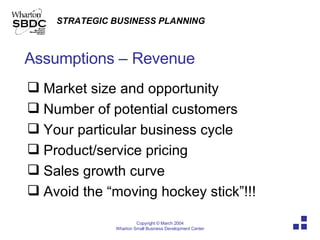
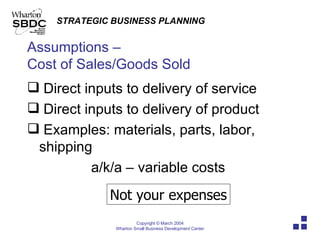
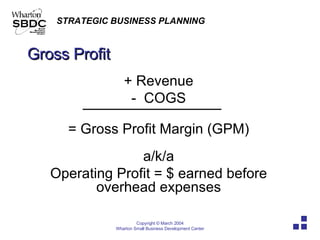
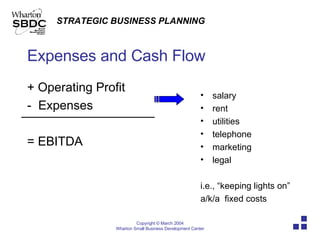
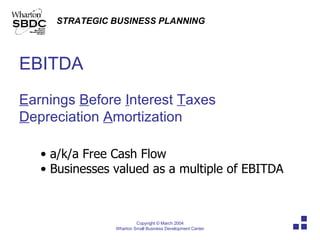
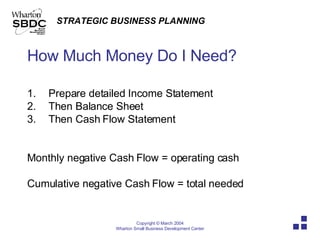
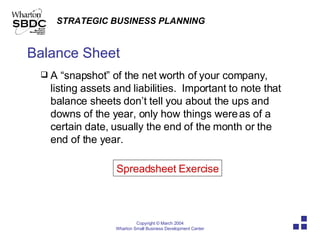
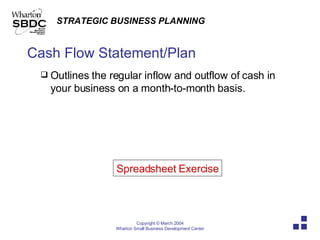
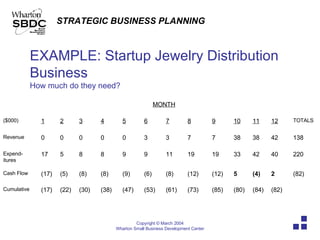
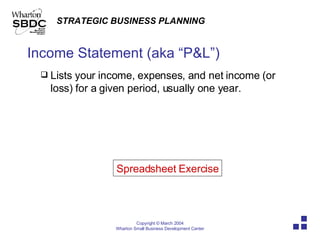
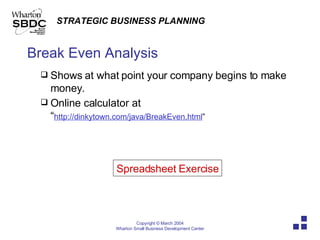
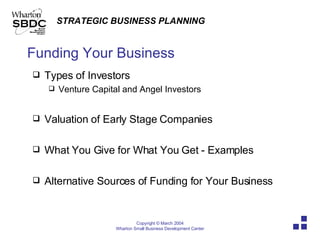
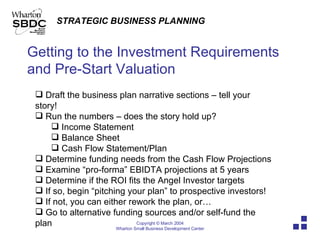
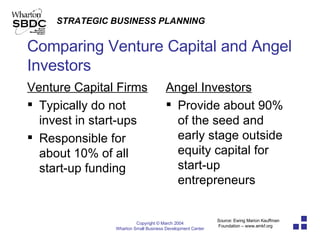
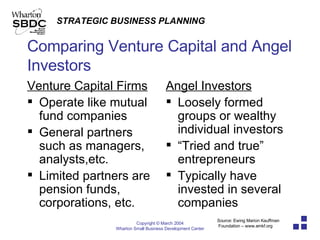
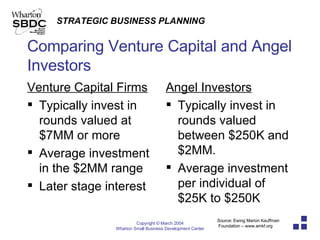
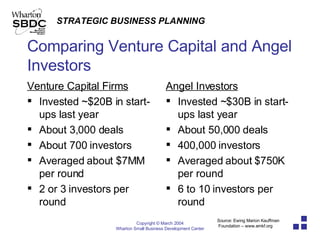
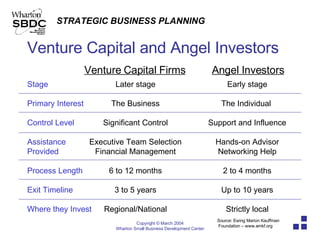
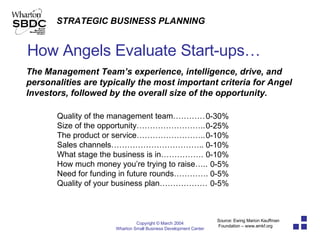
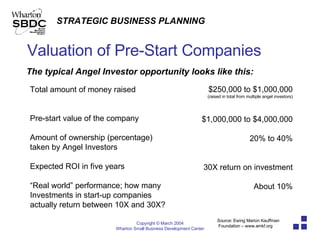
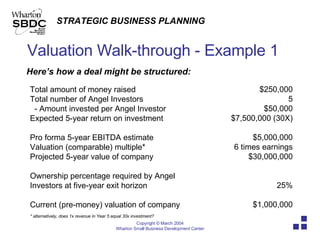
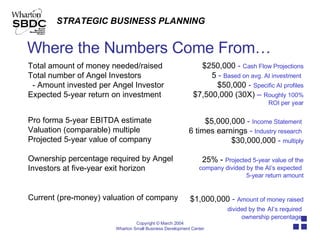
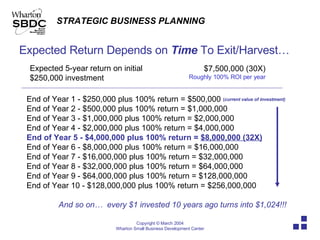
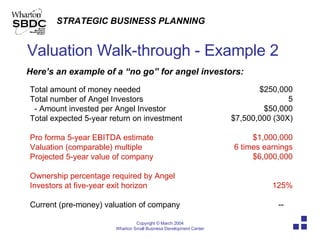
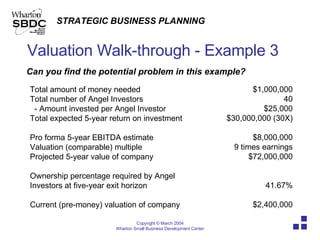
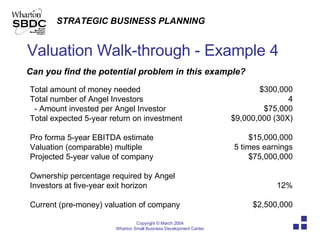
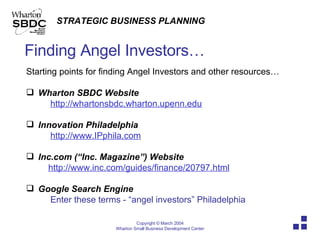

The document summarizes key points from a session on developing financial plans for a business. It discusses constructing pro forma financial statements, including income statements, balance sheets, cash flow statements and break even analysis. It covers assumptions for revenues, costs, and cash needs. Valuation of early stage companies and sources of funding such as angel investors are also summarized.


