More than Just Lines on a Map: Best Practices for U.S Bike Routes
Story 01
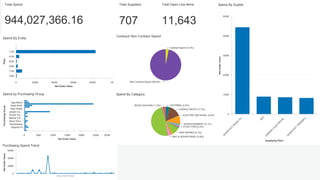
1. Total Spend
944,027,366.16
Total Suppliers
707
Total Open Line items
11,643
Contract/ Non Contract Spend
Contract Spend (3.2%)
Non Contract Spend (96.8%)
Spend By Category
CATERING (2.4%)
CONSULTANTS (13.7%)
ELECTRIC MATERIAL (0.0%)
ENTERTAINMENT (0.1%)
FOOD ITEM (0.5%)
MEP WORKS (9.1%)
MKT & ADVERTISING (3.8%)
WOOD SHAVING (1.2%)
Spend By Entity
Plant
1100
5100
5200
5300
7100
7200
Net Order Value
0 200M 400M 600M 800M 1B
Spend by Purchasing Group
PurchasingGroup
Aga Mehdi
Asad Khan
Hala Shaka
Joseph Gu...
Kurian Var...
Marisa S R...
Mirza Ghul...
Ravishankar
Shajihan N
Net Order Value
0 50M 100M 150M 200M 250M 300M
Spend By Suplier
Supplying Plant
G
H
AN
TO
O
T
R
O
AD
C
O
...
W
ET
D
AN
W
AY
ELEC
TR
IC
AL...
G
H
AN
TO
O
T
TR
AN
SPO
...
NetOrderValue
0
100M
200M
300M
400M
500M
Purchasing Spend Trend
Document Date
NetOrderValue
0
200M
400M
600M