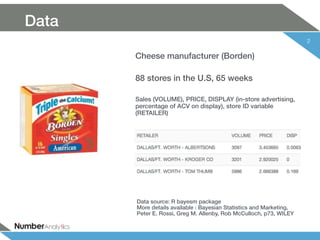
This document describes how a cheese manufacturer (Borden) can allocate their marketing resources like display advertising and price discounts across 88 retailer stores. It recommends using a Bayesian demand model to estimate demand parameters at the store level to overcome limitations of individual store analysis. The model finds most stores have a price elasticity around -0.954, meaning a 10% price decrease increases sales by 9.54% on average. It also estimates how much increasing display coverage to 100% would increase sales 462.94% on average. The document advises prioritizing display budgets for stores with high estimated display lift and price discounts for stores with high price elasticity.


![What if analysis
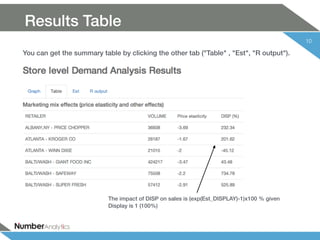
In-store Display ad simulation
11
What if analysis:
When in-store DISPLAY ad coverage is 10%,
the sales is increased by 18.86%
[exp(1.728 * 0.1) -1 ]*100=18.86
Est_DISPLAY is 1.728](https://image.slidesharecdn.com/tutorialcheeseretail-140902222551-phpapp01/85/Store-level-Demand-Analysis-using-Bayesian-Log-linear-model-11-320.jpg)


![[Report] Real-Time Marketing: The Agility to Leverage 'Now' by Rebecca Lieb &...](https://cdn.slidesharecdn.com/ss_thumbnails/reportreal-timemarketing-theagilitytoleveragenowrebeccaliebjessicagroopman-131212115620-phpapp02-thumbnail.jpg?width=640&height=640&fit=bounds)


