As the cost and location advantages of Southeast Asian production areas become more apparent, the expansion of Chinese textile enterprises to Vietnam and other Southeast Asian countries has become a trend. How will the trade war affect China’s textile industry? What textile sub-sectors are still growing? What companies are investing in Vietnam?
Challenges of Apparel Exports from India - Presentation @ Indian Institute...SN Panigrahi, PMP
I had an Opportunity to Provide Training to the Officials of Directorate of MSME, Govt. of West Bengal on "Training of Master Trainers for Export Consultancy in the Gems and Jewellery & Apparel Sector of West Bengal“
Through Indian Institute of Foreign Trade (IIFT), Kolkata on Hybrid Mode on 1st Dec'2021.
This is Part of West Bengal Government's Strategy to Promote Exports from the State. West Bengal Government Targeted to Double the Apparel Exports from the State in next 3-5 Years.
SN Panigrahi
U.S. Organic Cotton Market. Analysis and Forecast To 2025IndexBox Marketing
This report provides an in-depth analysis of the U.S. organic cotton market. It presents the latest data of the market size and volume, domestic production, exports and imports, price dynamics and turnover in the industry. The forecast reveals market prospects to 2025.
Project on study of employees job satisfaction, it can analysis all accepts. you can a good information through that.
and know the sanctification level of employees in the organization
Indian Textiles and garment Industry
Various information regarding policy sector and recent investments and tax policy.It includes info. about key players and industry export opportunities also Current budget 2017 as financial supports in this industry.
Opendatabay - Open Data Marketplace.pptxOpendatabay
Opendatabay.com unlocks the power of data for everyone. Open Data Marketplace fosters a collaborative hub for data enthusiasts to explore, share, and contribute to a vast collection of datasets.
First ever open hub for data enthusiasts to collaborate and innovate. A platform to explore, share, and contribute to a vast collection of datasets. Through robust quality control and innovative technologies like blockchain verification, opendatabay ensures the authenticity and reliability of datasets, empowering users to make data-driven decisions with confidence. Leverage cutting-edge AI technologies to enhance the data exploration, analysis, and discovery experience.
From intelligent search and recommendations to automated data productisation and quotation, Opendatabay AI-driven features streamline the data workflow. Finding the data you need shouldn't be a complex. Opendatabay simplifies the data acquisition process with an intuitive interface and robust search tools. Effortlessly explore, discover, and access the data you need, allowing you to focus on extracting valuable insights. Opendatabay breaks new ground with a dedicated, AI-generated, synthetic datasets.
Leverage these privacy-preserving datasets for training and testing AI models without compromising sensitive information. Opendatabay prioritizes transparency by providing detailed metadata, provenance information, and usage guidelines for each dataset, ensuring users have a comprehensive understanding of the data they're working with. By leveraging a powerful combination of distributed ledger technology and rigorous third-party audits Opendatabay ensures the authenticity and reliability of every dataset. Security is at the core of Opendatabay. Marketplace implements stringent security measures, including encryption, access controls, and regular vulnerability assessments, to safeguard your data and protect your privacy.
Show drafts
volume_up
Empowering the Data Analytics Ecosystem: A Laser Focus on Value
The data analytics ecosystem thrives when every component functions at its peak, unlocking the true potential of data. Here's a laser focus on key areas for an empowered ecosystem:
1. Democratize Access, Not Data:
Granular Access Controls: Provide users with self-service tools tailored to their specific needs, preventing data overload and misuse.
Data Catalogs: Implement robust data catalogs for easy discovery and understanding of available data sources.
2. Foster Collaboration with Clear Roles:
Data Mesh Architecture: Break down data silos by creating a distributed data ownership model with clear ownership and responsibilities.
Collaborative Workspaces: Utilize interactive platforms where data scientists, analysts, and domain experts can work seamlessly together.
3. Leverage Advanced Analytics Strategically:
AI-powered Automation: Automate repetitive tasks like data cleaning and feature engineering, freeing up data talent for higher-level analysis.
Right-Tool Selection: Strategically choose the most effective advanced analytics techniques (e.g., AI, ML) based on specific business problems.
4. Prioritize Data Quality with Automation:
Automated Data Validation: Implement automated data quality checks to identify and rectify errors at the source, minimizing downstream issues.
Data Lineage Tracking: Track the flow of data throughout the ecosystem, ensuring transparency and facilitating root cause analysis for errors.
5. Cultivate a Data-Driven Mindset:
Metrics-Driven Performance Management: Align KPIs and performance metrics with data-driven insights to ensure actionable decision making.
Data Storytelling Workshops: Equip stakeholders with the skills to translate complex data findings into compelling narratives that drive action.
Benefits of a Precise Ecosystem:
Sharpened Focus: Precise access and clear roles ensure everyone works with the most relevant data, maximizing efficiency.
Actionable Insights: Strategic analytics and automated quality checks lead to more reliable and actionable data insights.
Continuous Improvement: Data-driven performance management fosters a culture of learning and continuous improvement.
Sustainable Growth: Empowered by data, organizations can make informed decisions to drive sustainable growth and innovation.
By focusing on these precise actions, organizations can create an empowered data analytics ecosystem that delivers real value by driving data-driven decisions and maximizing the return on their data investment.
As Europe's leading economic powerhouse and the fourth-largest hashtag#economy globally, Germany stands at the forefront of innovation and industrial might. Renowned for its precision engineering and high-tech sectors, Germany's economic structure is heavily supported by a robust service industry, accounting for approximately 68% of its GDP. This economic clout and strategic geopolitical stance position Germany as a focal point in the global cyber threat landscape.
In the face of escalating global tensions, particularly those emanating from geopolitical disputes with nations like hashtag#Russia and hashtag#China, hashtag#Germany has witnessed a significant uptick in targeted cyber operations. Our analysis indicates a marked increase in hashtag#cyberattack sophistication aimed at critical infrastructure and key industrial sectors. These attacks range from ransomware campaigns to hashtag#AdvancedPersistentThreats (hashtag#APTs), threatening national security and business integrity.
🔑 Key findings include:
🔍 Increased frequency and complexity of cyber threats.
🔍 Escalation of state-sponsored and criminally motivated cyber operations.
🔍 Active dark web exchanges of malicious tools and tactics.
Our comprehensive report delves into these challenges, using a blend of open-source and proprietary data collection techniques. By monitoring activity on critical networks and analyzing attack patterns, our team provides a detailed overview of the threats facing German entities.
This report aims to equip stakeholders across public and private sectors with the knowledge to enhance their defensive strategies, reduce exposure to cyber risks, and reinforce Germany's resilience against cyber threats.
Techniques to optimize the pagerank algorithm usually fall in two categories. One is to try reducing the work per iteration, and the other is to try reducing the number of iterations. These goals are often at odds with one another. Skipping computation on vertices which have already converged has the potential to save iteration time. Skipping in-identical vertices, with the same in-links, helps reduce duplicate computations and thus could help reduce iteration time. Road networks often have chains which can be short-circuited before pagerank computation to improve performance. Final ranks of chain nodes can be easily calculated. This could reduce both the iteration time, and the number of iterations. If a graph has no dangling nodes, pagerank of each strongly connected component can be computed in topological order. This could help reduce the iteration time, no. of iterations, and also enable multi-iteration concurrency in pagerank computation. The combination of all of the above methods is the STICD algorithm. [sticd] For dynamic graphs, unchanged components whose ranks are unaffected can be skipped altogether.
Chatty Kathy - UNC Bootcamp Final Project Presentation - Final Version - 5.23...John Andrews
SlideShare Description for "Chatty Kathy - UNC Bootcamp Final Project Presentation"
Title: Chatty Kathy: Enhancing Physical Activity Among Older Adults
Description:
Discover how Chatty Kathy, an innovative project developed at the UNC Bootcamp, aims to tackle the challenge of low physical activity among older adults. Our AI-driven solution uses peer interaction to boost and sustain exercise levels, significantly improving health outcomes. This presentation covers our problem statement, the rationale behind Chatty Kathy, synthetic data and persona creation, model performance metrics, a visual demonstration of the project, and potential future developments. Join us for an insightful Q&A session to explore the potential of this groundbreaking project.
Project Team: Jay Requarth, Jana Avery, John Andrews, Dr. Dick Davis II, Nee Buntoum, Nam Yeongjin & Mat Nicholas
Stone Tan China Textile Industry Report (May 2019)
1. Industry Report: Textile Industry
(May 2019)
May 2019
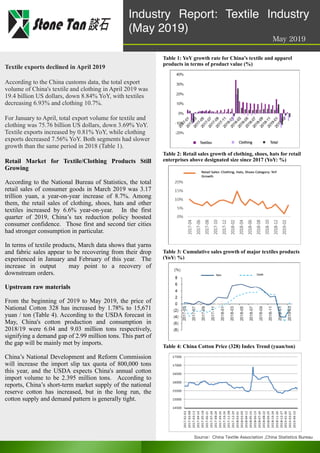
Table 1: YoY growth rate for China’s textile and apparel
products in terms of product value (%)
Textile exports declined in April 2019
According to the China customs data, the total export
volume of China's textile and clothing in April 2019 was
19.4 billion US dollars, down 8.84% YoY, with textiles
decreasing 6.93% and clothing 10.7%.
For January to April, total export volume for textile and
clothing was 75.76 billion US dollars, down 3.69% YoY.
Textile exports increased by 0.81% YoY, while clothing
exports decreased 7.56% YoY. Both segments had slower
growth than the same period in 2018 (Table 1).
Retail Market for Textile/Clothing Products Still
Growing
According to the National Bureau of Statistics, the total
retail sales of consumer goods in March 2019 was 3.17
trillion yuan, a year-on-year increase of 8.7%. Among
them, the retail sales of clothing, shoes, hats and other
textiles increased by 6.6% year-on-year. In the first
quarter of 2019, China’s tax reduction policy boosted
consumer confidence. Those first and second tier cities
had stronger consumption in particular.
In terms of textile products, March data shows that yarns
and fabric sales appear to be recovering from their drop
experienced in January and February of this year. The
increase in output may point to a recovery of
downstream orders.
Upstream raw materials
From the beginning of 2019 to May 2019, the price of
National Cotton 328 has increased by 1.78% to 15,671
yuan / ton (Table 4). According to the USDA forecast in
May, China's cotton production and consumption in
2018/19 were 6.04 and 9.03 million tons respectively,
signifying a demand gap of 2.99 million tons. This part of
the gap will be mainly met by imports.
China’s National Development and Reform Commission
will increase the import slip tax quota of 800,000 tons
this year, and the USDA expects China's annual cotton
import volume to be 2.395 million tons. According to
reports, China’s short-term market supply of the national
reserve cotton has increased, but in the long run, the
cotton supply and demand pattern is generally tight.
Table 3: Cumulative sales growth of major textiles products
(YoY: %)
Table 4: China Cotton Price (328) Index Trend (yuan/ton)
Source:China Textile Association ,China Statistics Bureau
Table 2: Retail sales growth of clothing, shoes, hats for retail
enterprises above designated size since 2017 (YoY: %)
2. Overseas production capacity increase
As the cost and location advantages of Southeast Asian production
areas become more apparent, the expansion of Chinese textile
enterprises to Vietnam and other Southeast Asian countries has
become a trend. It is expected that Vietnam’s production capacity
will continue to increase in the future due to future investment.
Vietnam expects to reach 40 billion USD in terms of textile exports
in 2019, a 11% YoY growth.
This trend is evident in recent investment by Chinese listed
companies. Since 2013, many Chinese listed companies have
announced factory investments in Vietnam and other Asian
countries, with some Chinese companies setting up one third of their
global capacity in Vietnam. This ratio is expected to increase in
coming years.
Company Name Region Overseas Production News Ratio of Overseas
PRoduction
Bai Long 百隆东⽅
(601339.SH)
Vietnam
First Phase in November 2012 (100,000 spindles); Second Phase in January
2014 (200,000 spindles); Third Phase (April 2015) put Vietnam's total output to
500,000 spindles; Plans to add another 500,000 spindles i next three years.
45%
Lu Tai 鲁泰A
(000726.SZ)
Vietnam
In 2017, the first phase of its Vietnam project was completed (30 million-meter
yarn-dyed fabric project and a 3 million shirt project). In 2018, the second phase
was built (76,000 spindles, 40 million-meter yarn-dyed fabric, and the second
part of the 3 million shirt project).
Cambodia
In December 2013, the first phase (3 million shirt project) was put into
production; in November 2015, second phase (3 million shirt project) was
completed.
Myanmar In 2015, a 3 million shirt project was completed in Myanmar.
Hua Fu Fashion
华孚时尚
(603558.SH)
Vietnam
At the end of 2017, about 300,000 spindles of yarn capacity have been put into
production; in December 2018, it was announced that it plans to build another
500,000 spindles.
20%
Jian Sheng
健盛集团
(603558.SH)
Vietnam
In March 2015, Jian Sheng invested in a cotton socks facility (40 million pairs).
In 2017, a second phase was completed (130 million pairs of medium/high-
grade cotton socks and 15,000 tons of textile printing and dyeing project). In
2018, a high-grade cotton sock line was completed (6,500 pairs), making the
production capacity in Vietnam around 140 million pairs. In December 2018,
Jian Sheng announced that 200 million RMB will be invested for the
production base of 90 million pairs of cotton socks and 250 million RMB for a
seamless knit underwear production base (18 million pieces).
1/3
Shen Zhou
申洲国际
(2313.HK)
Vietnam
In 2017, the fabric materials production capacity reached 190 tons/day, and in
2018, it was increased to 300 tons/day. In addition, a garment factory has
already started production in the first phase, and the second phase is expected to
be put into production in 2019.
Raw Material
40%;Clothing
30%
Cambodia
In 2018, a new garment factory was put into operation, with an estimated scale
of 1,000-2,000 people.
Tian Hong
天虹纺织 (2678.HK)
Vietnam
In 2017, Tian Hong’s Vietnam production capacity reached 1.25 million
spindles in Vietnam; in 2018, it plans to add 220,000 spindles. 40%
Lian Fa
联发股份
(002394.HK)
Bangladesh
Its Bangladesh factory has already been put into production and is responsible
for mass production of large goods.
-
Cambodia Lian Fa has 2 Cambodian subsidiaries engaged in shirt production.
Table 6: List of Southeast Asian Capacity Distribution of Leading Enterprises in China's Textile Industry
Source:Qian Zhan Research 前瞻产业研究院整理理
2016 2017 2018 2019E
Vietnam’s Global
Textile and Clothing
Exports
28.7 31.1 36.1 40.0
Growth 8% 16% 11%
Table 5: Growth in Vietnam’s Textile Market (billion
USD)
Vietnam’s key textile export markets include the United
States, Japan, China, Korea, and Germany.
Source: World Bank
3. Growing Sub-sectors: Children's Wear / Sportswear
Benefiting from consumption trends and the second-child policy dividend, China's children's wear market is still experiencing
positive growth. It is estimated that the market size of the children's wear industry will exceed revenue of all the other clothing
sub-sectors. In the below chart (Table 6), growth is expected to be around 5.5% in 2019.
In addition to children's wear, another growing sub-sector is sportswear. In recent years, the China government has issued a
series of policies to promote physical fitness, athletics and domestic sports. These policies have had a positive impact on
sportswear demand. The sportswear market consists of three key composites: the professional training apparel market (33%),
outdoor apparel market (17%), and sports-derived apparel accounts (50%). In the Table 7, sportwear maintained a 9-10% growth
in 2018, which is above most other textile segments.
US-China Trade War Update
On May 10, 2019, the United States added a 25% tariff on the Chinese goods worth US$200 billion. This will impact specific
parts of the textile industry including yarns, fabrics, industrial finished products and some household textiles. It is estimated that
those textile sectors impacted could be around 4 billion US dollars. Considering that China's total textile industry has exports of
more than $270 billion a year, the overall impact to the industry is around 2%, making it a small amount. However, according to
World Bank Statistics, China’s textiles and clothing exports accounted for about 37% of textile imports to the United States
(2017 - China Imports - 42.5 billion USD vs Total Imports - 114 billion USD). Despite efforts by US purchasers to find cheaper
suppliers in countries such as Vietnam, India, and Mexico (See Chart 8), the immediate impact could cause US consumers to pay
higher costs for their textile products (See Table 9).
On May 13, the Office of the US Trade Representative announced it is planning an additional 25% tariff on about 325 billion US
dollars on Chinese goods, including other textile industry exports such as domestic textiles and some textile machinery products.
This amount is expected to be more than $40 billion. The United States is currently seeking public comment on the list and will
hold a public hearing on June 17. If this part of the commodity tariff is imposed, it could also have an impact on China’s
domestic textile industry.
Table 8:2012-18 China’s Athletic Clothing Market
Size(100 million RMB,%)
Table 7:2013-2019 China’s Children Wear Sales and
Forecast (100 million RMB,%)
Table 9:Impact on Consumers in the United States’
Consumer from Tariffs (Athletic Shoes/Children’s Shoes)
Athletic Shoes Children’s
Shoes
Retail Price(Prior to
25%)
HK$48.18 HK$13.96
Retail
Price(Following
25% Hike)
HK$60.93 HK$18.36
Real Price Increase
for Consumers
26% 32%
Table 8: Trend in Textile Exports per Country to the United
States from 2014 to 2017 (billion US dollars)
2014 2017 CAGR
China 43.0 40.9 -1.3%
Vietnam 9.9 12.3 5.4%
India 7.4 8.2 2.6%
Bangladesh 5.1 5.3 1.1%
Mexico 5.5 5.5 -0.2%
Indonesia 5.3 4.9 -1.6%
Sources: World Bank, Quartz, Euromonitor, Qian Zhan
4. 重庆谈⽯融资租赁有限公司,是由“谈⽯中国⾦
融投资有限公司”与“重庆渝富控股集团有限公
司”共同出资组建。
Stone Tan Financial Leasing Company was jointly
invested by both Stone Tan Finance and Investment
Company Ltd. and Chongqing Yufu Assets
Management (Group) Company Ltd.
主营业务 Key Business Types
直接融资租赁,售后回租,委托租赁,管理咨
询,财务顾问
Direct Leasing, Sales Leaseback, Entrusted Loans,
Management Consulting, Financial Advising Scan the Wechat Code Above for
company news and reports.
About Stone Tan
In 2010, Stone Tan was established
in Chongqing to focus on financing
solutions to small and medium sized
businesses in Chongqing.The
company is currently focused on the
f i n a n c i a l l e a s i n g b u s i n e s s
throughout China, with presence in
Chongqing, Anhui, Sichuan,
Jiangsu, Zhejiang, and Hong Kong.
China HQ - Chongqing
Address: 61 Dongsheng Road 16th
Floor
Chongqing, China 400023
Tel: +86 023-88197891
Stone Tan Anhui
Address:B&C 11th floor, No 1
Building, CBD Central Plaza, No 369,
ChangJiang Road Middle, HeFei,
Anhui, China
Phone:+86 551 62851935/936/937
Shanghai Office
Address:398 Tianlin Road (Building
A, Floor 2)
Phone:+86-21 54504666
Hong Kong Office
Address:Unit 2104, 21/F, Tower 2,
Lippo Centre, 89 Queensway, Central,
Hong Kong
Phone:+852 27355188