Stock yo-yo
•
0 likes•52 views

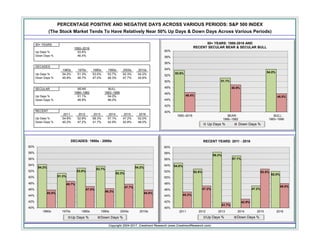
This document analyzes stock market trends in the S&P 500 index over various periods from 1950 to 2016. It finds that the percentage of up days and down days remains relatively balanced, averaging close to 50% for each across decades, individual years, and longer secular bull and bear markets. Specifically, it notes that all decades from the 1960s to 2010s had between 51-54% up days and 46-49% down days on average.
Report
Share
Report
Share
Download to read offline
Recommended
e_2034ada.pdf
Ε. 2034 /10-05-2023: Οδηγίες για τη συμπλήρωση και την εκκαθάριση της δήλωσης φορολογίας εισοδήματος νομικών προσώπων και νομικών οντοτήτων φορολογικού έτους 2022.
Digital Marketing για μικρές και μεσαίες επιχειρήσεις
Digital Marketing για μικρές και μεσαίες επιχειρήσεις, από Γεώργιο Τσίτσο (MyConnection)
a1039fek.pdf
Α. 1039 /23: Τύπος και περιεχόμενο της «ΚΑΤΑΣΤΑΣΗΣ ΟΙΚΟΝΟΜΙΚΩΝ ΣΤΟΙΧΕΙΩΝ ΑΠΟ ΕΠΙΧΕΙΡΗΜΑΤΙΚΗ ΔΡΑΣΤΗΡΙΟΤΗΤΑ» – Έντυπο Ε3.
a_1021ada.pdf
Α. 1021 /24-02-2023: Αναβάθμιση λειτουργούντων Φορολογικών Ταμειακών Μηχανών και Αυτόνομων Δημοσιονομικών Μονάδων Επεξεργασίας (ΑΔΗΜΕ) με εξαίρεση των Αυτόνομων Δημοσιονομικών Μονάδων Επεξεργασίας (ΑΔΗΜΕ) Ταξιμέτρων.
6092b-22.pdf
ΓΔΟΥ 85/22: Περί της διαδικασίας και τις προϋποθέσεις χορήγησης ενίσχυσης με τη μορφή επιστρεπτέας προκαταβολής σε επιχειρήσεις που επλήγησαν οικονομικά λόγω κορωνοϊού.
Α1128_2022_FEK.pdf
Α. 1128 /21-09-2022: Καθορισμός της αρμόδιας αρχής, του τρόπου και της διαδικασίας για την καταβολή, μείωση και επιστροφή του οφειλόμενου ΦΠΑ, στο πλαίσιο των ειδικών καθεστώτων του ηλεκτρονικού εμπορίου, της απόδοσης αυτού στα άλλα κράτη-μέλη, των τηρούμενων λογιστικών καταχωρήσεων καθώς και ρύθμιση συναφών θεμάτων στην περίπτωση που η Ελλάδα είναι κράτος μέλος εγγραφής ή/και κράτος μέλος κατανάλωσης.
69ΙΔ46ΜΤΛΡ-8Τ2.pdf
ΥΠ.AN.: Διευκρίνιση σχετικά με την υποχρέωση εγγραφής του αριθμού ΓΕΜΗ στις αποδείξεις και τιμολόγια
a_1089_2022ada.pdf
Α. 1089 /05-07-2022: Τροποποίηση της υπό στοιχεία Α. 1087/21 - Διαδικασία και προϋποθέσεις υπαγωγής στις διατάξεις του άρθρου 5Γ του ν. 4172/13, περί ειδικού τρόπου φορολόγησης εισοδήματος από μισθωτή εργασία και επιχειρηματική δραστηριότητα που προκύπτει στην ημεδαπή, φυσικών προσώπων που μεταφέρουν τη φορολογική τους κατοικία στην Ελλάδα.
a1090_2022.pdf
Α. 1090 /05-07-2022: Τροποποίηση της υπό στοιχεία Α.1138/12.6.2020 ΚΥΑ - Καθορισμός της έκτασης εφαρμογής, του χρόνου και της διαδικασίας ηλεκτρονικής διαβίβασης δεδομένων στην ΑΑΔΕ, καθώς και κάθε άλλου αναγκαίου θέματος για την εφαρμογή των διατάξεων του άρθρου 15Α του ν. 4174/2013 (ΚΦΔ)» και άλλες ρυθμίσεις.
e2042-22.pdf
Ε. 2042/10-5-22: Παροχή διευκρινίσεων σχετικά με τα πρόστιμα που αφορούν τις παραβάσεις έκδοσης πλαστών ή εικονικών φορολογικών στοιχείων ή λήψης εικονικών φορολογικών στοιχείων ή νόθευσης αυτών, καθώς και καταχώρισης στα βιβλία αγορών ή εξόδων που δεν έχουν πραγματοποιηθεί και για τα οποία δεν έχει εκδοθεί φορολογικό στοιχείο, κατόπιν έκδοσης της υπ'αρ. 2319/2021 Απόφασης του Συμβουλίου της Επικράτειας.
a1056_2022.pdf
A. 1056 /22: Τύπος και περιεχόμενο της δήλωσης ΕΝΦΙΑ - πράξης προσδιορισμού φόρου έτους 2022 και επομένων.
2152b-22-2-4.pdf
ΥΠΕΚΥΠ 40066/22 (ΦΕΚ 2152 Β/3-5-22): Ψηφιακή διαδικασία κανονισμού κύριων και επικουρικών συντάξεων λόγω γήρατος ή λόγω θανάτου, αρμοδιότητας της Γενικής Διεύθυνσης Συντάξεων Δημοσίου Τομέα, του e-ΕΦΚΑ.
e2040_2022.pdf
Ε. 2040 /20-04-2022: Οδηγίες για τη συμπλήρωση και την εκκαθάριση της δήλωσης φορολογίας εισοδήματος νομικών προσώπων και νομικών οντοτήτων φορολογικού έτους 2021
a1052_2022fek.pdf
Α. 1052 /20-04-2022: Τύπος και περιεχόμενο των δηλώσεων φορολογίας εισοδήματος φορολογικού έτους 2021 των νομικών προσώπων και νομικών οντοτήτων του άρθρου 45 του ν. 4172/2013 και καθορισμός δικαιολογητικών που υποβάλλονται μ’ αυτές - Υποβολή με τη χρήση ηλεκτρονικής μεθόδου επικοινωνίας των δηλώσεων φορολογίας εισοδήματος των νομικών προσώπων και νομικών οντοτήτων του άρθρου 45 του ν. 4172/2013.
1819b-22.pdf
ΚΥΑ, 35129/22 (ΦΕΚ 1819 Τεύχος Β/13.04.2022): Καθορισμός της διαδικασίας καταβολής του επιδόματος εορτών Πάσχα 2022 και ασφαλιστικών εισφορών εργαζομένων που καλύπτονται από τον κρατικό προϋπολογισμό.
e_2031_2022ada.pdf
Ε. 2031 /29-03-2022: Διευκρινίσεις για την εφαρμογή της περιπτ. ιστ΄της παρ. 1 του άρθρου 27 του Κώδικα ΦΠΑ περί απαλλαγής ΦΠΑ σε πράξεις που συνδέονται με δωρεές σε εκκλησιαστικά ΝΠΔΔ του άρθ. 1 παρ. 4 του ν.590/1977 και σε εποπτευόμενα από τα πρόσωπα αυτά εκκλησιαστικά ΝΠΙΔ.
aade 010422.pdf
Πληροφορίες που έχει στη διάθεσή της η ΑΑΔΕ και αφορούν στη δήλωσή σας φορολογικού έτους 2021
65a-22.pdf
Ν. 4916/22 (ΦΕΚ 65 Α/28-3-22): Εκσυγχρονισμός του πλαισίου λειτουργίας της Επιτροπής Κεφαλαιαγοράς - Πρόγραμμα συνεισφοράς Δημοσίου σε ευάλωτους οφειλέτες μέχρι τη μεταβίβαση της κατοικίας τους στον φορέα απόκτησης και επαναμίσθωσης του κεφαλαίου Α’ του μέρους δευτέρου του τρίτου βιβλίου του ν. 4738/2020 - Ενσωμάτωση στην ελληνική νομοθεσία των Οδηγιών (ΕΕ) 2020/1151 και (ΕΕ) 2021/1159, νέος μειωμένος ΕΝΦΙΑ, επείγουσες φορολογικές και τελωνειακές ρυθμίσεις για την αντιμετώπιση ιδίως της ενεργειακής κρίσης και άλλες διατάξεις
e2026_2022.pdf
Ε. 2026 /18-03-2022: Νέοι αριθμοί φορολογικού μητρώου ΦΠΑ υποκείμενων στον φόρο εγγεγραμμένων στη Βουλγαρία.
E 2025 2022ada
E. 2025 /17-03-2022: Οδηγίες συμπλήρωσης εντύπου Ε3 (Κατάσταση Οικονομικών Στοιχείων από Επιχειρηματική Δραστηριότητα) και Κατάστασης Φορολογικής Αναμόρφωσης φορολογικού έτους 2021.
A1034 2022 fek
A. 1034 /09-03-2022: Τύπος και περιεχόμενο της δήλωσης φορολογίας εισοδήματος φυσικών προσώπων φορολογικού έτους 2021, των λοιπών εντύπων και των δικαιολογητικών εγγράφων που συνυποβάλλονται με αυτή. Τύπος και περιεχόμενο της πράξης διοικητικού/διορθωτικού προσδιορισμού φόρου φορολογικών ετών 2021 και εφεξής για φορολογούμενους που έχουν υπαχθεί στις διατάξεις του άρθρου 5Β του ν. 4172/2013 (Α’ 167).
E 2023 2022ada
Ε. 2023 /22: Παροχή διευκρινίσεων για τη φορολογική μεταχείριση κρασιών μικρών οινοπαραγωγών.
Egkiklios 8 asfalistikis ikanotitas 2022
ΕΦΚΑ – Τι ισχύει για την Χορήγηση - Παράταση Ασφαλιστικής Ικανότητας για το ασφαλιστικό έτος 2022
E2022 22
E. 2022 /25-02-2022: Κοινοποίηση της υπ’ αριθμ. 165/2021 γνωμοδότησης του Νομικού Συμβουλίου του Κράτους για το εάν οι διατάξεις της παρ.6 του άρθρου 64 του ν.4172/2013 (Α' 167) καταλαμβάνουν το εισόδημα που αποκτούν τα πιστωτικά ιδρύματα από τόκους ομολογιακών δανείων που έχουν εκδοθεί από ανώνυμες εταιρείες, σύμφωνα με τις διατάξεις του άρθρου 59 του ν.4548/2018 (Α' 104).
A 1027 2022ada
A. 1027 /22: Παράταση της προθεσμίας υποβολής στοιχείων και πληροφοριών της ΠΟΛ 1033/14, τα οποία διαβιβάζονται στην ΑΑΔΕ από πιστωτικά και χρηματοδοτικά ιδρύματα και ιδιωτικά εκπαιδευτήρια...
A 1025 2022ada
Α. 1025 /15-02-2022: Επικαιροποίηση στη ψηφιακή πύλη myAADE των στοιχείων επικοινωνίας των πιστοποιημένων χρηστών των ηλεκτρονικών υπηρεσιών της Ανεξάρτητης Αρχής Δημοσίων Εσόδων.
Does teamwork really matter? Looking beyond the job posting to understand lab...
Does teamwork really matter? Looking beyond the job posting to understand lab...Labour Market Information Council | Conseil de l’information sur le marché du travail
Vicinity Jobs’ data includes more than three million 2023 OJPs and thousands of skills. Most skills appear in less than 0.02% of job postings, so most postings rely on a small subset of commonly used terms, like teamwork.
Laura Adkins-Hackett, Economist, LMIC, and Sukriti Trehan, Data Scientist, LMIC, presented their research exploring trends in the skills listed in OJPs to develop a deeper understanding of in-demand skills. This research project uses pointwise mutual information and other methods to extract more information about common skills from the relationships between skills, occupations and regions.在线办理(UMASS毕业证书)马萨诸塞大学阿默斯特分校毕业证完成信一模一样
学校原件一模一样【微信:741003700 】《(UMASS毕业证书)马萨诸塞大学阿默斯特分校毕业证》【微信:741003700 】学位证,留信认证(真实可查,永久存档)原件一模一样纸张工艺/offer、雅思、外壳等材料/诚信可靠,可直接看成品样本,帮您解决无法毕业带来的各种难题!外壳,原版制作,诚信可靠,可直接看成品样本。行业标杆!精益求精,诚心合作,真诚制作!多年品质 ,按需精细制作,24小时接单,全套进口原装设备。十五年致力于帮助留学生解决难题,包您满意。
本公司拥有海外各大学样板无数,能完美还原。
1:1完美还原海外各大学毕业材料上的工艺:水印,阴影底纹,钢印LOGO烫金烫银,LOGO烫金烫银复合重叠。文字图案浮雕、激光镭射、紫外荧光、温感、复印防伪等防伪工艺。材料咨询办理、认证咨询办理请加学历顾问Q/微741003700
【主营项目】
一.毕业证【q微741003700】成绩单、使馆认证、教育部认证、雅思托福成绩单、学生卡等!
二.真实使馆公证(即留学回国人员证明,不成功不收费)
三.真实教育部学历学位认证(教育部存档!教育部留服网站永久可查)
四.办理各国各大学文凭(一对一专业服务,可全程监控跟踪进度)
如果您处于以下几种情况:
◇在校期间,因各种原因未能顺利毕业……拿不到官方毕业证【q/微741003700】
◇面对父母的压力,希望尽快拿到;
◇不清楚认证流程以及材料该如何准备;
◇回国时间很长,忘记办理;
◇回国马上就要找工作,办给用人单位看;
◇企事业单位必须要求办理的
◇需要报考公务员、购买免税车、落转户口
◇申请留学生创业基金
留信网认证的作用:
1:该专业认证可证明留学生真实身份
2:同时对留学生所学专业登记给予评定
3:国家专业人才认证中心颁发入库证书
4:这个认证书并且可以归档倒地方
5:凡事获得留信网入网的信息将会逐步更新到个人身份内,将在公安局网内查询个人身份证信息后,同步读取人才网入库信息
6:个人职称评审加20分
7:个人信誉贷款加10分
8:在国家人才网主办的国家网络招聘大会中纳入资料,供国家高端企业选择人才
More Related Content
More from Panayotis Sofianopoulos
a1090_2022.pdf
Α. 1090 /05-07-2022: Τροποποίηση της υπό στοιχεία Α.1138/12.6.2020 ΚΥΑ - Καθορισμός της έκτασης εφαρμογής, του χρόνου και της διαδικασίας ηλεκτρονικής διαβίβασης δεδομένων στην ΑΑΔΕ, καθώς και κάθε άλλου αναγκαίου θέματος για την εφαρμογή των διατάξεων του άρθρου 15Α του ν. 4174/2013 (ΚΦΔ)» και άλλες ρυθμίσεις.
e2042-22.pdf
Ε. 2042/10-5-22: Παροχή διευκρινίσεων σχετικά με τα πρόστιμα που αφορούν τις παραβάσεις έκδοσης πλαστών ή εικονικών φορολογικών στοιχείων ή λήψης εικονικών φορολογικών στοιχείων ή νόθευσης αυτών, καθώς και καταχώρισης στα βιβλία αγορών ή εξόδων που δεν έχουν πραγματοποιηθεί και για τα οποία δεν έχει εκδοθεί φορολογικό στοιχείο, κατόπιν έκδοσης της υπ'αρ. 2319/2021 Απόφασης του Συμβουλίου της Επικράτειας.
a1056_2022.pdf
A. 1056 /22: Τύπος και περιεχόμενο της δήλωσης ΕΝΦΙΑ - πράξης προσδιορισμού φόρου έτους 2022 και επομένων.
2152b-22-2-4.pdf
ΥΠΕΚΥΠ 40066/22 (ΦΕΚ 2152 Β/3-5-22): Ψηφιακή διαδικασία κανονισμού κύριων και επικουρικών συντάξεων λόγω γήρατος ή λόγω θανάτου, αρμοδιότητας της Γενικής Διεύθυνσης Συντάξεων Δημοσίου Τομέα, του e-ΕΦΚΑ.
e2040_2022.pdf
Ε. 2040 /20-04-2022: Οδηγίες για τη συμπλήρωση και την εκκαθάριση της δήλωσης φορολογίας εισοδήματος νομικών προσώπων και νομικών οντοτήτων φορολογικού έτους 2021
a1052_2022fek.pdf
Α. 1052 /20-04-2022: Τύπος και περιεχόμενο των δηλώσεων φορολογίας εισοδήματος φορολογικού έτους 2021 των νομικών προσώπων και νομικών οντοτήτων του άρθρου 45 του ν. 4172/2013 και καθορισμός δικαιολογητικών που υποβάλλονται μ’ αυτές - Υποβολή με τη χρήση ηλεκτρονικής μεθόδου επικοινωνίας των δηλώσεων φορολογίας εισοδήματος των νομικών προσώπων και νομικών οντοτήτων του άρθρου 45 του ν. 4172/2013.
1819b-22.pdf
ΚΥΑ, 35129/22 (ΦΕΚ 1819 Τεύχος Β/13.04.2022): Καθορισμός της διαδικασίας καταβολής του επιδόματος εορτών Πάσχα 2022 και ασφαλιστικών εισφορών εργαζομένων που καλύπτονται από τον κρατικό προϋπολογισμό.
e_2031_2022ada.pdf
Ε. 2031 /29-03-2022: Διευκρινίσεις για την εφαρμογή της περιπτ. ιστ΄της παρ. 1 του άρθρου 27 του Κώδικα ΦΠΑ περί απαλλαγής ΦΠΑ σε πράξεις που συνδέονται με δωρεές σε εκκλησιαστικά ΝΠΔΔ του άρθ. 1 παρ. 4 του ν.590/1977 και σε εποπτευόμενα από τα πρόσωπα αυτά εκκλησιαστικά ΝΠΙΔ.
aade 010422.pdf
Πληροφορίες που έχει στη διάθεσή της η ΑΑΔΕ και αφορούν στη δήλωσή σας φορολογικού έτους 2021
65a-22.pdf
Ν. 4916/22 (ΦΕΚ 65 Α/28-3-22): Εκσυγχρονισμός του πλαισίου λειτουργίας της Επιτροπής Κεφαλαιαγοράς - Πρόγραμμα συνεισφοράς Δημοσίου σε ευάλωτους οφειλέτες μέχρι τη μεταβίβαση της κατοικίας τους στον φορέα απόκτησης και επαναμίσθωσης του κεφαλαίου Α’ του μέρους δευτέρου του τρίτου βιβλίου του ν. 4738/2020 - Ενσωμάτωση στην ελληνική νομοθεσία των Οδηγιών (ΕΕ) 2020/1151 και (ΕΕ) 2021/1159, νέος μειωμένος ΕΝΦΙΑ, επείγουσες φορολογικές και τελωνειακές ρυθμίσεις για την αντιμετώπιση ιδίως της ενεργειακής κρίσης και άλλες διατάξεις
e2026_2022.pdf
Ε. 2026 /18-03-2022: Νέοι αριθμοί φορολογικού μητρώου ΦΠΑ υποκείμενων στον φόρο εγγεγραμμένων στη Βουλγαρία.
E 2025 2022ada
E. 2025 /17-03-2022: Οδηγίες συμπλήρωσης εντύπου Ε3 (Κατάσταση Οικονομικών Στοιχείων από Επιχειρηματική Δραστηριότητα) και Κατάστασης Φορολογικής Αναμόρφωσης φορολογικού έτους 2021.
A1034 2022 fek
A. 1034 /09-03-2022: Τύπος και περιεχόμενο της δήλωσης φορολογίας εισοδήματος φυσικών προσώπων φορολογικού έτους 2021, των λοιπών εντύπων και των δικαιολογητικών εγγράφων που συνυποβάλλονται με αυτή. Τύπος και περιεχόμενο της πράξης διοικητικού/διορθωτικού προσδιορισμού φόρου φορολογικών ετών 2021 και εφεξής για φορολογούμενους που έχουν υπαχθεί στις διατάξεις του άρθρου 5Β του ν. 4172/2013 (Α’ 167).
E 2023 2022ada
Ε. 2023 /22: Παροχή διευκρινίσεων για τη φορολογική μεταχείριση κρασιών μικρών οινοπαραγωγών.
Egkiklios 8 asfalistikis ikanotitas 2022
ΕΦΚΑ – Τι ισχύει για την Χορήγηση - Παράταση Ασφαλιστικής Ικανότητας για το ασφαλιστικό έτος 2022
E2022 22
E. 2022 /25-02-2022: Κοινοποίηση της υπ’ αριθμ. 165/2021 γνωμοδότησης του Νομικού Συμβουλίου του Κράτους για το εάν οι διατάξεις της παρ.6 του άρθρου 64 του ν.4172/2013 (Α' 167) καταλαμβάνουν το εισόδημα που αποκτούν τα πιστωτικά ιδρύματα από τόκους ομολογιακών δανείων που έχουν εκδοθεί από ανώνυμες εταιρείες, σύμφωνα με τις διατάξεις του άρθρου 59 του ν.4548/2018 (Α' 104).
A 1027 2022ada
A. 1027 /22: Παράταση της προθεσμίας υποβολής στοιχείων και πληροφοριών της ΠΟΛ 1033/14, τα οποία διαβιβάζονται στην ΑΑΔΕ από πιστωτικά και χρηματοδοτικά ιδρύματα και ιδιωτικά εκπαιδευτήρια...
A 1025 2022ada
Α. 1025 /15-02-2022: Επικαιροποίηση στη ψηφιακή πύλη myAADE των στοιχείων επικοινωνίας των πιστοποιημένων χρηστών των ηλεκτρονικών υπηρεσιών της Ανεξάρτητης Αρχής Δημοσίων Εσόδων.
More from Panayotis Sofianopoulos (20)
Recently uploaded
Does teamwork really matter? Looking beyond the job posting to understand lab...
Does teamwork really matter? Looking beyond the job posting to understand lab...Labour Market Information Council | Conseil de l’information sur le marché du travail
Vicinity Jobs’ data includes more than three million 2023 OJPs and thousands of skills. Most skills appear in less than 0.02% of job postings, so most postings rely on a small subset of commonly used terms, like teamwork.
Laura Adkins-Hackett, Economist, LMIC, and Sukriti Trehan, Data Scientist, LMIC, presented their research exploring trends in the skills listed in OJPs to develop a deeper understanding of in-demand skills. This research project uses pointwise mutual information and other methods to extract more information about common skills from the relationships between skills, occupations and regions.在线办理(UMASS毕业证书)马萨诸塞大学阿默斯特分校毕业证完成信一模一样
学校原件一模一样【微信:741003700 】《(UMASS毕业证书)马萨诸塞大学阿默斯特分校毕业证》【微信:741003700 】学位证,留信认证(真实可查,永久存档)原件一模一样纸张工艺/offer、雅思、外壳等材料/诚信可靠,可直接看成品样本,帮您解决无法毕业带来的各种难题!外壳,原版制作,诚信可靠,可直接看成品样本。行业标杆!精益求精,诚心合作,真诚制作!多年品质 ,按需精细制作,24小时接单,全套进口原装设备。十五年致力于帮助留学生解决难题,包您满意。
本公司拥有海外各大学样板无数,能完美还原。
1:1完美还原海外各大学毕业材料上的工艺:水印,阴影底纹,钢印LOGO烫金烫银,LOGO烫金烫银复合重叠。文字图案浮雕、激光镭射、紫外荧光、温感、复印防伪等防伪工艺。材料咨询办理、认证咨询办理请加学历顾问Q/微741003700
【主营项目】
一.毕业证【q微741003700】成绩单、使馆认证、教育部认证、雅思托福成绩单、学生卡等!
二.真实使馆公证(即留学回国人员证明,不成功不收费)
三.真实教育部学历学位认证(教育部存档!教育部留服网站永久可查)
四.办理各国各大学文凭(一对一专业服务,可全程监控跟踪进度)
如果您处于以下几种情况:
◇在校期间,因各种原因未能顺利毕业……拿不到官方毕业证【q/微741003700】
◇面对父母的压力,希望尽快拿到;
◇不清楚认证流程以及材料该如何准备;
◇回国时间很长,忘记办理;
◇回国马上就要找工作,办给用人单位看;
◇企事业单位必须要求办理的
◇需要报考公务员、购买免税车、落转户口
◇申请留学生创业基金
留信网认证的作用:
1:该专业认证可证明留学生真实身份
2:同时对留学生所学专业登记给予评定
3:国家专业人才认证中心颁发入库证书
4:这个认证书并且可以归档倒地方
5:凡事获得留信网入网的信息将会逐步更新到个人身份内,将在公安局网内查询个人身份证信息后,同步读取人才网入库信息
6:个人职称评审加20分
7:个人信誉贷款加10分
8:在国家人才网主办的国家网络招聘大会中纳入资料,供国家高端企业选择人才
真实可查(nwu毕业证书)美国西北大学毕业证学位证书范本原版一模一样
原版定制【微信:bwp0011】《(nwu毕业证书)美国西北大学毕业证学位证书》【微信:bwp0011】成绩单 、雅思、外壳、留信学历认证永久存档查询,采用学校原版纸张、特殊工艺完全按照原版一比一制作(包括:隐形水印,阴影底纹,钢印LOGO烫金烫银,LOGO烫金烫银复合重叠,文字图案浮雕,激光镭射,紫外荧光,温感,复印防伪)行业标杆!精益求精,诚心合作,真诚制作!多年品质 ,按需精细制作,24小时接单,全套进口原装设备,十五年致力于帮助留学生解决难题,业务范围有加拿大、英国、澳洲、韩国、美国、新加坡,新西兰等学历材料,包您满意。
【业务选择办理准则】
一、工作未确定,回国需先给父母、亲戚朋友看下文凭的情况,办理一份就读学校的毕业证【微信bwp0011】文凭即可
二、回国进私企、外企、自己做生意的情况,这些单位是不查询毕业证真伪的,而且国内没有渠道去查询国外文凭的真假,也不需要提供真实教育部认证。鉴于此,办理一份毕业证【微信bwp0011】即可
三、进国企,银行,事业单位,考公务员等等,这些单位是必需要提供真实教育部认证的,办理教育部认证所需资料众多且烦琐,所有材料您都必须提供原件,我们凭借丰富的经验,快捷的绿色通道帮您快速整合材料,让您少走弯路。
留信网认证的作用:
1:该专业认证可证明留学生真实身份
2:同时对留学生所学专业登记给予评定
3:国家专业人才认证中心颁发入库证书
4:这个认证书并且可以归档倒地方
5:凡事获得留信网入网的信息将会逐步更新到个人身份内,将在公安局网内查询个人身份证信息后,同步读取人才网入库信息
6:个人职称评审加20分
7:个人信誉贷款加10分
8:在国家人才网主办的国家网络招聘大会中纳入资料,供国家高端企业选择人才
【关于价格问题(保证一手价格)】
我们所定的价格是非常合理的,而且我们现在做得单子大多数都是代理和回头客户介绍的所以一般现在有新的单子 我给客户的都是第一手的代理价格,因为我想坦诚对待大家 不想跟大家在价格方面浪费时间
对于老客户或者被老客户介绍过来的朋友,我们都会适当给一些优惠。
The Impact of Generative AI and 4th Industrial Revolution
This infographic explores the transformative power of Generative AI, a key driver of the 4th Industrial Revolution. Discover how Generative AI is revolutionizing industries, accelerating innovation, and shaping the future of work.
做澳洲澳大利亚国立大学毕业证荣誉学位证书原版一模一样
原版一模一样【微信:741003700 】【澳洲澳大利亚国立大学毕业证荣誉学位证书】【微信:741003700 】学位证,留信认证(真实可查,永久存档)offer、雅思、外壳等材料/诚信可靠,可直接看成品样本,帮您解决无法毕业带来的各种难题!外壳,原版制作,诚信可靠,可直接看成品样本。行业标杆!精益求精,诚心合作,真诚制作!多年品质 ,按需精细制作,24小时接单,全套进口原装设备。十五年致力于帮助留学生解决难题,包您满意。
本公司拥有海外各大学样板无数,能完美还原海外各大学 Bachelor Diploma degree, Master Degree Diploma
1:1完美还原海外各大学毕业材料上的工艺:水印,阴影底纹,钢印LOGO烫金烫银,LOGO烫金烫银复合重叠。文字图案浮雕、激光镭射、紫外荧光、温感、复印防伪等防伪工艺。材料咨询办理、认证咨询办理请加学历顾问Q/微741003700
留信网认证的作用:
1:该专业认证可证明留学生真实身份
2:同时对留学生所学专业登记给予评定
3:国家专业人才认证中心颁发入库证书
4:这个认证书并且可以归档倒地方
5:凡事获得留信网入网的信息将会逐步更新到个人身份内,将在公安局网内查询个人身份证信息后,同步读取人才网入库信息
6:个人职称评审加20分
7:个人信誉贷款加10分
8:在国家人才网主办的国家网络招聘大会中纳入资料,供国家高端企业选择人才
Discover the Future of Dogecoin with Our Comprehensive Guidance
Learn in-depth about Dogecoin's trajectory and stay informed with 36crypto's essential and up-to-date information about the crypto space.
Our presentation delves into Dogecoin's potential future, exploring whether it's destined to skyrocket to the moon or face a downward spiral. In addition, it highlights invaluable insights. Don't miss out on this opportunity to enhance your crypto understanding!
https://36crypto.com/the-future-of-dogecoin-how-high-can-this-cryptocurrency-reach/
1比1复刻(ksu毕业证书)美国堪萨斯州立大学毕业证本科文凭证书原版一模一样
原版定制【微信:bwp0011】《(ksu毕业证书)美国堪萨斯州立大学毕业证本科文凭证书》【微信:bwp0011】成绩单 、雅思、外壳、留信学历认证永久存档查询,采用学校原版纸张、特殊工艺完全按照原版一比一制作(包括:隐形水印,阴影底纹,钢印LOGO烫金烫银,LOGO烫金烫银复合重叠,文字图案浮雕,激光镭射,紫外荧光,温感,复印防伪)行业标杆!精益求精,诚心合作,真诚制作!多年品质 ,按需精细制作,24小时接单,全套进口原装设备,十五年致力于帮助留学生解决难题,业务范围有加拿大、英国、澳洲、韩国、美国、新加坡,新西兰等学历材料,包您满意。
【业务选择办理准则】
一、工作未确定,回国需先给父母、亲戚朋友看下文凭的情况,办理一份就读学校的毕业证【微信bwp0011】文凭即可
二、回国进私企、外企、自己做生意的情况,这些单位是不查询毕业证真伪的,而且国内没有渠道去查询国外文凭的真假,也不需要提供真实教育部认证。鉴于此,办理一份毕业证【微信bwp0011】即可
三、进国企,银行,事业单位,考公务员等等,这些单位是必需要提供真实教育部认证的,办理教育部认证所需资料众多且烦琐,所有材料您都必须提供原件,我们凭借丰富的经验,快捷的绿色通道帮您快速整合材料,让您少走弯路。
留信网认证的作用:
1:该专业认证可证明留学生真实身份
2:同时对留学生所学专业登记给予评定
3:国家专业人才认证中心颁发入库证书
4:这个认证书并且可以归档倒地方
5:凡事获得留信网入网的信息将会逐步更新到个人身份内,将在公安局网内查询个人身份证信息后,同步读取人才网入库信息
6:个人职称评审加20分
7:个人信誉贷款加10分
8:在国家人才网主办的国家网络招聘大会中纳入资料,供国家高端企业选择人才
【关于价格问题(保证一手价格)】
我们所定的价格是非常合理的,而且我们现在做得单子大多数都是代理和回头客户介绍的所以一般现在有新的单子 我给客户的都是第一手的代理价格,因为我想坦诚对待大家 不想跟大家在价格方面浪费时间
对于老客户或者被老客户介绍过来的朋友,我们都会适当给一些优惠。
Governor Olli Rehn: Inflation down and recovery supported by interest rate cu...
Governor Olli Rehn
Bank of Finland
Press conference on the outlook for the Finnish economy
Helsinki, 11 June 2024
一比一原版美国新罕布什尔大学(unh)毕业证学历认证真实可查
永久可查学历认证【微信:A575476】【美国新罕布什尔大学(unh)毕业证成绩单Offer】【微信:A575476】(留信学历认证永久存档查询)采用学校原版纸张、特殊工艺完全按照原版一比一制作(包括:隐形水印,阴影底纹,钢印LOGO烫金烫银,LOGO烫金烫银复合重叠,文字图案浮雕,激光镭射,紫外荧光,温感,复印防伪)行业标杆!精益求精,诚心合作,真诚制作!多年品质 ,按需精细制作,24小时接单,全套进口原装设备,十五年致力于帮助留学生解决难题,业务范围有加拿大、英国、澳洲、韩国、美国、新加坡,新西兰等学历材料,包您满意。
【业务选择办理准则】
一、工作未确定,回国需先给父母、亲戚朋友看下文凭的情况,办理一份就读学校的毕业证【微信:A575476】文凭即可
二、回国进私企、外企、自己做生意的情况,这些单位是不查询毕业证真伪的,而且国内没有渠道去查询国外文凭的真假,也不需要提供真实教育部认证。鉴于此,办理一份毕业证【微信:A575476】即可
三、进国企,银行,事业单位,考公务员等等,这些单位是必需要提供真实教育部认证的,办理教育部认证所需资料众多且烦琐,所有材料您都必须提供原件,我们凭借丰富的经验,快捷的绿色通道帮您快速整合材料,让您少走弯路。
留信网认证的作用:
1:该专业认证可证明留学生真实身份
2:同时对留学生所学专业登记给予评定
3:国家专业人才认证中心颁发入库证书
4:这个认证书并且可以归档倒地方
5:凡事获得留信网入网的信息将会逐步更新到个人身份内,将在公安局网内查询个人身份证信息后,同步读取人才网入库信息
6:个人职称评审加20分
7:个人信誉贷款加10分
8:在国家人才网主办的国家网络招聘大会中纳入资料,供国家高端企业选择人才
→ 【关于价格问题(保证一手价格)
我们所定的价格是非常合理的,而且我们现在做得单子大多数都是代理和回头客户介绍的所以一般现在有新的单子 我给客户的都是第一手的代理价格,因为我想坦诚对待大家 不想跟大家在价格方面浪费时间
对于老客户或者被老客户介绍过来的朋友,我们都会适当给一些优惠。
选择实体注册公司办理,更放心,更安全!我们的承诺:可来公司面谈,可签订合同,会陪同客户一起到教育部认证窗口递交认证材料,客户在教育部官方认证查询网站查询到认证通过结果后付款,不成功不收费!
Bridging the gap: Online job postings, survey data and the assessment of job ...
Bridging the gap: Online job postings, survey data and the assessment of job ...Labour Market Information Council | Conseil de l’information sur le marché du travail
OJP data from firms like Vicinity Jobs have emerged as a complement to traditional sources of labour demand data, such as the Job Vacancy and Wages Survey (JVWS). Ibrahim Abuallail, PhD Candidate, University of Ottawa, presented research relating to bias in OJPs and a proposed approach to effectively adjust OJP data to complement existing official data (such as from the JVWS) and improve the measurement of labour demand.Optimizing Net Interest Margin (NIM) in the Financial Sector (With Examples).pdf
NIM is calculated as the difference between interest income earned and interest expenses paid, divided by interest-earning assets.
Importance: NIM serves as a critical measure of a financial institution's profitability and operational efficiency. It reflects how effectively the institution is utilizing its interest-earning assets to generate income while managing interest costs.
Tdasx: In-Depth Analysis of Cryptocurrency Giveaway Scams and Security Strate...
Tdasx: In-Depth Analysis of Cryptocurrency Giveaway Scams and Security Strategies
一比一原版(RMIT毕业证)皇家墨尔本理工大学毕业证如何办理
RMIT硕士学位证成绩单【微信95270640】《皇家墨尔本理工大学毕业证书》《QQ微信95270640》学位证书电子版:在线制作皇家墨尔本理工大学毕业证成绩单GPA修改(制作RMIT毕业证成绩单RMIT文凭证书样本)、皇家墨尔本理工大学毕业证书与成绩单样本图片、《RMIT学历证书学位证书》、皇家墨尔本理工大学毕业证案例毕业证书制作軟體、在线制作加拿大硕士学历证书真实可查.
【本科硕士】皇家墨尔本理工大学皇家墨尔本理工大学本科学位证成绩单(GPA修改);学历认证(教育部认证);大学Offer录取通知书留信认证使馆认证;雅思语言证书等高仿类证书。
办理流程:
1客户提供办理皇家墨尔本理工大学皇家墨尔本理工大学本科学位证成绩单信息:姓名生日专业学位毕业时间等(如信息不确定可以咨询顾问:我们有专业老师帮你查询);
2开始安排制作毕业证成绩单电子图;
3毕业证成绩单电子版做好以后发送给您确认;
4毕业证成绩单电子版您确认信息无误之后安排制作成品;
5成品做好拍照或者视频给您确认;
6快递给客户(国内顺丰国外DHLUPS等快读邮寄)
真实网上可查的证明材料
1教育部学历学位认证留服官网真实存档可查永久存档。
2留学回国人员证明(使馆认证)使馆网站真实存档可查。
我们对海外大学及学院的毕业证成绩单所使用的材料尺寸大小防伪结构(包括:皇家墨尔本理工大学皇家墨尔本理工大学本科学位证成绩单隐形水印阴影底纹钢印LOGO烫金烫银LOGO烫金烫银复合重叠。文字图案浮雕激光镭射紫外荧光温感复印防伪)都有原版本文凭对照。质量得到了广大海外客户群体的认可同时和海外学校留学中介做到与时俱进及时掌握各大院校的(毕业证成绩单资格证结业证录取通知书在读证明等相关材料)的版本更新信息能够在第一时间掌握最新的海外学历文凭的样版尺寸大小纸张材质防伪技术等等并在第一时间收集到原版实物以求达到客户的需求。
本公司还可以按照客户原版印刷制作且能够达到客户理想的要求。有需要办理证件的客户请联系我们在线客服中心微信:95270640 或咨询在线父亲的家很狭小除了一张单人床和一张小方桌几乎没有多余的空间山娃一下子就联想起学校的男小便处山娃很想笑却怎么也笑不出来山娃很迷惑父亲的家除了一扇小铁门连窗户也没有墓穴一般阴森森有些骇人父亲的城也便成了山娃的城父亲的家也便成了山娃的家父亲让山娃呆在屋里做作业看电视最多只能在门口透透气不能跟陌生人搭腔更不能乱跑一怕迷路二怕拐子拐人山娃很惊惧去年村里的田鸡就因为跟父亲进城一不小心被人拐跑了至今不见踪影害不
1:1制作加拿大麦吉尔大学毕业证硕士学历证书原版一模一样
原版一模一样【微信:741003700 】【加拿大麦吉尔大学毕业证硕士学历证书】【微信:741003700 】学位证,留信认证(真实可查,永久存档)offer、雅思、外壳等材料/诚信可靠,可直接看成品样本,帮您解决无法毕业带来的各种难题!外壳,原版制作,诚信可靠,可直接看成品样本。行业标杆!精益求精,诚心合作,真诚制作!多年品质 ,按需精细制作,24小时接单,全套进口原装设备。十五年致力于帮助留学生解决难题,包您满意。
本公司拥有海外各大学样板无数,能完美还原海外各大学 Bachelor Diploma degree, Master Degree Diploma
1:1完美还原海外各大学毕业材料上的工艺:水印,阴影底纹,钢印LOGO烫金烫银,LOGO烫金烫银复合重叠。文字图案浮雕、激光镭射、紫外荧光、温感、复印防伪等防伪工艺。材料咨询办理、认证咨询办理请加学历顾问Q/微741003700
留信网认证的作用:
1:该专业认证可证明留学生真实身份
2:同时对留学生所学专业登记给予评定
3:国家专业人才认证中心颁发入库证书
4:这个认证书并且可以归档倒地方
5:凡事获得留信网入网的信息将会逐步更新到个人身份内,将在公安局网内查询个人身份证信息后,同步读取人才网入库信息
6:个人职称评审加20分
7:个人信誉贷款加10分
8:在国家人才网主办的国家网络招聘大会中纳入资料,供国家高端企业选择人才
TEST BANK Principles of cost accounting 17th edition edward j vanderbeck mari...
TEST BANK Principles of cost accounting 17th edition edward j vanderbeck maria r mitchell.docx
TEST BANK Principles of cost accounting 17th edition edward j vanderbeck maria r mitchell.docx
TEST BANK Principles of cost accounting 17th edition edward j vanderbeck maria r mitchell.docx
OAT_RI_Ep20 WeighingTheRisks_May24_Trade Wars.pptx
How will new technology fields affect economic trade?
Dr. Alyce Su Cover Story - China's Investment Leader
In World Expo 2010 Shanghai – the most visited Expo in the World History
https://www.britannica.com/event/Expo-Shanghai-2010
China’s official organizer of the Expo, CCPIT (China Council for the Promotion of International Trade https://en.ccpit.org/) has chosen Dr. Alyce Su as the Cover Person with Cover Story, in the Expo’s official magazine distributed throughout the Expo, showcasing China’s New Generation of Leaders to the World.
快速制作美国迈阿密大学牛津分校毕业证文凭证书英文原版一模一样
原版一模一样【微信:741003700 】【美国迈阿密大学牛津分校毕业证文凭证书】【微信:741003700 】学位证,留信认证(真实可查,永久存档)offer、雅思、外壳等材料/诚信可靠,可直接看成品样本,帮您解决无法毕业带来的各种难题!外壳,原版制作,诚信可靠,可直接看成品样本。行业标杆!精益求精,诚心合作,真诚制作!多年品质 ,按需精细制作,24小时接单,全套进口原装设备。十五年致力于帮助留学生解决难题,包您满意。
本公司拥有海外各大学样板无数,能完美还原海外各大学 Bachelor Diploma degree, Master Degree Diploma
1:1完美还原海外各大学毕业材料上的工艺:水印,阴影底纹,钢印LOGO烫金烫银,LOGO烫金烫银复合重叠。文字图案浮雕、激光镭射、紫外荧光、温感、复印防伪等防伪工艺。材料咨询办理、认证咨询办理请加学历顾问Q/微741003700
留信网认证的作用:
1:该专业认证可证明留学生真实身份
2:同时对留学生所学专业登记给予评定
3:国家专业人才认证中心颁发入库证书
4:这个认证书并且可以归档倒地方
5:凡事获得留信网入网的信息将会逐步更新到个人身份内,将在公安局网内查询个人身份证信息后,同步读取人才网入库信息
6:个人职称评审加20分
7:个人信誉贷款加10分
8:在国家人才网主办的国家网络招聘大会中纳入资料,供国家高端企业选择人才
Recently uploaded (20)
Does teamwork really matter? Looking beyond the job posting to understand lab...
Does teamwork really matter? Looking beyond the job posting to understand lab...
The Impact of Generative AI and 4th Industrial Revolution
The Impact of Generative AI and 4th Industrial Revolution
Discover the Future of Dogecoin with Our Comprehensive Guidance
Discover the Future of Dogecoin with Our Comprehensive Guidance
Governor Olli Rehn: Inflation down and recovery supported by interest rate cu...
Governor Olli Rehn: Inflation down and recovery supported by interest rate cu...
Bridging the gap: Online job postings, survey data and the assessment of job ...
Bridging the gap: Online job postings, survey data and the assessment of job ...
Optimizing Net Interest Margin (NIM) in the Financial Sector (With Examples).pdf
Optimizing Net Interest Margin (NIM) in the Financial Sector (With Examples).pdf
Tdasx: In-Depth Analysis of Cryptocurrency Giveaway Scams and Security Strate...
Tdasx: In-Depth Analysis of Cryptocurrency Giveaway Scams and Security Strate...
Upanishads summary with explanations of each upnishad
Upanishads summary with explanations of each upnishad
TEST BANK Principles of cost accounting 17th edition edward j vanderbeck mari...
TEST BANK Principles of cost accounting 17th edition edward j vanderbeck mari...
OAT_RI_Ep20 WeighingTheRisks_May24_Trade Wars.pptx
OAT_RI_Ep20 WeighingTheRisks_May24_Trade Wars.pptx
Dr. Alyce Su Cover Story - China's Investment Leader
Dr. Alyce Su Cover Story - China's Investment Leader
Stock yo-yo
- 1. 50+ YEARS 1950–2016 Up Days % 53.6% Down Days % 46.4% DECADES 1960s 1970s 1980s 1990s 2000s 2010s Up Days % 54.2% 51.3% 53.0% 53.7% 52.3% 54.2% Down Days % 45.8% 48.7% 47.0% 46.3% 47.7% 45.8% SECULAR BEAR BULL 1966–1982 1983–1999 Up Days % 51.1% 54.0% Down Days % 48.9% 46.0% RECENT 2011 2012 2013 2014 2015 2016 Up Days % 54.8% 52.8% 58.3% 57.1% 47.2% 52.0% Down Days % 45.2% 47.2% 41.7% 42.9% 52.8% 48.0% PERCENTAGE POSITIVE AND NEGATIVE DAYS ACROSS VARIOUS PERIODS: S&P 500 INDEX (The Stock Market Tends To Have Relatively Near 50% Up Days & Down Days Across Various Periods) Copyright 2004-2017, Crestmont Research (www.CrestmontResearch.com) 54.2% 51.3% 53.0% 53.7% 52.3% 54.2% 45.8% 48.7% 47.0% 46.3% 47.7% 45.8% 40% 42% 44% 46% 48% 50% 52% 54% 56% 58% 60% 1960s 1970s 1980s 1990s 2000s 2010s DECADES: 1950s - 2000s Up Days % Down Days % 54.8% 52.8% 58.3% 57.1% 47.2% 52.0% 45.2% 47.2% 41.7% 42.9% 52.8% 48.0% 40% 42% 44% 46% 48% 50% 52% 54% 56% 58% 60% 2011 2012 2013 2014 2015 2016 RECENT YEARS: 2011 - 2016 Up Days % Down Days % 53.6% 51.1% 54.0% 46.4% 48.9% 46.0% 40% 42% 44% 46% 48% 50% 52% 54% 56% 58% 60% 1950–2016 BEAR: 1966–1982 BULL: 1983–1999 50+ YEARS: 1950-2016 AND RECENT SECULAR BEAR & SECULAR BULL Up Days % Down Days %