Download to read offline
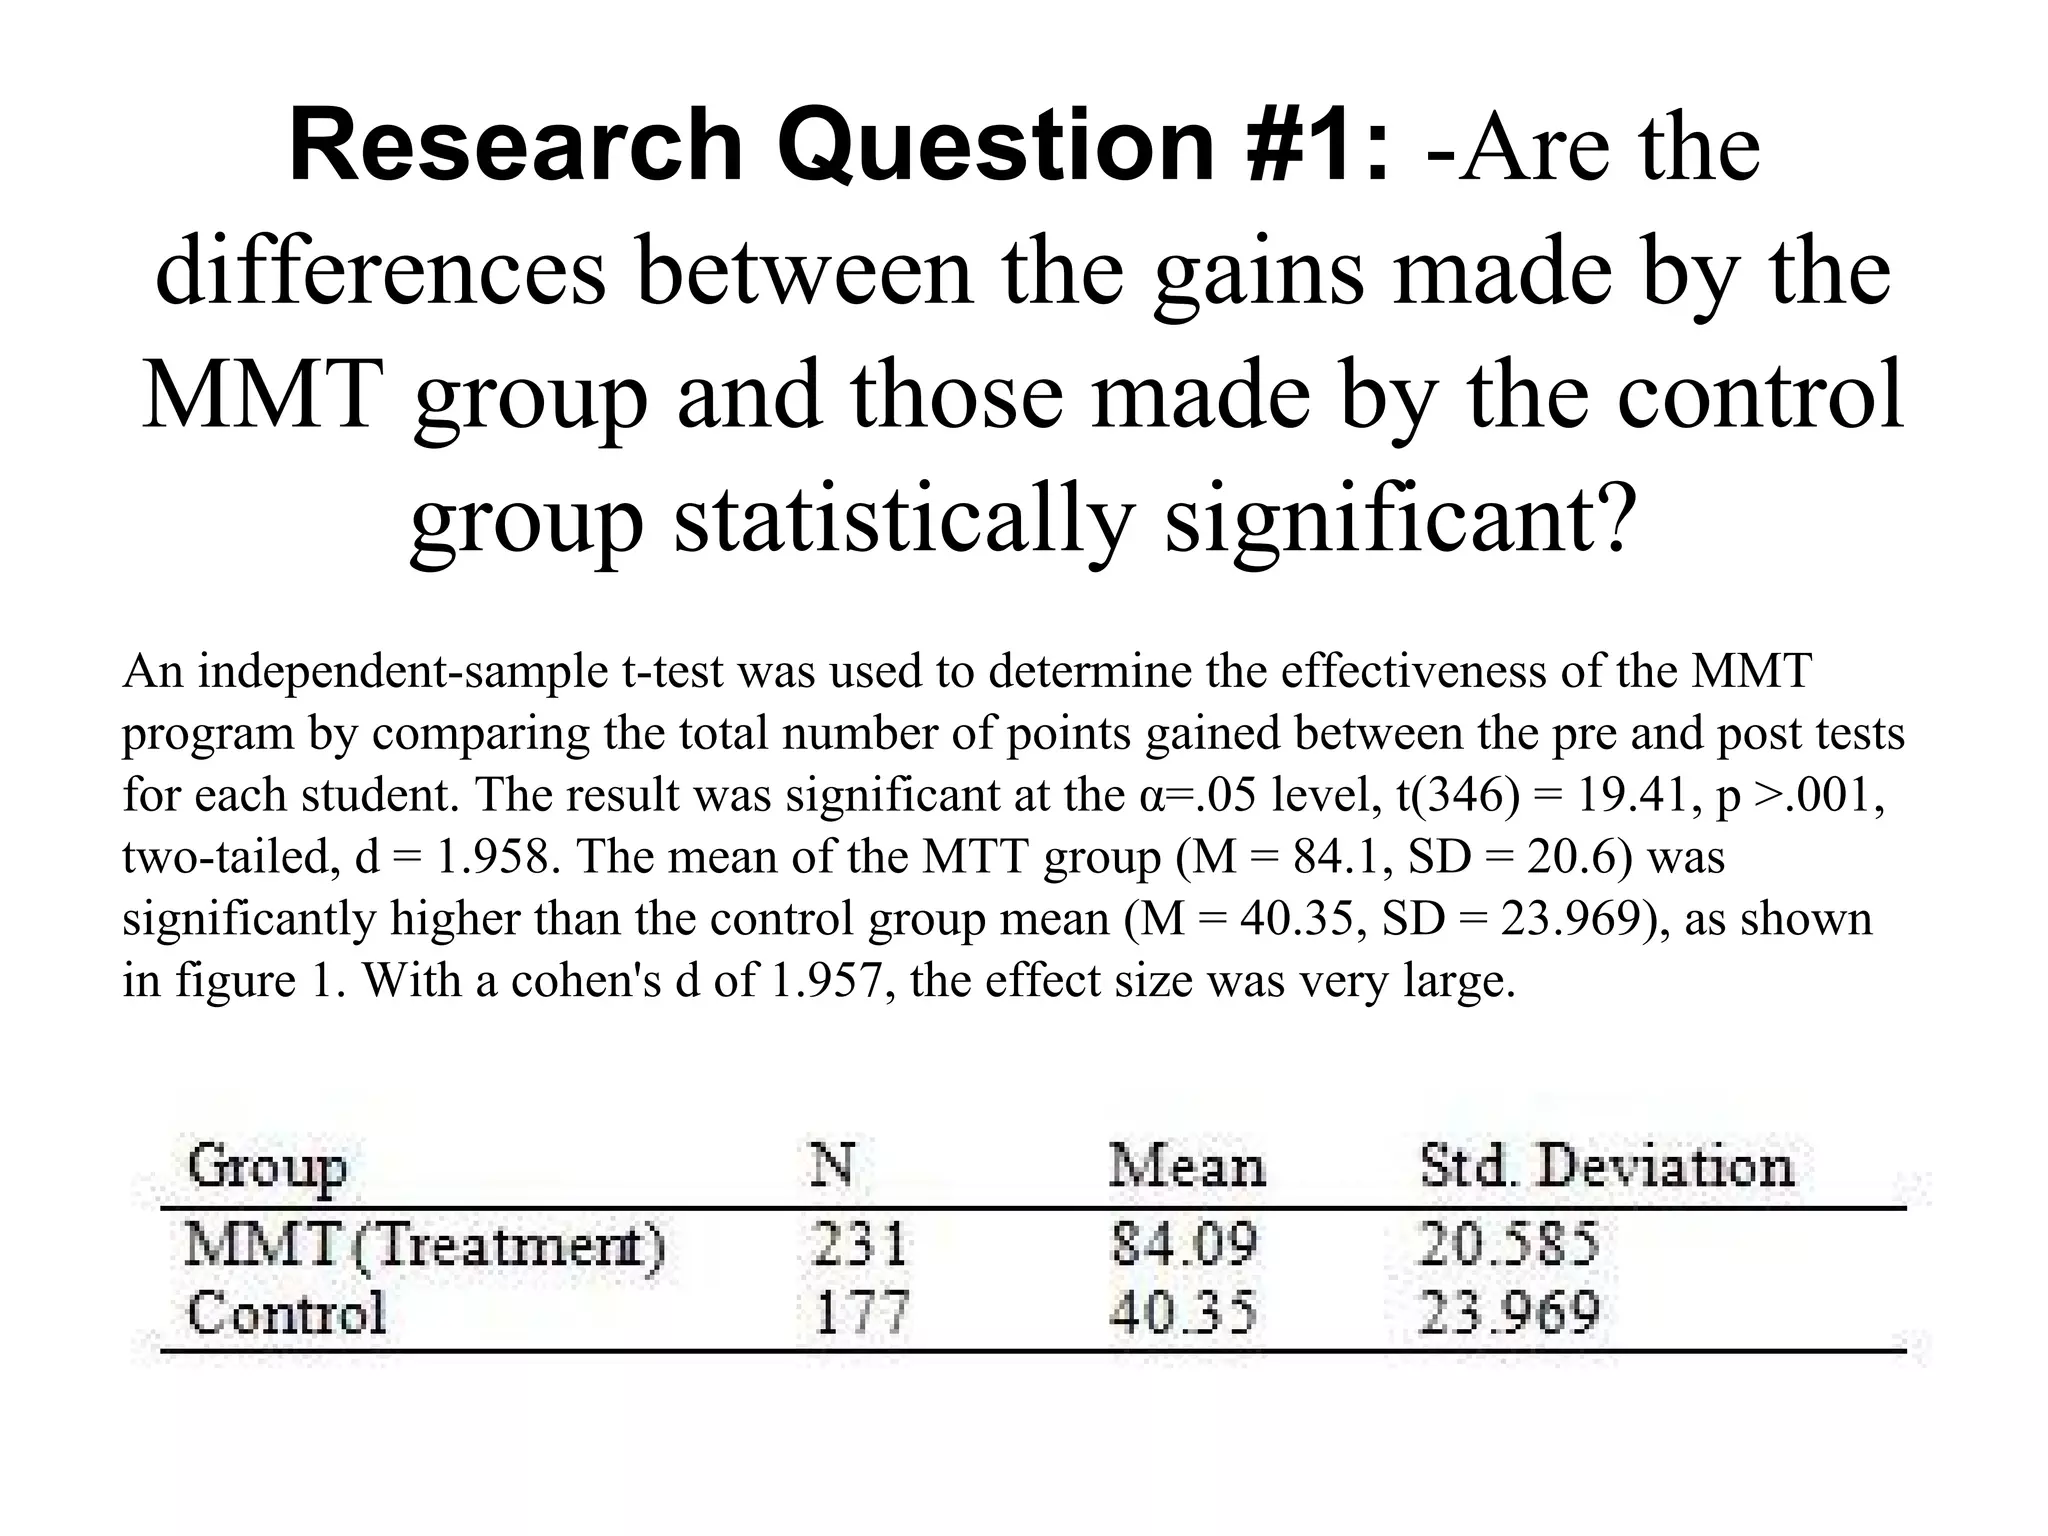
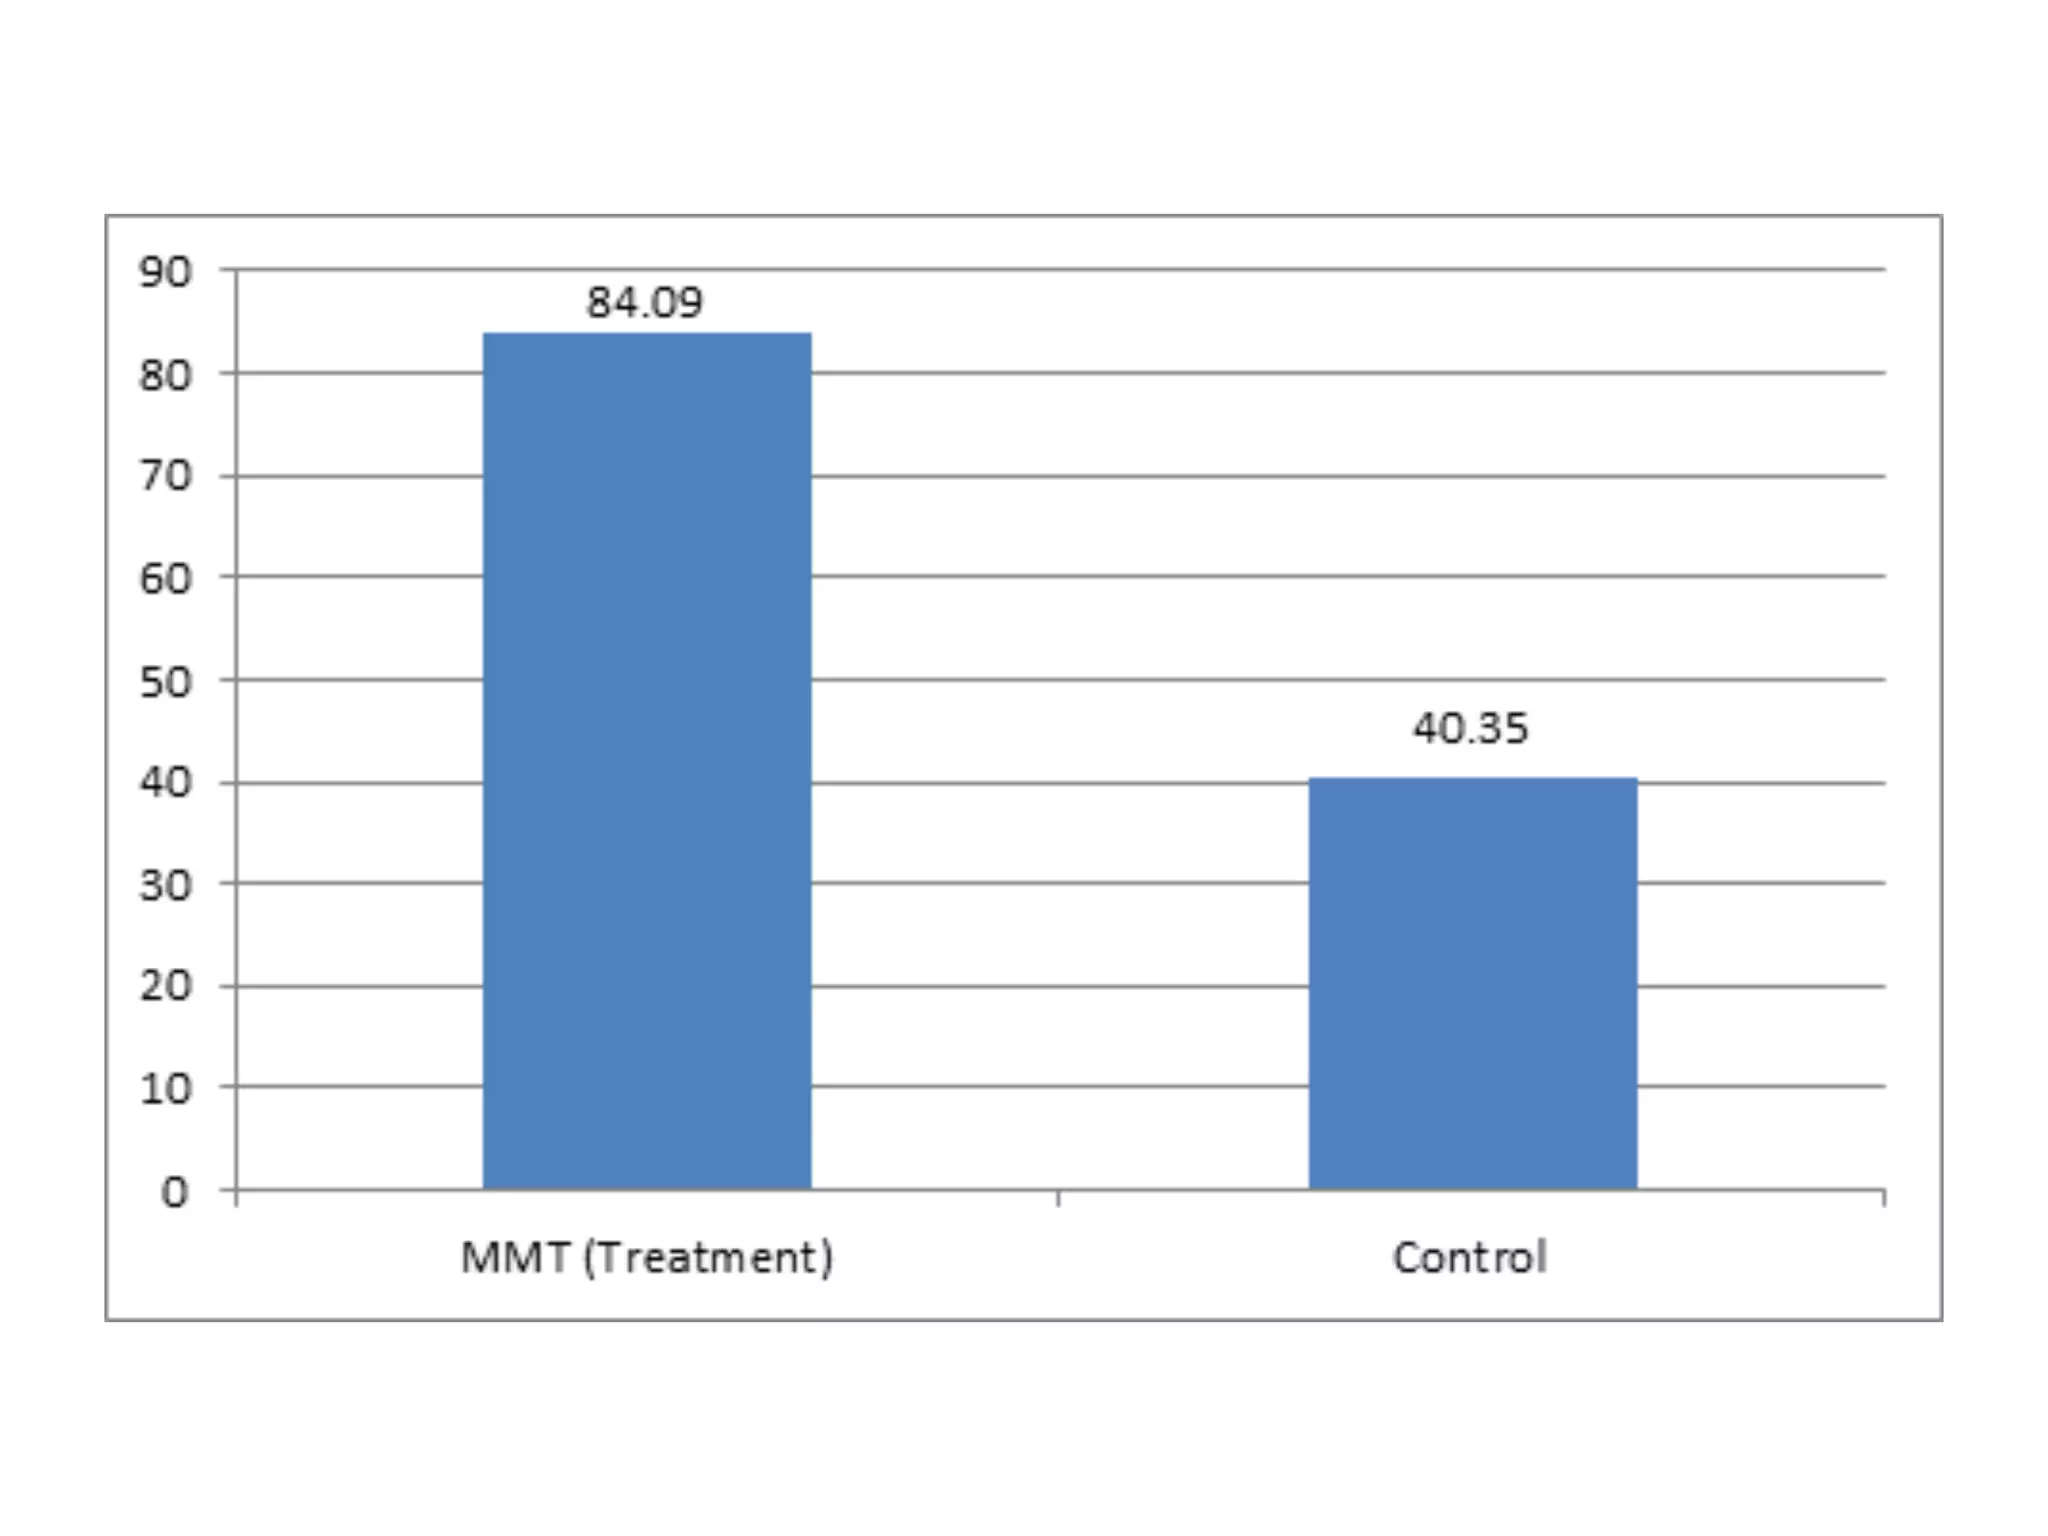
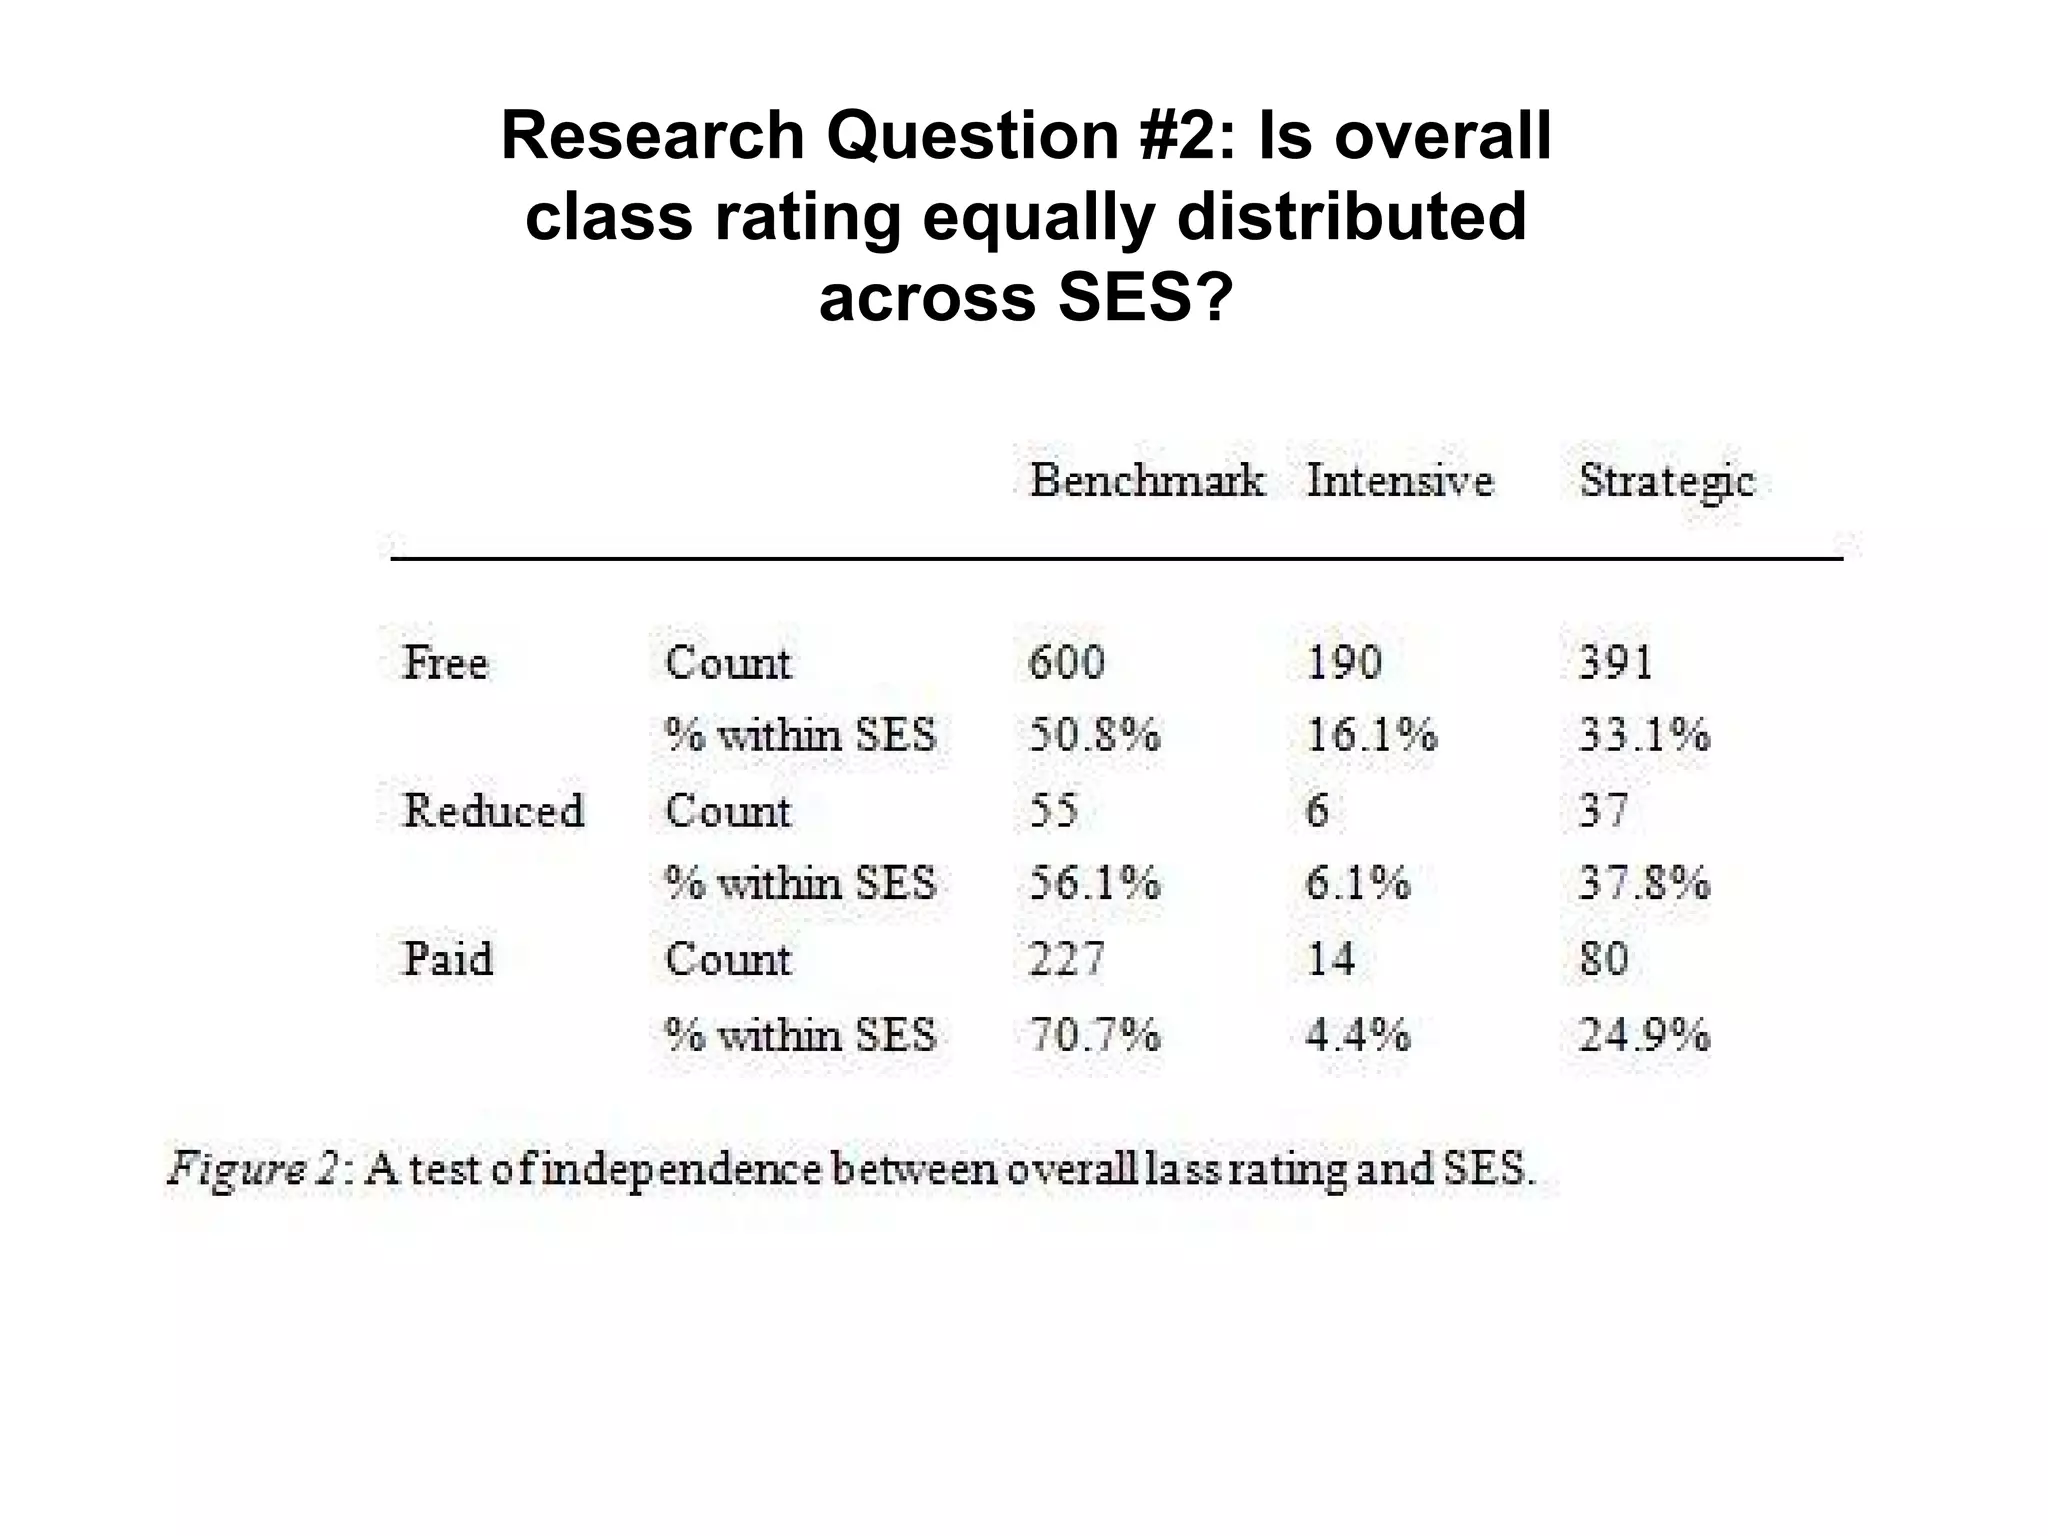
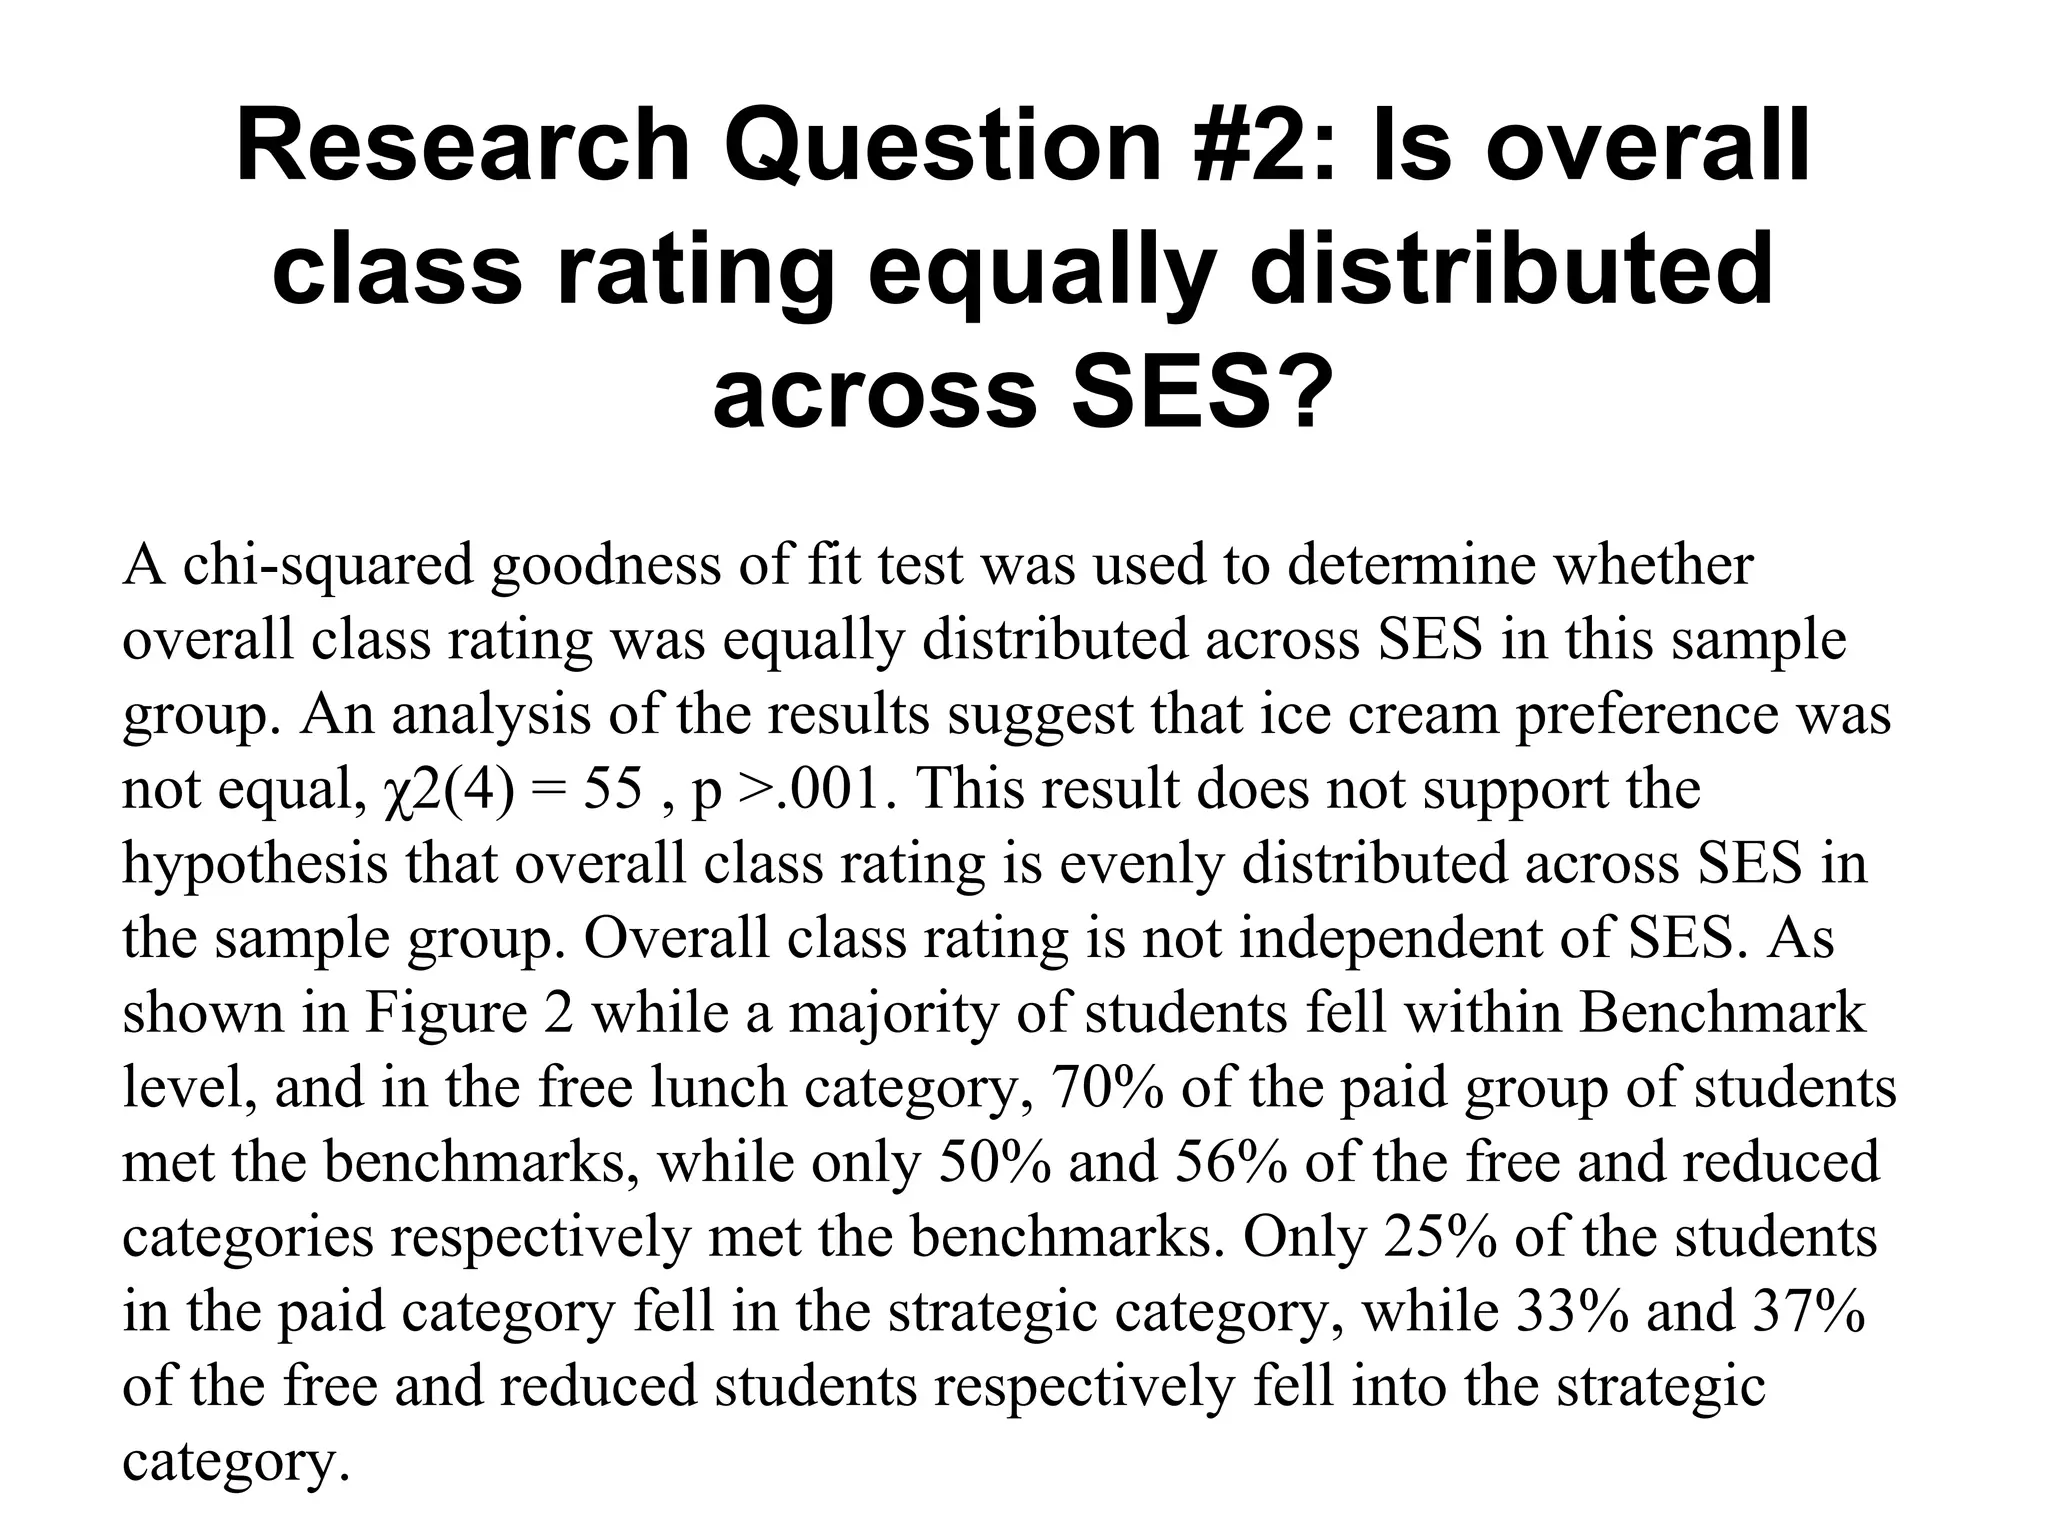
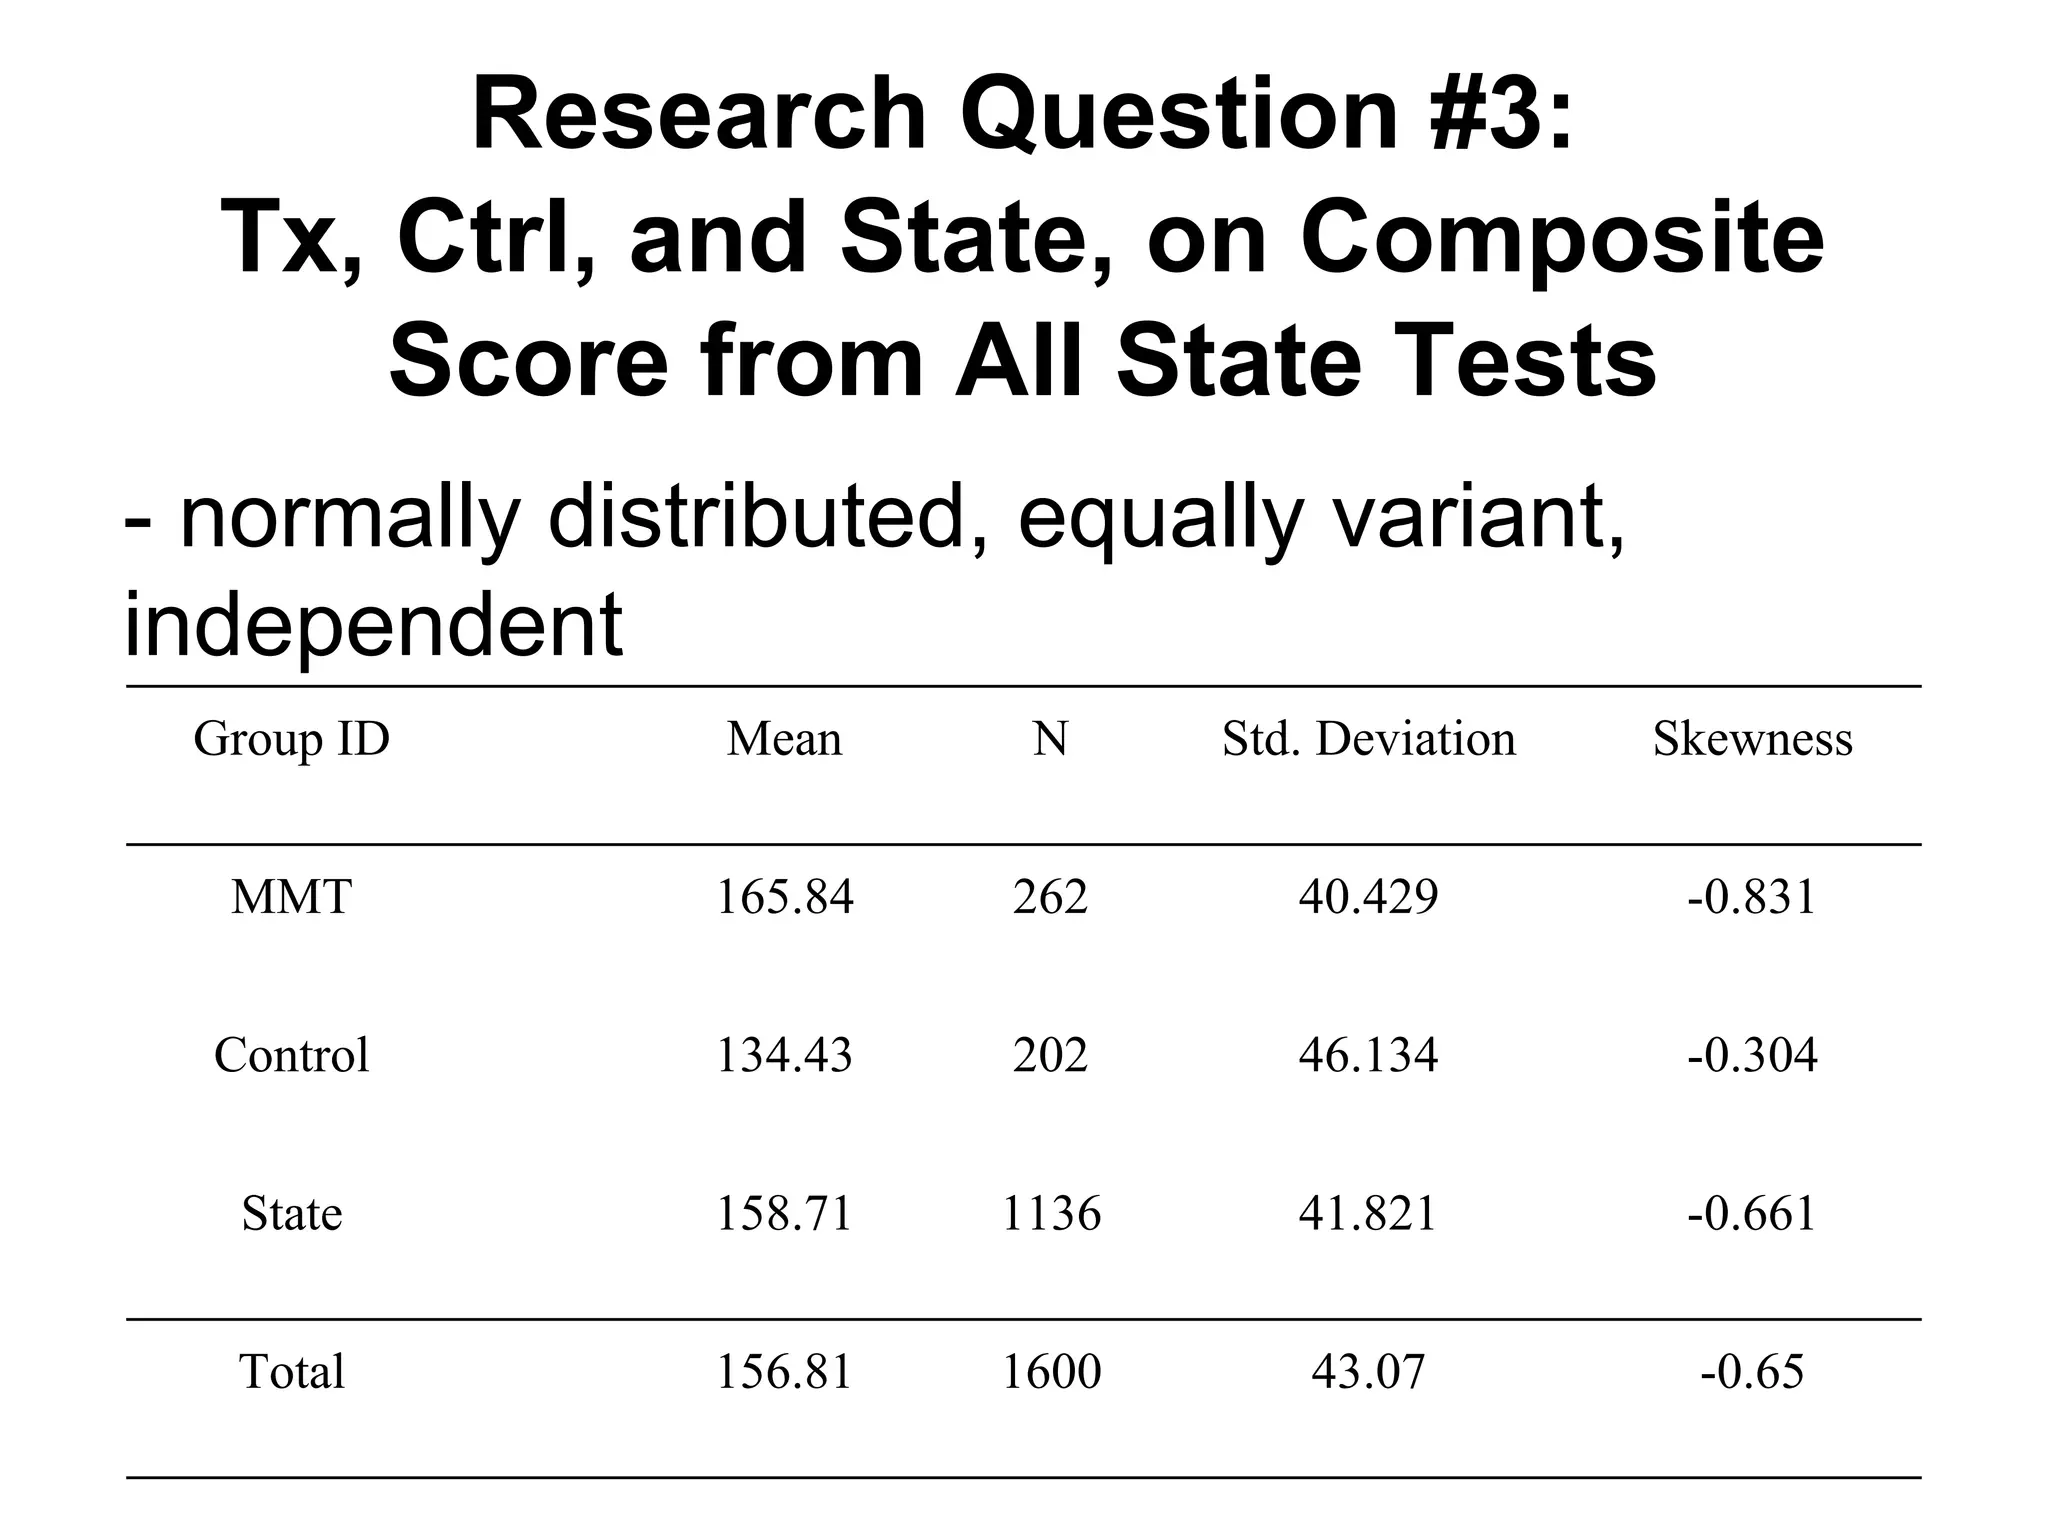
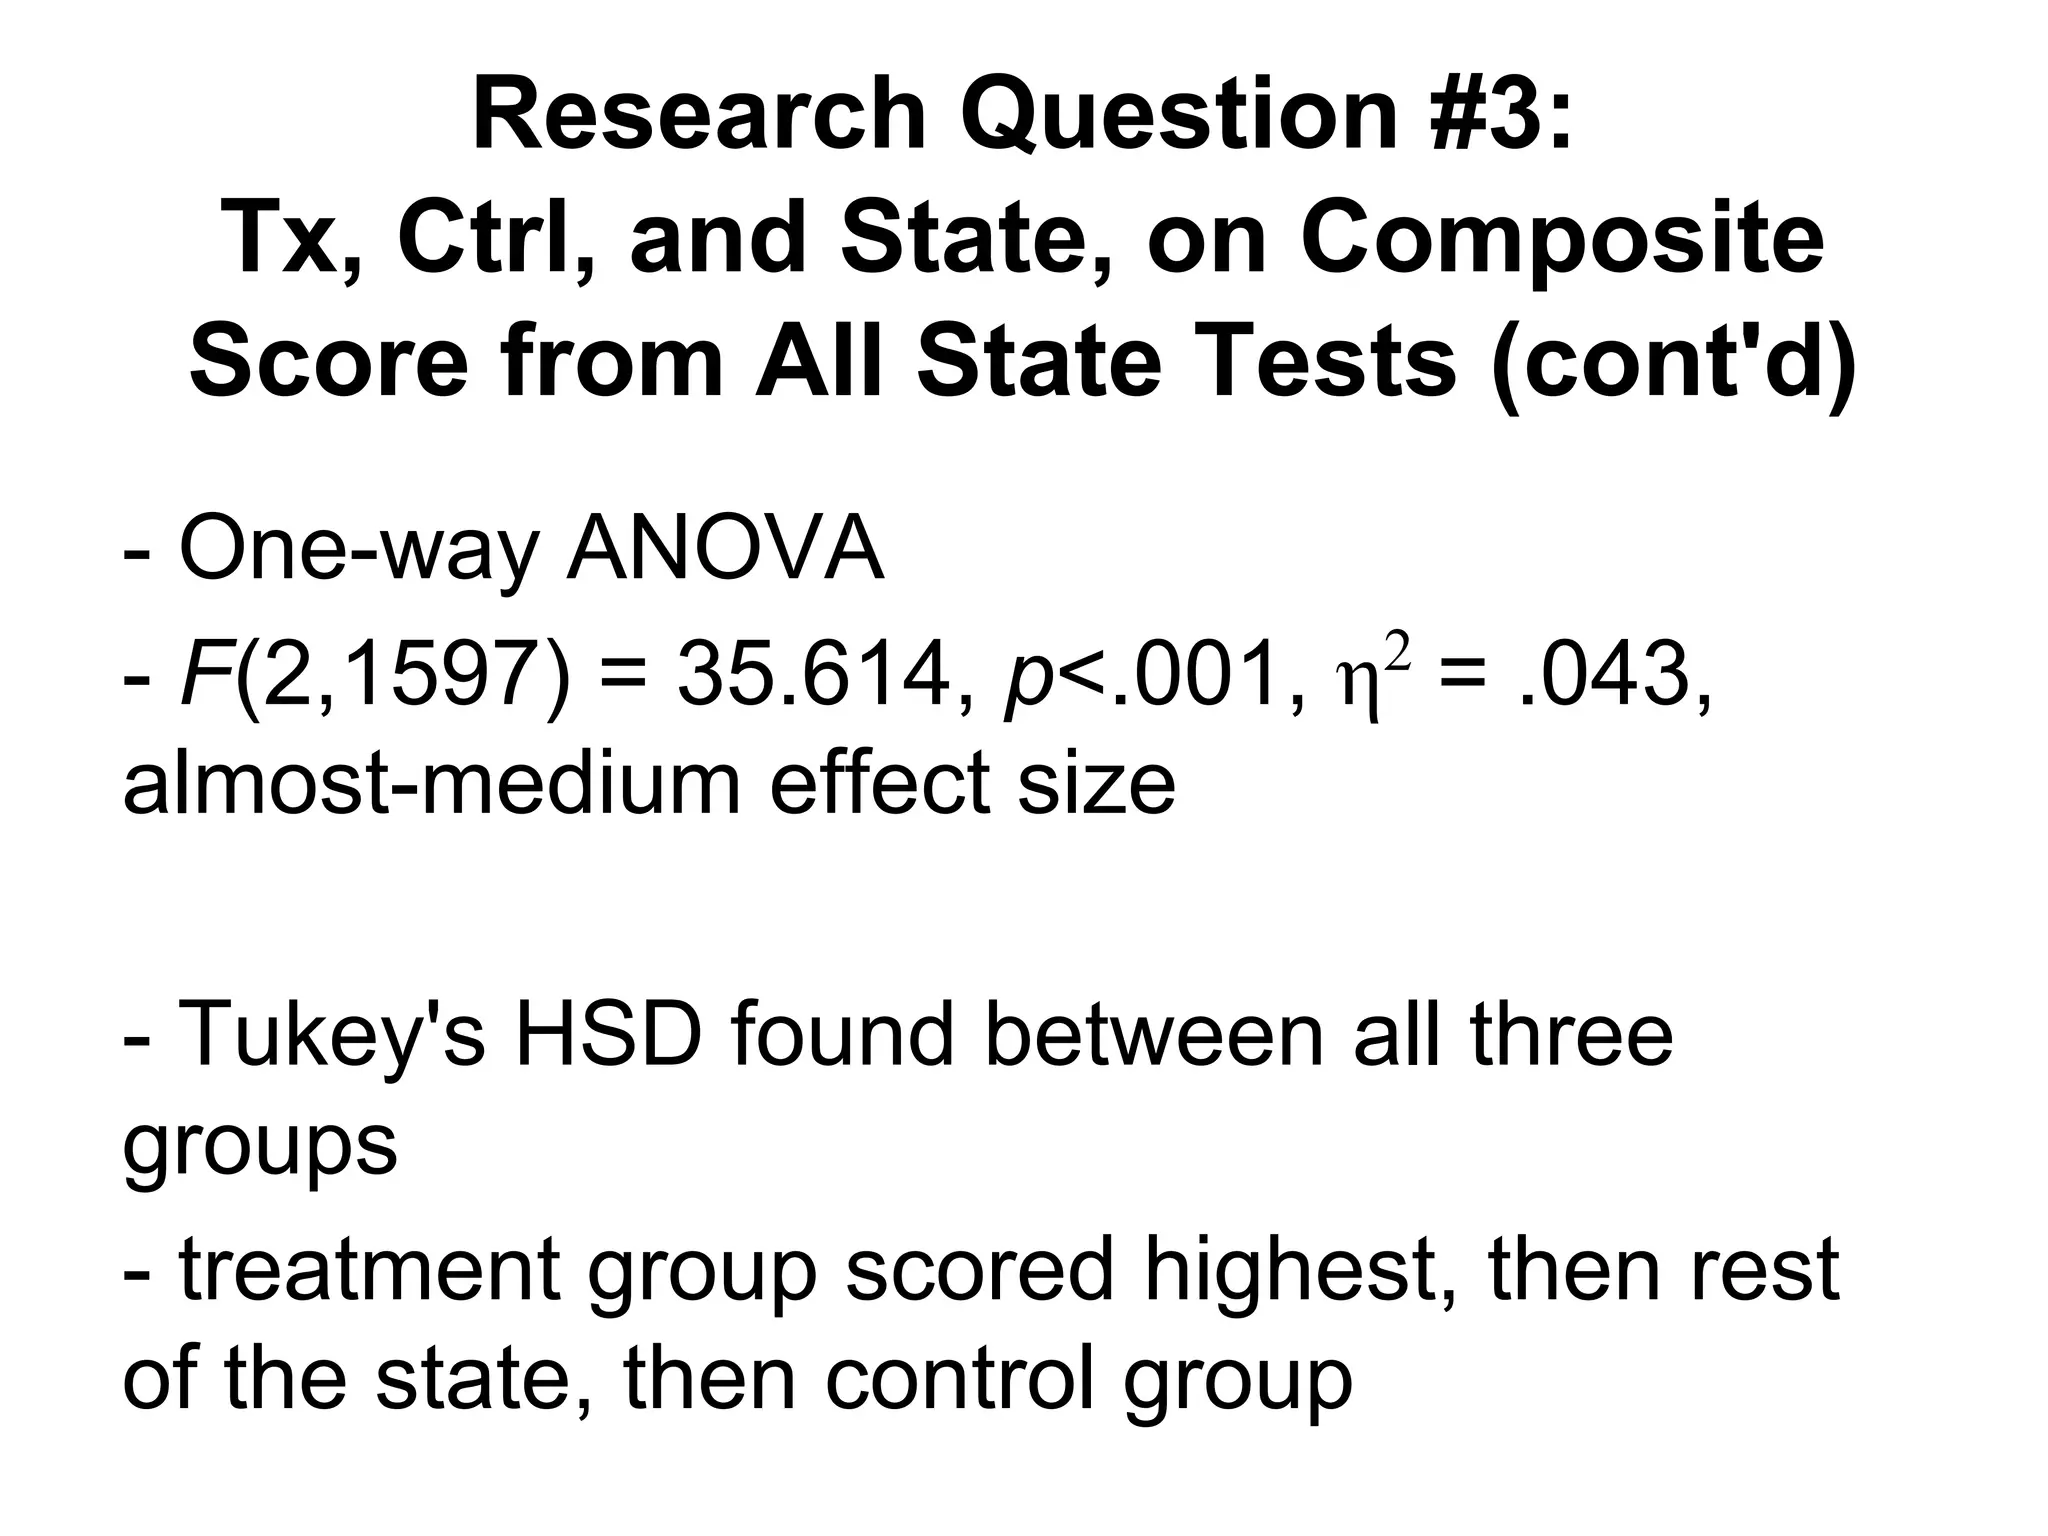
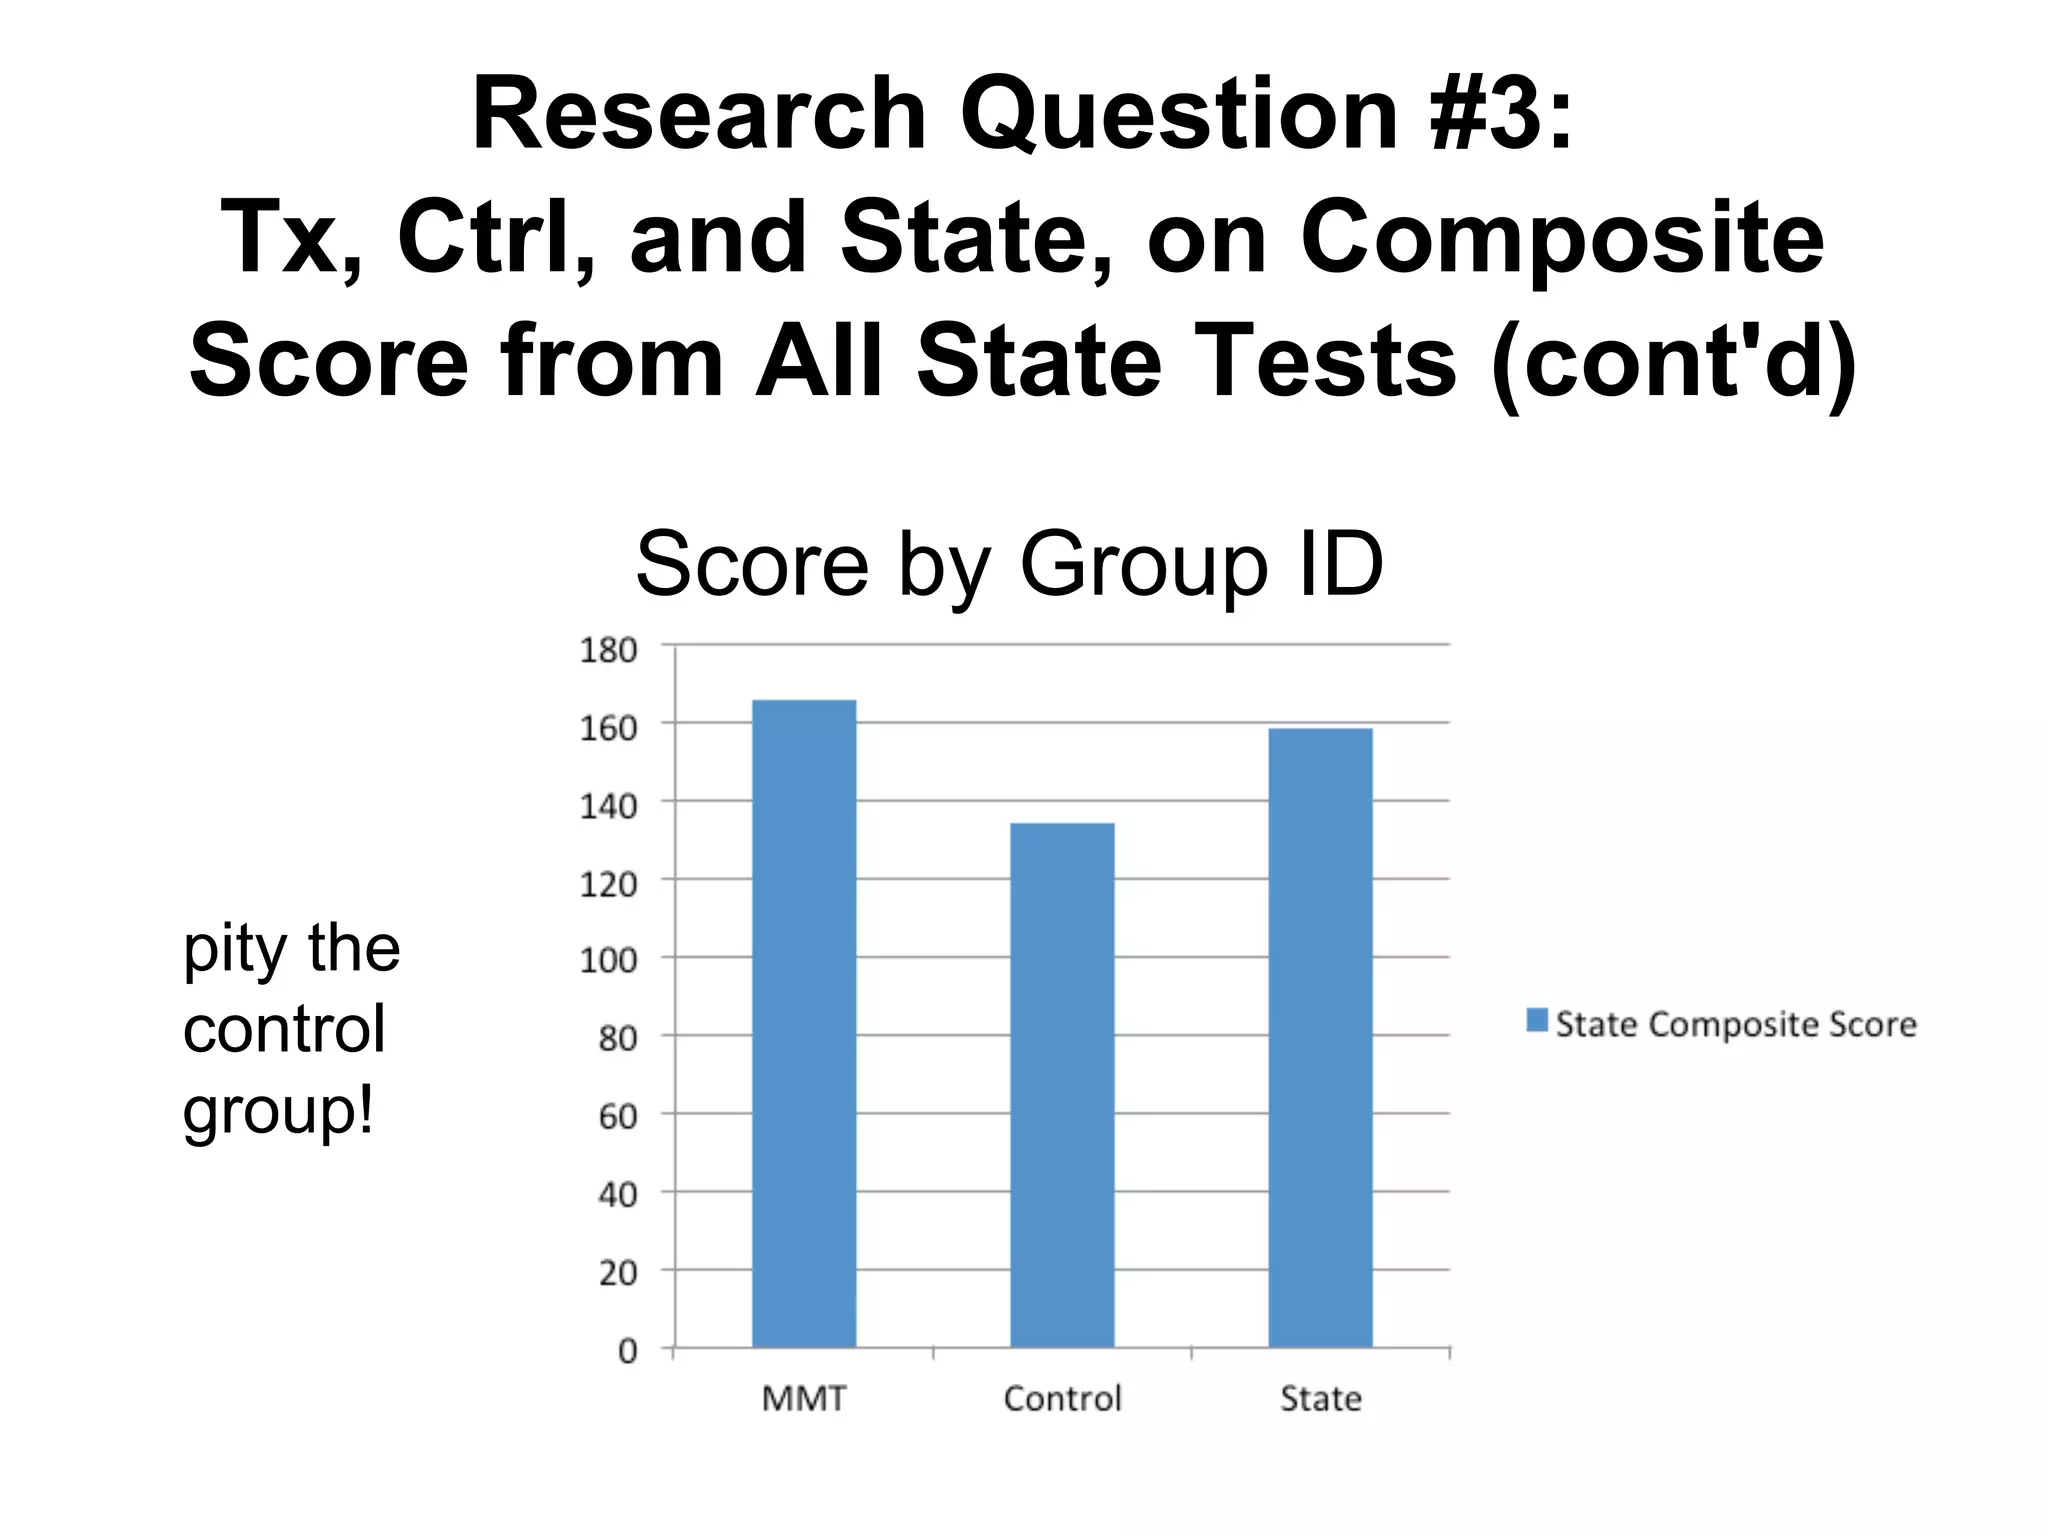
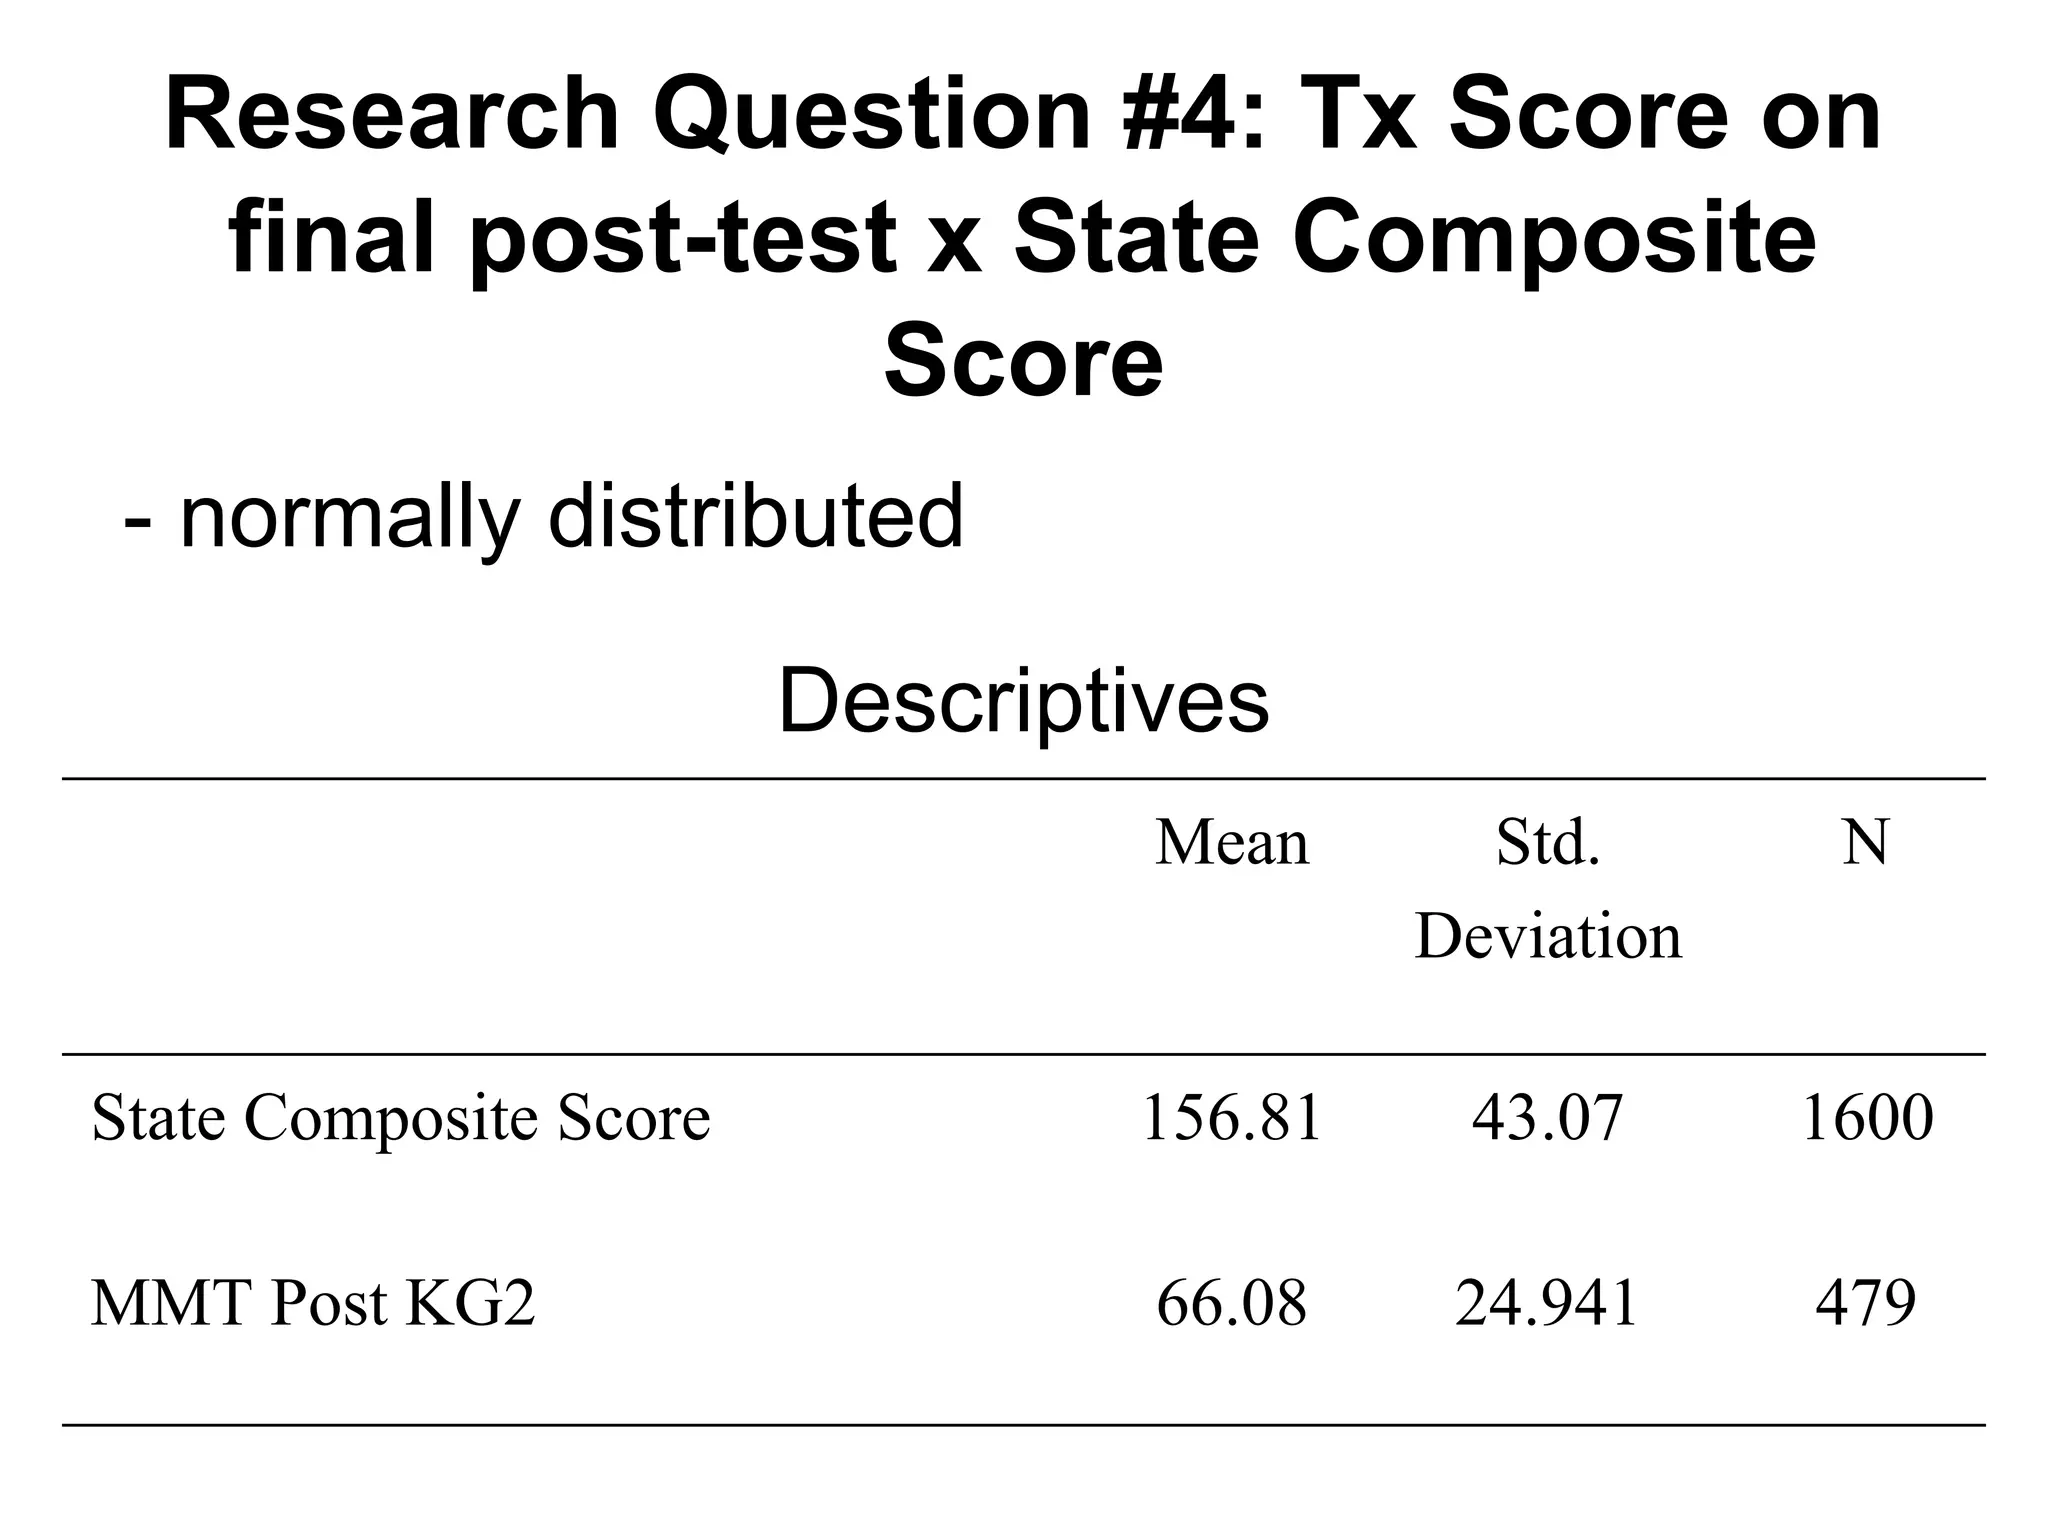
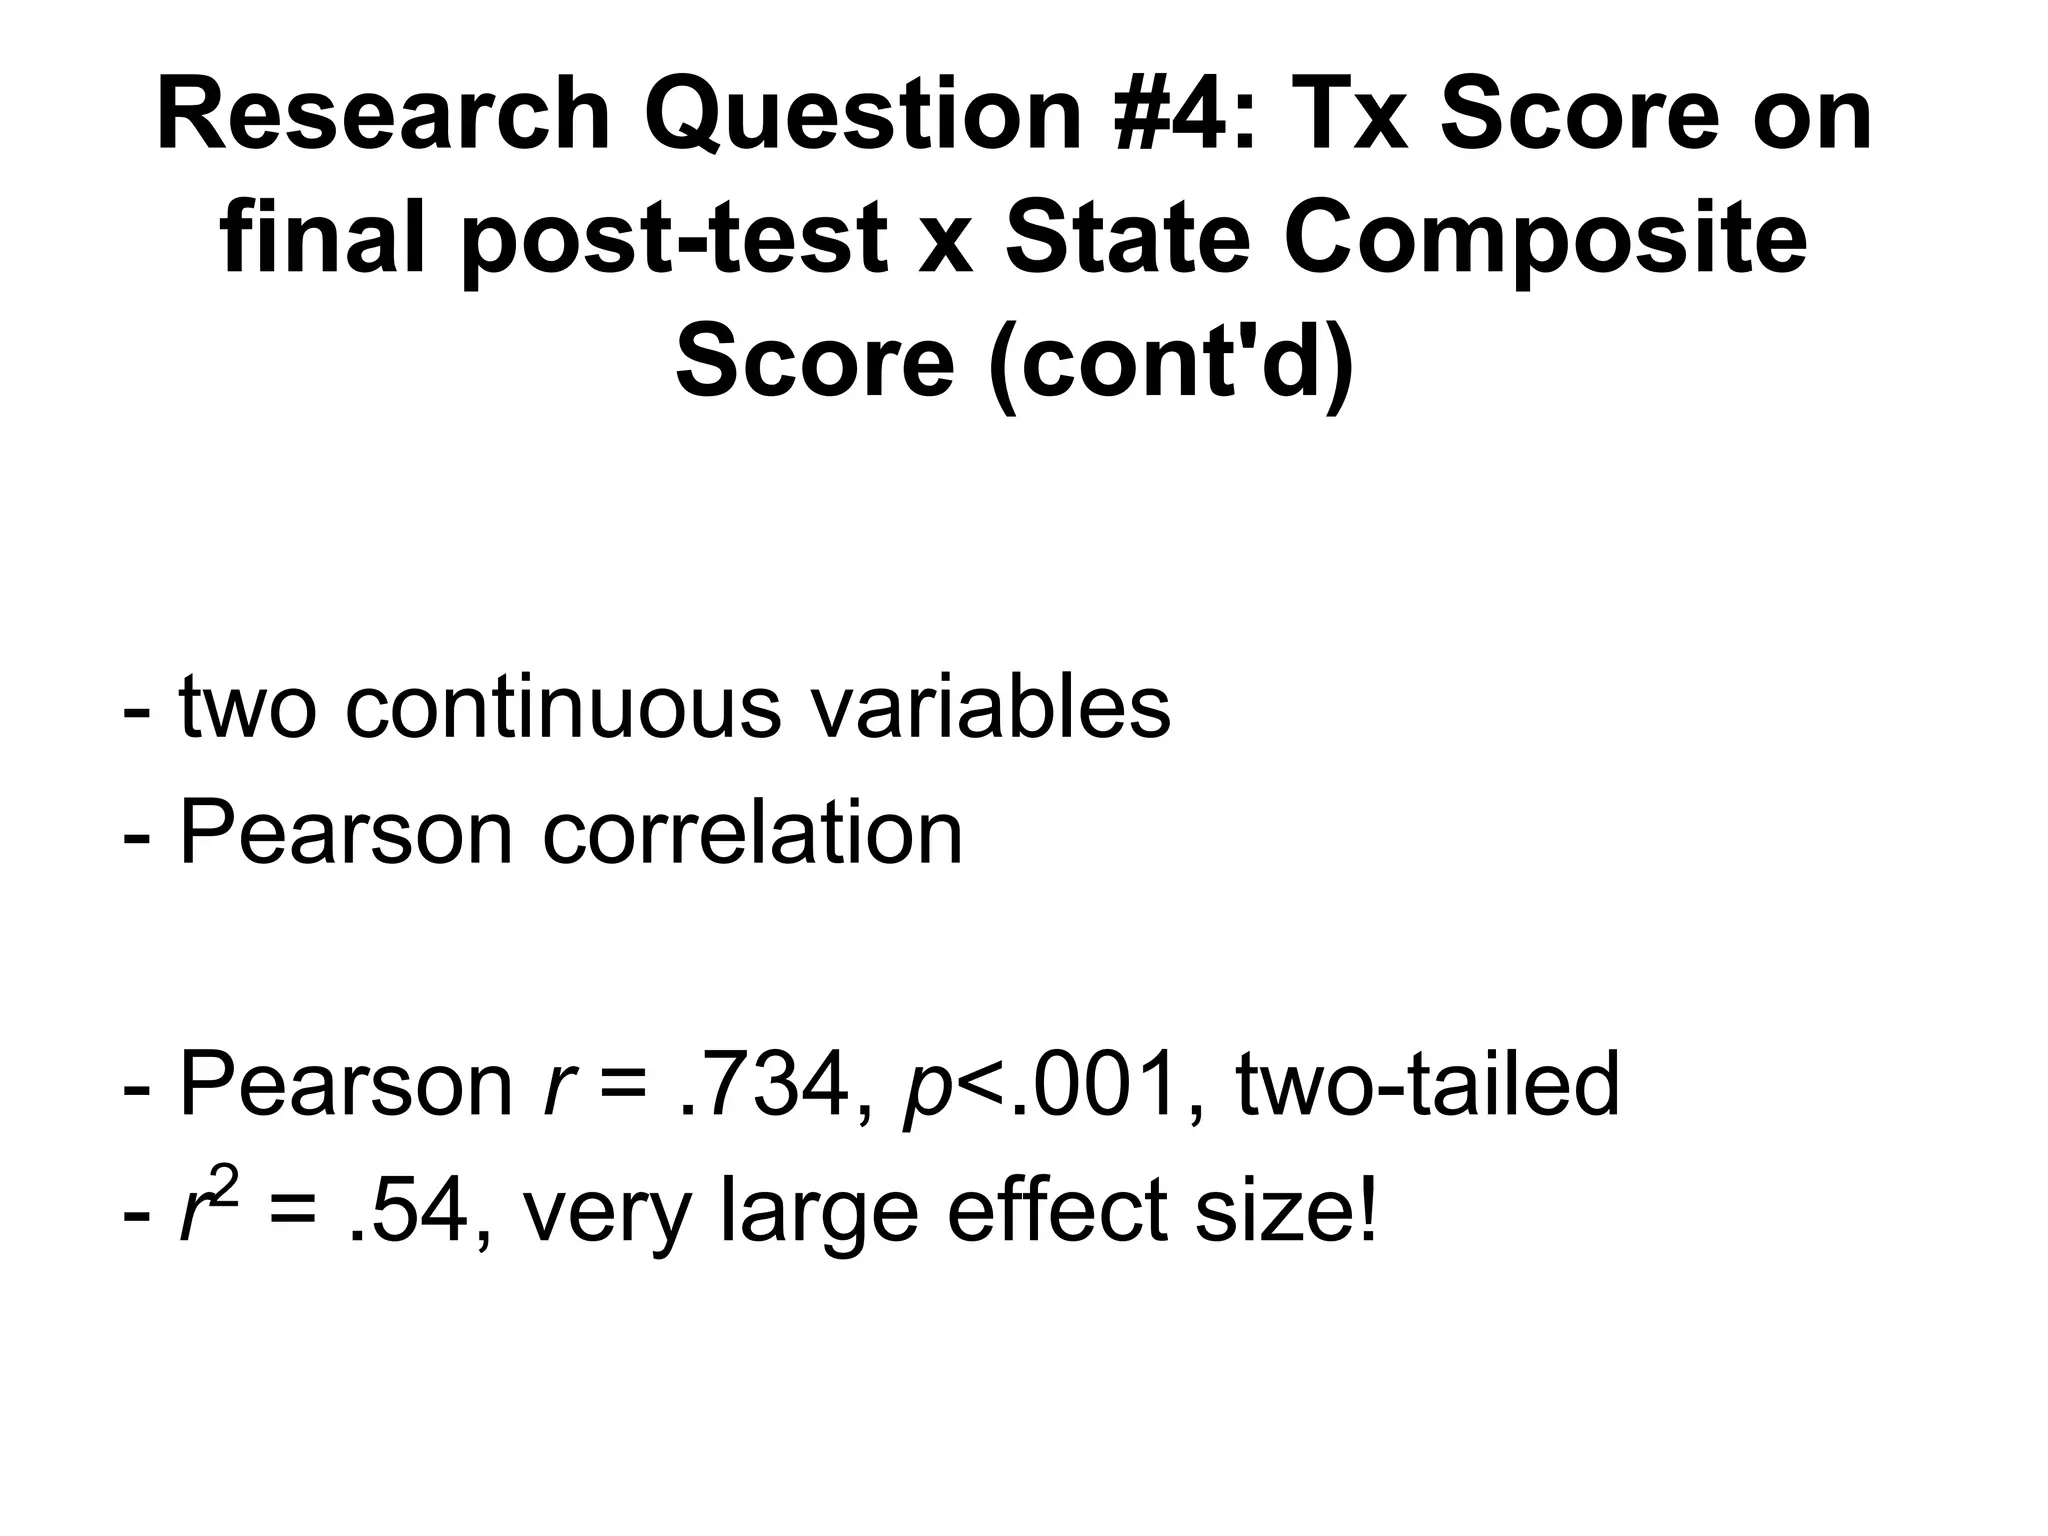
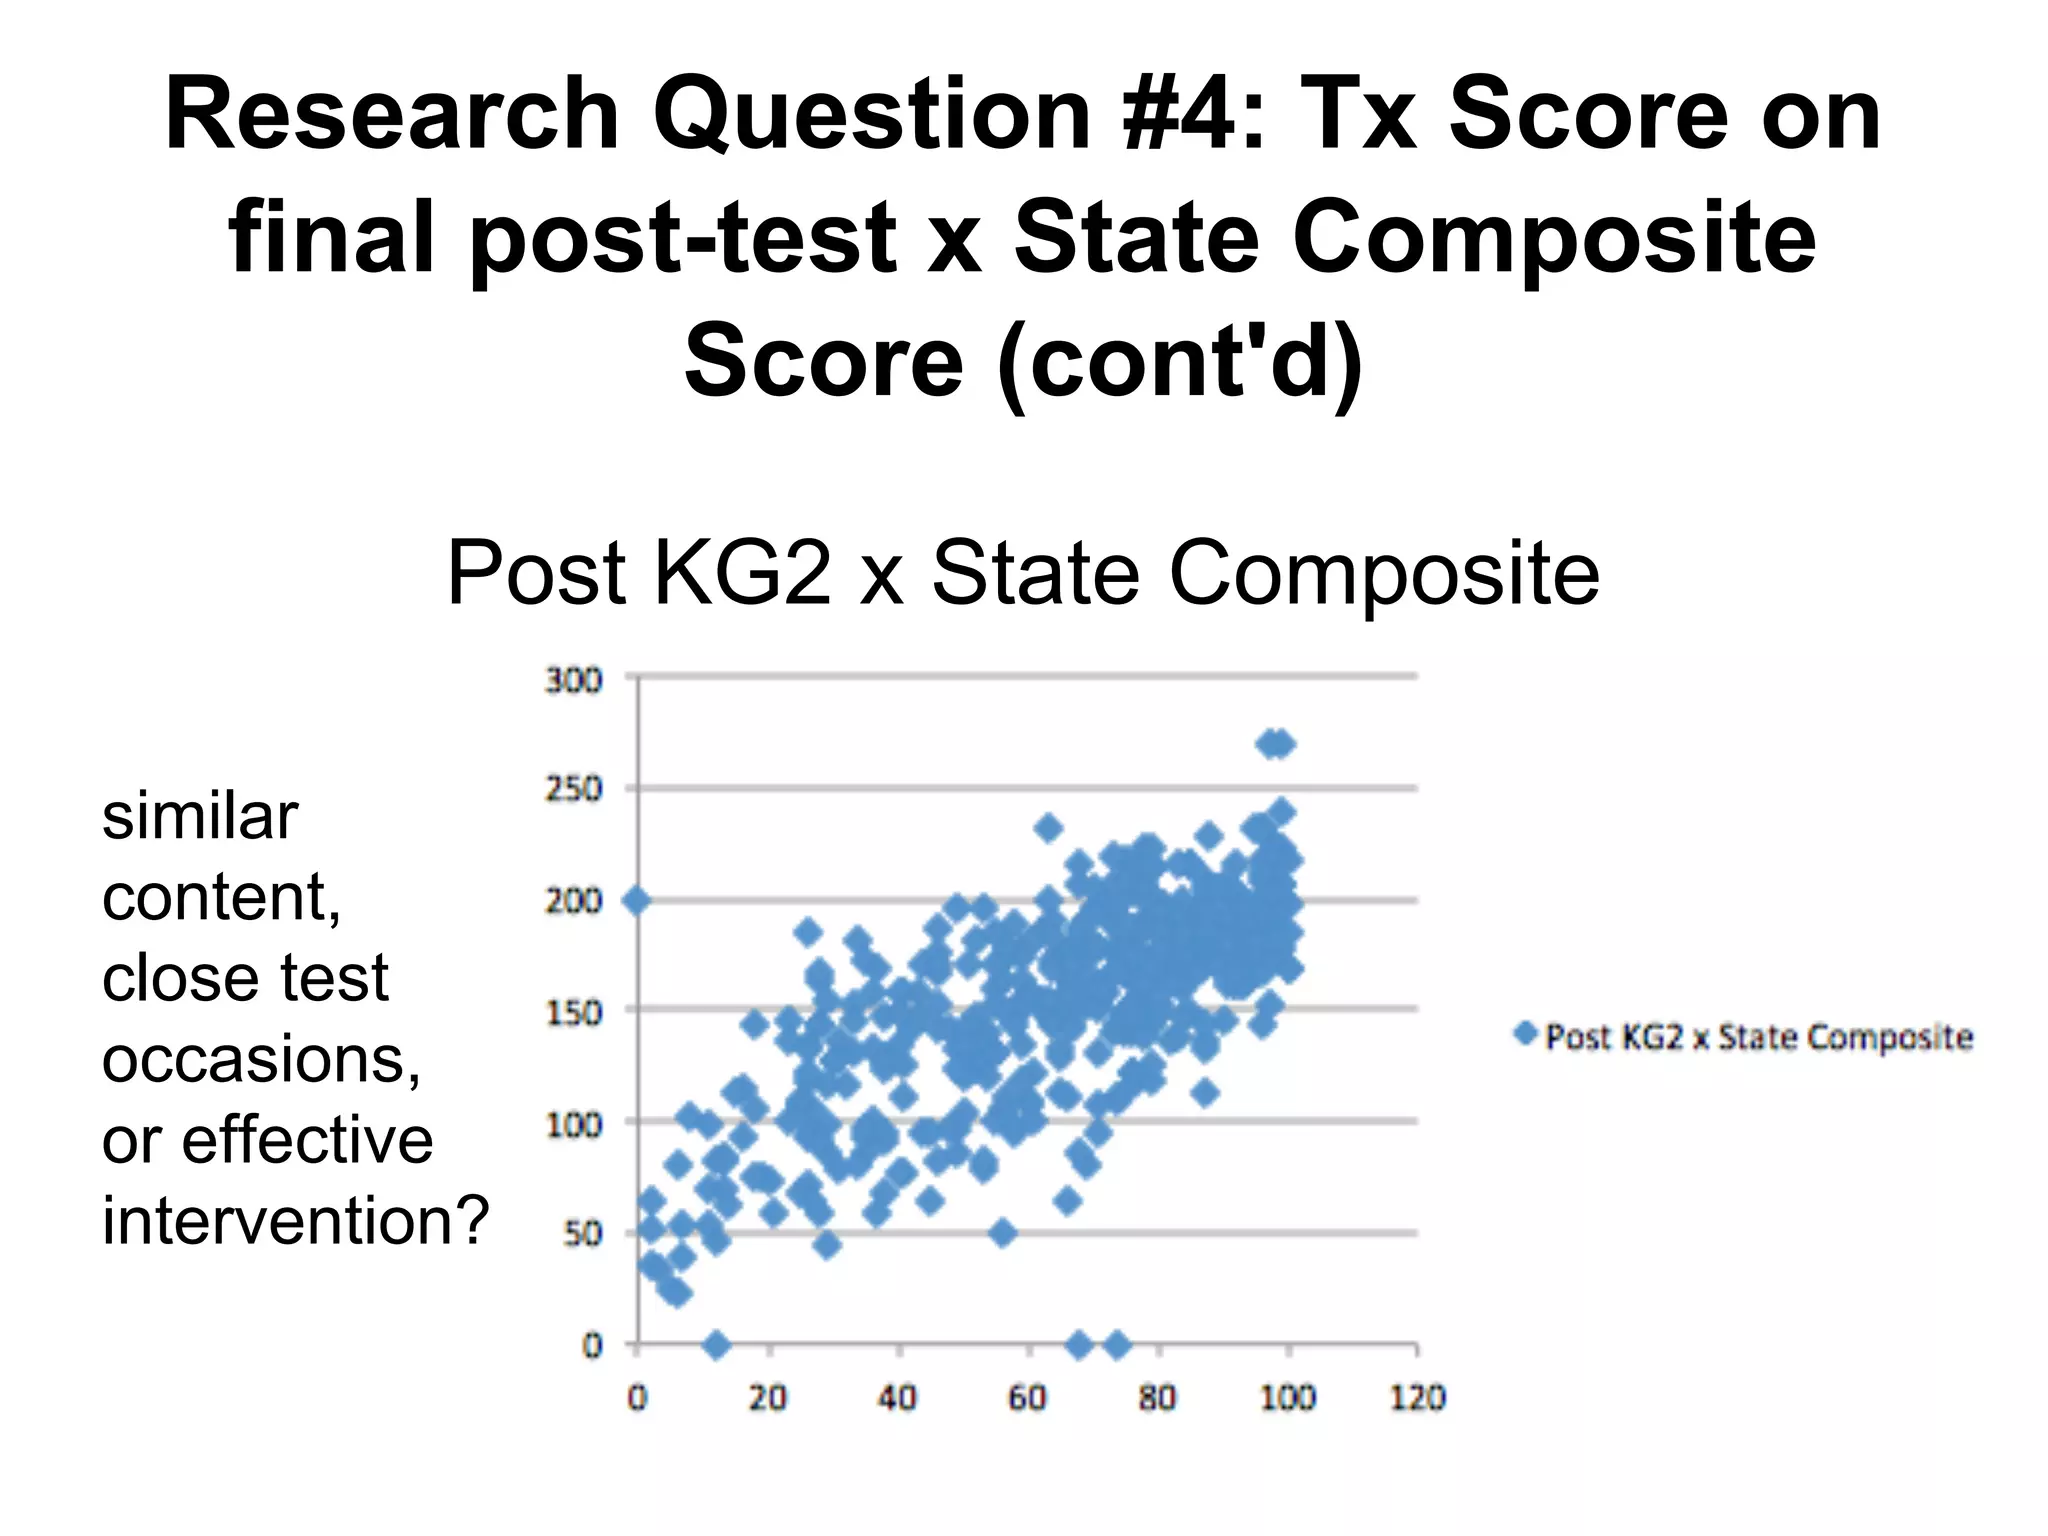

The document reports on the results of four research questions related to a kindergarten math intervention program called MMT. For the first question, independent t-tests found that students who received MMT instruction gained significantly more points from pre-to-post testing than students in the control group, with a very large effect size. The second question used a chi-squared test and found that overall class performance was not evenly distributed across socioeconomic status. The third question used a one-way ANOVA and post-hoc tests to determine that MMT students scored highest on state tests, followed by statewide averages and then the control group. Finally, the fourth question found a very strong positive correlation between MMT post-test scores and statewide composite


