
Recommended
More Related Content
More from ChristopherMinke
More from ChristopherMinke (10)
Recently uploaded
Recently uploaded (20)
Statistics: Trends Report
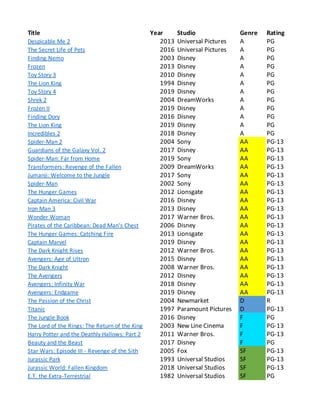
- 1. Title Year Studio Genre Rating Despicable Me 2 2013 Universal Pictures A PG The Secret Life of Pets 2016 Universal Pictures A PG Finding Nemo 2003 Disney A PG Frozen 2013 Disney A PG Toy Story 3 2010 Disney A PG The Lion King 1994 Disney A PG Toy Story 4 2019 Disney A PG Shrek 2 2004 DreamWorks A PG Frozen II 2019 Disney A PG Finding Dory 2016 Disney A PG The Lion King 2019 Disney A PG Incredibles 2 2018 Disney A PG Spider-Man 2 2004 Sony AA PG-13 Guardians of the Galaxy Vol. 2 2017 Disney AA PG-13 Spider-Man: Far from Home 2019 Sony AA PG-13 Transformers: Revenge of the Fallen 2009 DreamWorks AA PG-13 Jumanji: Welcome to the Jungle 2017 Sony AA PG-13 Spider-Man 2002 Sony AA PG-13 The Hunger Games 2012 Lionsgate AA PG-13 Captain America: Civil War 2016 Disney AA PG-13 Iron Man 3 2013 Disney AA PG-13 Wonder Woman 2017 Warner Bros. AA PG-13 Pirates of the Caribbean: Dead Man's Chest 2006 Disney AA PG-13 The Hunger Games: Catching Fire 2013 Lionsgate AA PG-13 Captain Marvel 2019 Disney AA PG-13 The Dark Knight Rises 2012 Warner Bros. AA PG-13 Avengers: Age of Ultron 2015 Disney AA PG-13 The Dark Knight 2008 Warner Bros. AA PG-13 The Avengers 2012 Disney AA PG-13 Avengers: Infinity War 2018 Disney AA PG-13 Avengers: Endgame 2019 Disney AA PG-13 The Passion of the Christ 2004 Newmarket D R Titanic 1997 Paramount Pictures D PG-13 The Jungle Book 2016 Disney F PG The Lord of the Rings: The Return of the King 2003 New Line Cinema F PG-13 Harry Potter and the Deathly Hallows: Part 2 2011 Warner Bros. F PG-13 Beauty and the Beast 2017 Disney F PG Star Wars: Episode III - Revenge of the Sith 2005 Fox SF PG-13 Jurassic Park 1993 Universal Studios SF PG-13 Jurassic World: Fallen Kingdom 2018 Universal Studios SF PG-13 E.T. the Extra-Terrestrial 1982 Universal Studios SF PG
- 2. Star Wars: Episode IV - A New Hope 1977 Fox SF PG-13 Star Wars: Episode I - The Phantom Menace 1999 Fox SF PG-13 Star Wars: Episode IX - The Rise of Skywalker 2019 Disney SF PG-13 Rogue One: A Star Wars Story 2016 Disney SF PG-13 Star Wars: Episode VIII - The Last Jedi 2017 Disney SF PG-13 Jurassic World 2015 Universal Studios SF PG-13 Black Panther 2018 Disney SF PG-13 Avatar 2009 Fox SF PG-13 Star Wars: Episode VII - The Force Awakens 2015 Disney SF PG-13
- 3. Budget BO-USA R1 R2 $76,000,000 $368,065,385 4.84 3.84 $75,000,000 $368,384,330 4.91 3.91 $94,000,000 $380,843,261 4.05 3.05 $150,000,000 $400,738,009 2.67 1.67 $200,000,000 $415,004,880 2.08 1.08 $45,000,000 $422,783,777 9.40 8.40 $200,000,000 $434,038,008 2.17 1.17 $150,000,000 $441,226,247 2.94 1.94 $150,000,000 $477,373,578 3.18 2.18 $200,000,000 $486,295,561 2.43 1.43 $260,000,000 $543,638,043 2.09 1.09 $200,000,000 $608,581,744 3.04 2.04 $200,000,000 $373,585,825 1.87 0.87 $200,000,000 $389,813,101 1.95 0.95 $160,000,000 $390,532,085 2.44 1.44 $200,000,000 $402,111,870 2.01 1.01 $90,000,000 $404,540,171 4.49 3.49 $139,000,000 $407,022,860 2.93 1.93 $78,000,000 $408,010,692 5.23 4.23 $250,000,000 $408,084,349 1.63 0.63 $174,144,585 $409,013,994 2.35 1.35 $149,000,000 $412,563,408 2.77 1.77 $225,000,000 $423,315,812 1.88 0.88 $130,000,000 $424,668,047 3.27 2.27 $160,000,000 $426,829,839 2.67 1.67 $250,000,000 $448,139,099 1.79 0.79 $250,000,000 $459,005,868 1.84 0.84 $185,000,000 $535,234,033 2.89 1.89 $220,000,000 $623,357,910 2.83 1.83 $316,000,000 $678,815,482 2.15 1.15 $356,000,000 $858,373,000 2.41 1.41 $30,000,000 $370,782,930 12.36 11.36 $200,000,000 $659,363,944 3.30 2.30 $175,000,000 $364,001,123 2.08 1.08 $94,000,000 $377,845,905 4.02 3.02 $169,189,427 $381,409,310 2.25 1.25 $160,000,000 $504,014,165 3.15 2.15 $113,000,000 $380,270,577 3.37 2.37 $63,000,000 $402,828,120 6.39 5.39 $170,000,000 $417,719,760 2.46 1.46 $10,500,000 $435,110,554 41.44 40.44
- 4. $11,000,000 $460,998,507 41.91 40.91 $115,000,000 $474,544,677 4.13 3.13 $275,000,000 $515,202,542 1.87 0.87 $200,000,000 $532,177,324 2.66 1.66 $317,000,000 $620,181,382 1.96 0.96 $150,000,000 $652,270,625 4.35 3.35 $200,000,000 $700,059,566 3.50 2.50 $237,000,000 $760,507,625 3.21 2.21 $245,000,000 $936,662,225 3.82 2.82
- 5. Row Labels Count of Genre D 2 F 4 A 12 SF 13 AA 19 Grand Total 50 Row Labels Sum of BO-USA2 D 1,030,146,874 $ F 1,627,270,503 $ A 5,346,972,823 $ SF 7,288,533,484 $ AA 8,883,017,445 $ Grand Total 24,175,941,129 $ 2 4 12 D F A MOST FINANCIALLY SUCCESSFUL TOTAL NUMBER $1,030,146,874 $1,627,270,503 $5,346,972,823 $7,288,533,484 $- $2,000,000,000 $4,000,000,000 $6,000,000,000 D F A SF AA MOST FINANCIALLY SUCCESSFUL REVENUE GENERAT
- 6. I feel a bar chart with generated) is importan The chart revea $8,883,017,445. It $7,288,533,484. The ge with a revenue of $1,62 . Using this chart execu i.e Action/Adventure next successful genre of movies are made in the has 13 movies. Thus we 12 13 19 A SF AA UCCESSFUL GENRES BASED ON THE NUMBER OF FILMS Total $7,288,533,484 $8,883,017,445 $6,000,000,000 $8,000,000,000 $10,000,000,000 SUCCESSFUL GENRES BASED ON TOTAL VENUE GENERATED Total
- 7. I feel a bar chart with the most financially successful genres (based on total revenue generated) is important for the executive for deciding before giving the green light. The chart reveals that AA genre has contributed most total revenue of $8,883,017,445. It is followed by Genre SF amounting to a total revenue of $7,288,533,484. The genre A is next to follow with revenue of $5,346,972,823 and F with a revenue of $1,627,270,503 and D with the smallest revenue of $1,030,146,874 . Using this chart executive can easily decide which genre is most liked by the viewer i.e Action/Adventure which has generated the most revenue and Animation is the next successful genre of movie. This easily supported by the graph as most blockbuster movies are made in the Action/Adventure genre i.e. is 19 followed by the sci-fi which has 13 movies. Thus we can say both charts support the data and executive decision. Interpretation of Data
- 8. Year Studio BO-USA 1977 Fox $460,998,507 1982 Universal Studios $435,110,554 1993 Universal Studios $402,828,120 1994 Disney $422,783,777 1997 Paramount Pictures $659,363,944 1999 Fox $474,544,677 2002 Sony $407,022,860 2003 Disney $380,843,261 2004 DreamWorks $441,226,247 2005 Fox $380,270,577 2006 Disney $423,315,812 2008 Warner Bros. $535,234,033 2009 Fox $760,507,625 2010 Disney $415,004,880 2011 Warner Bros. $381,409,310 2012 Disney $623,357,910 2013 Lionsgate $424,668,047 2015 Disney $936,662,225 2016 Disney $532,177,324 2017 Disney $620,181,382 2018 Disney $700,059,566 2019 Disney $858,373,000 Disney 25 DreamWorks 2 Fox 4 Lionsgate 2 New Line Cinema 1 Newmarket 1 Paramount Pictures 1 Sony 4 Universal Pictures 2 Universal Studios 4 Warner Bros. 4 Fox Universal Studios $- $100,000,000 $200,000,000 $300,000,000 $400,000,000 $500,000,000 $600,000,000 $700,000,000 $800,000,000 $900,000,000 $1,000,000,000 1976 1981 Years 0 D I S N EY D R EAMW O R KS F O X L I O N S G ATE N EW L I N E C I N EMA N EW MAR K ET P AR AMO U N T P I CTUR ES S O N Y U N I V ER S AL P I CTUR ES U N I V ER S AL S TU DI OS W AR N ER B R O S . MOST SUCCESSFUL ST
- 9. Universal Studios Universal Studios Disney Paramount Pictires Fox Sony Disney DreamWorks Fox Disney Warner Bros. Fox Disney Warner Bros. Disney Lionsgate Disney Disney 1981 1986 1991 1996 2001 2006 2011 MOST SUCCESFUL STUDIO PER YEAR 5 10 15 20 ST SUCCESSFUL STUDIOS BASED ON TOTAL NUMBER OF BLOCKBUSTER MOV RELEASED
- 11. Genre Count A 12 AA 19 D 2 F 4 SF 13 Rating Count PG 15 PG-13 34 R 1 A 24% AA 38% D 4% F 8% SF 26% GENRE DISTRIBUTION AMONG THE 50 BLOCKBUSTERS A AA D F SF RATING BREAKDOWN OF THE BLOCKBUSTERS PG PG-13 R
- 13. Budget Number of Films Less than 50 4 50 to 100 7 101 to 150 9 151 to 200 18 Above 200 12 Revenue Number of Films Less than 300 0 301 to 400 11 401 to 500 24 501 to 600 5 Above 600 10 Less than 50 50 to 100 101 to 150 151 to 200 Above200 FILM DISTRIBUTION 0 5 10 LESS THAN 300 301 TO 400 401 TO 500 501 TO 600 ABOVE 600 REVENUE FILM DISTRIBUTION
- 14. 4 7 9 18 12 TRIBUTION BY BUDGET 10 15 20 25 30 NUMBER OF FILMS DISTRIBUTION BY REVENUE