Download to read offline

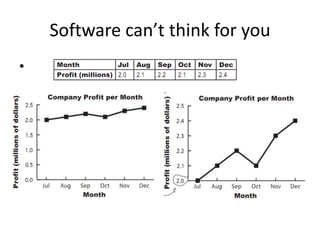
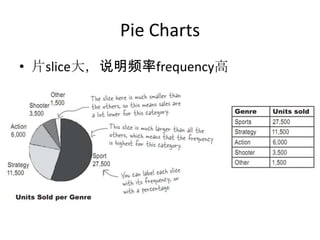
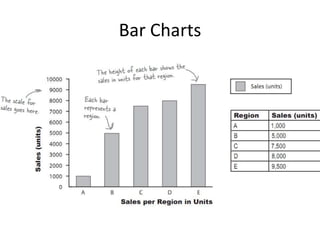
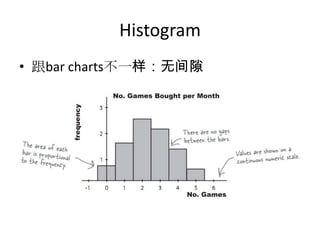
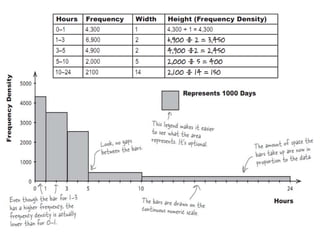
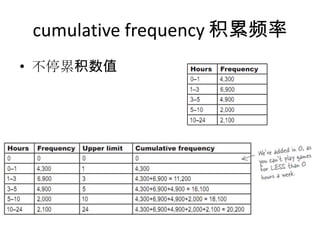
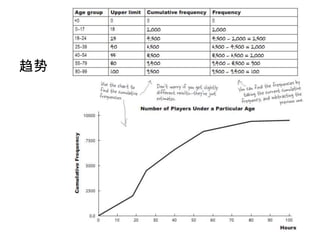
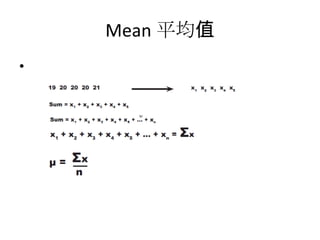
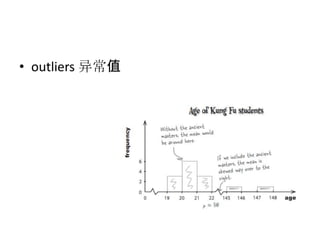
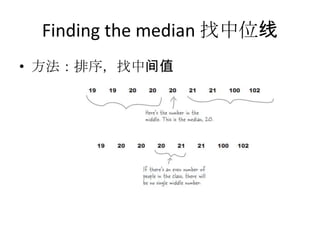
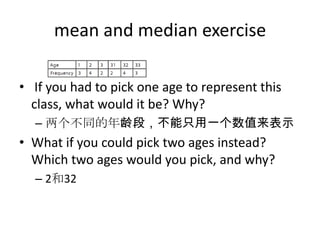
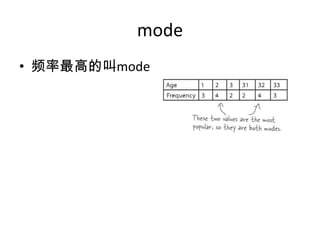

The document discusses various statistical concepts including pie charts, bar charts, histograms, cumulative frequency, mean, median, outliers, and mode. It notes that pie charts show the relative frequency of different categories, bar charts show counts without gaps between bars like histograms, and cumulative frequency accumulates values over time. It also explains that mean is the average, median finds the middle value after sorting data, and mode is the value that occurs most frequently.


