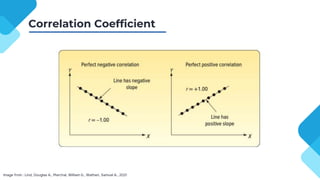
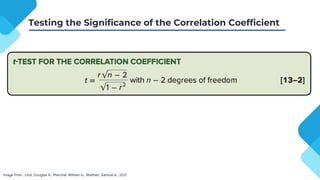
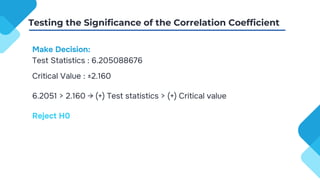
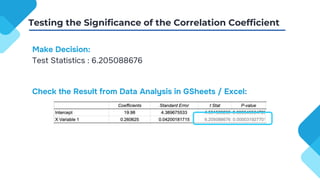
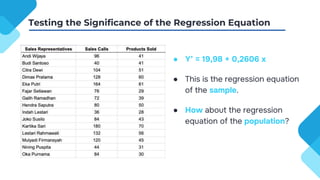
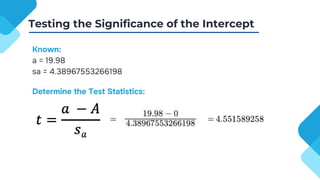
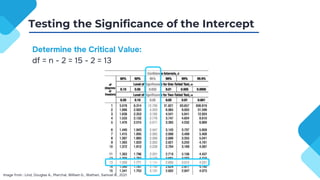
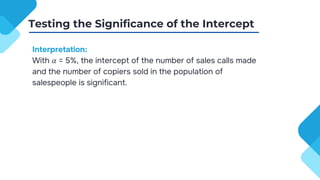
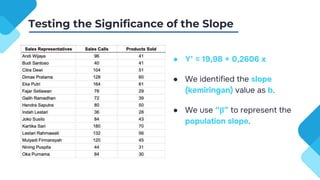
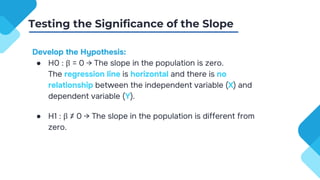
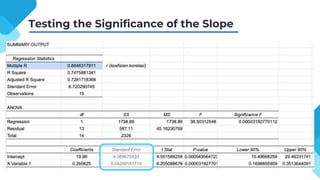
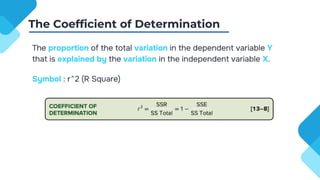
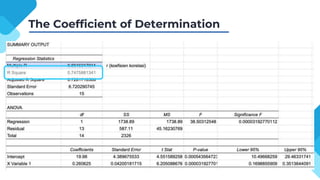
Statistics 1
13
Correlation & Linear
Regression 2
Muhammad Rifqi Arviansyah
https://linktr.ee/bisdi_
aping
Present Form - System
Pada bagian komentar silahkan
isi:
1. Hal yang saya pelajari hari ini.
2.Hal menarik dari perkuliahan
hari ini.
3.Hal yang masih ingin saya cari
tahu setelah perkuliahan ini.
4.Saran.
Previously on Stat 1….
● Correlation Analysis
Group of techniques to measure the relationship between
two variables.
● Regression Analysis
Develop an equation that will allow us to estimate the
value of one variable based on the value of another.
Correlation Analysis & Regression Analysis
Correlation Coefficient
Image from : Lind, Douglas A., Marchal, William G., Wathen, Samuel A., 2021
Correlation Coefficient Category
Image from : Lind, Douglas A., Marchal, William G., Wathen, Samuel A., 2021
From Cohen 1988:
1. Weak : 0.10 - 0.29
2. Medium : 0.30 - 0.49
3. Large : 0.50 - 1.00
From Evans 1996:
1. Very weak : 0.00 - 0.19
2. Weak : 0.20 - 0.39
3. Moderate : 0.40 - 0.59
4. Strong : 0.60 - 0.79
5. Very strong : 0.80 - 1.00
Example
Image from : Lind, Douglas A., Marchal, William G., Wathen, Samuel A., 2021
● Regression Analysis
Develop an equation that will allow us to estimate the
value of one variable based on the value of another.
● Least Square Principle
A mathematical procedure that uses the data to position a
line with the objective of minimizing the sum of the
squares of the vertical distances between the actual y
values and the predicted values of y.
Regression Analysis
Regression Analysis
Image from : Lind, Douglas A., Marchal, William G., Wathen, Samuel A., 2021
Regression Analysis
Image from : Lind, Douglas A., Marchal, William G., Wathen, Samuel A., 2021
Regression Analysis
Image from : Lind, Douglas A., Marchal, William G., Wathen, Samuel A., 2021
Regression Analysis
Image from : Lind, Douglas A., Marchal, William G., Wathen, Samuel A., 2021
Correlation Analysis & Regression Analysis
● If the company has 100
employees, can we apply the
correlation and regression
equation?
Testing the Significance of
the Correlation Coefficient
01
13 - Correlation & Linear Regression 2
Testing the Significance of
the Regression Equation
02
● If the company has 100
employees, can we apply the
correlation and regression
equation?
● We will use the concept of
inferential statistics.
Testing the Significance of the Correlation Coefficient
From the sample, the Sales Manager wants to know could
there be zero correlation in the population from which the
sample was selected?
Develop the Hypothesis:
● H0 : ρ = 0 → The correlation in the population is zero.
● H1 : ρ ≠ 0 → The correlation in the population is different
from zero.
Testing the Significance of the Correlation Coefficient
Image from : Lind, Douglas A., Marchal, William G., Wathen, Samuel A., 2021
Known:
r = 0.8646
n = 15
Determine the Test Statistics:
Testing the Significance of the Correlation Coefficient
Determine the Critical Value:
df = n - 2 = 15 - 2 = 13
Testing the Significance of the Correlation Coefficient
Image from : Lind, Douglas A., Marchal, William G., Wathen, Samuel A., 2021
Determine the Critical Value:
Testing the Significance of the Correlation Coefficient
Image from : Lind, Douglas A., Marchal, William G., Wathen, Samuel A., 2021
Make Decision:
Test Statistics : 6.205088676
Critical Value : ±2.160
6.2051 > 2.160 → (+) Test statistics > (+) Critical value
Reject H0
Testing the Significance of the Correlation Coefficient
Interpretation:
With 𝛼 = 5%, there is correlation with respect to the number of
sales calls made and the number of copiers sold in the
population of salespeople.
Testing the Significance of the Correlation Coefficient
Make Decision:
Test Statistics : 6.205088676
Check the Result from Data Analysis in GSheets / Excel:
How if the Sales Manager wants to know could there be a
positive correlation in the population from which the sample
was selected?
Testing the Significance of the Correlation Coefficient
Testing the Significance of
the Correlation Coefficient
01
13 - Correlation & Linear Regression 2
Testing the Significance of
the Regression Equation
02
● Y’ = 19,98 + 0,2606 x
● This is the regression equation
of the sample.
● How about the regression
equation of the population?
Testing the Significance of the Regression Equation
● Y’ = 19,98 + 0,2606 x
● We identified the intercept value
as a.
● We use “A” to represent the
population intercept.
Testing the Significance of the Intercept
Where:
● a = sample intercept
● A = population intercept
● sa = the standard error of the intercept estimate
Testing the Significance of the Intercept
the Sales Manager wants to know could the intercept in the
population is not 0 from which the sample was selected?
Develop the Hypothesis:
● H0 : A = 0 → The slope in the population is zero.
● H1 : A ≠ 0 → The slope in the population is different from
zero.
Testing the Significance of the Intercept
Known:
a = 19.98
sa = 4.38967553266198
Determine the Test Statistics:
Testing the Significance of the Intercept
Determine the Critical Value:
df = n - 2 = 15 - 2 = 13
Image from : Lind, Douglas A., Marchal, William G., Wathen, Samuel A., 2021
Testing the Significance of the Intercept
Make Decision:
Test Statistics : 4.551589258
Critical Value : ±2.160
4.552 > 2.160 → (+) Test statistics > (+) Critical value
Reject H0
Testing the Significance of the Intercept
Interpretation:
With 𝛼 = 5%, the intercept of the number of sales calls made
and the number of copiers sold in the population of
salespeople is significant.
Testing the Significance of the Intercept
● Y’ = 19,98 + 0,2606 x
● We identified the slope
(kemiringan) value as b.
● We use “β” to represent the
population slope.
Testing the Significance of the Slope
Develop the Hypothesis:
● H0 : β = 0 → The slope in the population is zero.
The regression line is horizontal and there is no
relationship between the independent variable (X) and
dependent variable (Y).
● H1 : β ≠ 0 → The slope in the population is different from
zero.
Testing the Significance of the Slope
the Sales Manager wants to know could there be a positive
slope in the population from which the sample was selected?
Develop the Hypothesis:
● H0 : β <= 0 → The slope in the population is zero.
● H1 : β > 0 → The slope in the population is different from
zero.
Testing the Significance of the Slope
Known:
b = 0.260625
sb = 0.0420018171539133
Determine the Test Statistics:
Testing the Significance of the Slope
Determine the Critical Value:
df = n - 2 = 15 - 2 = 13
Image from : Lind, Douglas A., Marchal, William G., Wathen, Samuel A., 2021
Testing the Significance of the Slope
Make Decision:
Test Statistics : 6.205088676
Critical Value : 1.771
6.2051 > 1.771 → (+) Test statistics > (+) Critical value
Reject H0
Testing the Significance of the Slope
Interpretation:
With 𝛼 = 5%, the slope of the number of sales calls made and
the number of copiers sold in the population of salespeople is
positive / significant.
Testing the Significance of the Slope
Testing the Significance of the Slope & Intercept
Y’ = 19.98 + 0.2606 X
(Number of products sold) = 19.98 + 0.2606 (number of sales calls)
Is the regression equation is a good predictor?
Finding the exact outcome is practically impossible. Therefore, we
know the standard error of estimate.
Standard Error of Estimate is a measure of dispersion of the
observed values around the line of regression.
Standard Error of Estimate
The interval of estimated value of products sold (Y) could be
determined by calculating the upper and lower bound.
Interval Y’ = Y’ ± sy.x
Standard Error of Estimate
Interval of the Intercept & Slope
The proportion of the total variation in the dependent variable Y
that is explained by the variation in the independent variable X.
Symbol : r^2 (R Square)
The Coefficient of Determination
r square = 0.7475
Interpretation:
74.75% variance of products sold has been explained by sales
calls. The other 25.25% could be explained by other factors.
The Coefficient of Determination
https://docs.google.com/spreadsheets/d/1Pj0mP5M6sJbnMFU75nHSKypt9V
UZYa_qjCIQYRX8sAo/edit?usp=sharing
Exercise
References
Lind, Douglas A., Marchal, William G., Wathen, Samuel A.. (2021). Statistical techniques in business & economics
Present Form - System
Pada bagian komentar silahkan
isi:
1. Hal yang saya pelajari hari ini.
2.Hal menarik dari perkuliahan
hari ini.
3.Hal yang masih ingin saya cari
tahu setelah perkuliahan ini.
4.Saran.
CREDITS: This presentation template was created by Slidesgo, and
includes icons by Flaticon, and infographics & images by Freepik
Thanks!
Any questions?
Please keep this slide for attribution

Stat 1 - 13 Correlation Linear Regression.pptx

  • 1.
    Statistics 1 13 Correlation &Linear Regression 2 Muhammad Rifqi Arviansyah
  • 2.
  • 3.
    Present Form -System Pada bagian komentar silahkan isi: 1. Hal yang saya pelajari hari ini. 2.Hal menarik dari perkuliahan hari ini. 3.Hal yang masih ingin saya cari tahu setelah perkuliahan ini. 4.Saran.
  • 4.
  • 5.
    ● Correlation Analysis Groupof techniques to measure the relationship between two variables. ● Regression Analysis Develop an equation that will allow us to estimate the value of one variable based on the value of another. Correlation Analysis & Regression Analysis
  • 6.
    Correlation Coefficient Image from: Lind, Douglas A., Marchal, William G., Wathen, Samuel A., 2021
  • 7.
    Correlation Coefficient Category Imagefrom : Lind, Douglas A., Marchal, William G., Wathen, Samuel A., 2021 From Cohen 1988: 1. Weak : 0.10 - 0.29 2. Medium : 0.30 - 0.49 3. Large : 0.50 - 1.00 From Evans 1996: 1. Very weak : 0.00 - 0.19 2. Weak : 0.20 - 0.39 3. Moderate : 0.40 - 0.59 4. Strong : 0.60 - 0.79 5. Very strong : 0.80 - 1.00
  • 8.
    Example Image from :Lind, Douglas A., Marchal, William G., Wathen, Samuel A., 2021
  • 9.
    ● Regression Analysis Developan equation that will allow us to estimate the value of one variable based on the value of another. ● Least Square Principle A mathematical procedure that uses the data to position a line with the objective of minimizing the sum of the squares of the vertical distances between the actual y values and the predicted values of y. Regression Analysis
  • 10.
    Regression Analysis Image from: Lind, Douglas A., Marchal, William G., Wathen, Samuel A., 2021
  • 11.
    Regression Analysis Image from: Lind, Douglas A., Marchal, William G., Wathen, Samuel A., 2021
  • 12.
    Regression Analysis Image from: Lind, Douglas A., Marchal, William G., Wathen, Samuel A., 2021
  • 13.
    Regression Analysis Image from: Lind, Douglas A., Marchal, William G., Wathen, Samuel A., 2021
  • 14.
    Correlation Analysis &Regression Analysis
  • 15.
    Correlation Analysis &Regression Analysis ● If the company has 100 employees, can we apply the correlation and regression equation?
  • 16.
    Testing the Significanceof the Correlation Coefficient 01 13 - Correlation & Linear Regression 2 Testing the Significance of the Regression Equation 02
  • 17.
    ● If thecompany has 100 employees, can we apply the correlation and regression equation? ● We will use the concept of inferential statistics. Testing the Significance of the Correlation Coefficient
  • 18.
    From the sample,the Sales Manager wants to know could there be zero correlation in the population from which the sample was selected? Develop the Hypothesis: ● H0 : ρ = 0 → The correlation in the population is zero. ● H1 : ρ ≠ 0 → The correlation in the population is different from zero. Testing the Significance of the Correlation Coefficient
  • 19.
    Testing the Significanceof the Correlation Coefficient Image from : Lind, Douglas A., Marchal, William G., Wathen, Samuel A., 2021
  • 20.
    Known: r = 0.8646 n= 15 Determine the Test Statistics: Testing the Significance of the Correlation Coefficient
  • 21.
    Determine the CriticalValue: df = n - 2 = 15 - 2 = 13 Testing the Significance of the Correlation Coefficient Image from : Lind, Douglas A., Marchal, William G., Wathen, Samuel A., 2021
  • 22.
    Determine the CriticalValue: Testing the Significance of the Correlation Coefficient Image from : Lind, Douglas A., Marchal, William G., Wathen, Samuel A., 2021
  • 23.
    Make Decision: Test Statistics: 6.205088676 Critical Value : ±2.160 6.2051 > 2.160 → (+) Test statistics > (+) Critical value Reject H0 Testing the Significance of the Correlation Coefficient
  • 24.
    Interpretation: With 𝛼 =5%, there is correlation with respect to the number of sales calls made and the number of copiers sold in the population of salespeople. Testing the Significance of the Correlation Coefficient
  • 25.
    Testing the Significanceof the Correlation Coefficient Make Decision: Test Statistics : 6.205088676 Check the Result from Data Analysis in GSheets / Excel:
  • 26.
    How if theSales Manager wants to know could there be a positive correlation in the population from which the sample was selected? Testing the Significance of the Correlation Coefficient
  • 27.
    Testing the Significanceof the Correlation Coefficient 01 13 - Correlation & Linear Regression 2 Testing the Significance of the Regression Equation 02
  • 28.
    ● Y’ =19,98 + 0,2606 x ● This is the regression equation of the sample. ● How about the regression equation of the population? Testing the Significance of the Regression Equation
  • 29.
    ● Y’ =19,98 + 0,2606 x ● We identified the intercept value as a. ● We use “A” to represent the population intercept. Testing the Significance of the Intercept
  • 30.
    Where: ● a =sample intercept ● A = population intercept ● sa = the standard error of the intercept estimate Testing the Significance of the Intercept
  • 31.
    Testing the Significanceof the Intercept
  • 32.
    the Sales Managerwants to know could the intercept in the population is not 0 from which the sample was selected? Develop the Hypothesis: ● H0 : A = 0 → The slope in the population is zero. ● H1 : A ≠ 0 → The slope in the population is different from zero. Testing the Significance of the Intercept
  • 33.
    Known: a = 19.98 sa= 4.38967553266198 Determine the Test Statistics: Testing the Significance of the Intercept
  • 34.
    Determine the CriticalValue: df = n - 2 = 15 - 2 = 13 Image from : Lind, Douglas A., Marchal, William G., Wathen, Samuel A., 2021 Testing the Significance of the Intercept
  • 35.
    Make Decision: Test Statistics: 4.551589258 Critical Value : ±2.160 4.552 > 2.160 → (+) Test statistics > (+) Critical value Reject H0 Testing the Significance of the Intercept
  • 36.
    Interpretation: With 𝛼 =5%, the intercept of the number of sales calls made and the number of copiers sold in the population of salespeople is significant. Testing the Significance of the Intercept
  • 37.
    ● Y’ =19,98 + 0,2606 x ● We identified the slope (kemiringan) value as b. ● We use “β” to represent the population slope. Testing the Significance of the Slope
  • 38.
    Develop the Hypothesis: ●H0 : β = 0 → The slope in the population is zero. The regression line is horizontal and there is no relationship between the independent variable (X) and dependent variable (Y). ● H1 : β ≠ 0 → The slope in the population is different from zero. Testing the Significance of the Slope
  • 39.
  • 40.
  • 41.
    the Sales Managerwants to know could there be a positive slope in the population from which the sample was selected? Develop the Hypothesis: ● H0 : β <= 0 → The slope in the population is zero. ● H1 : β > 0 → The slope in the population is different from zero. Testing the Significance of the Slope
  • 42.
    Known: b = 0.260625 sb= 0.0420018171539133 Determine the Test Statistics: Testing the Significance of the Slope
  • 43.
    Determine the CriticalValue: df = n - 2 = 15 - 2 = 13 Image from : Lind, Douglas A., Marchal, William G., Wathen, Samuel A., 2021 Testing the Significance of the Slope
  • 44.
    Make Decision: Test Statistics: 6.205088676 Critical Value : 1.771 6.2051 > 1.771 → (+) Test statistics > (+) Critical value Reject H0 Testing the Significance of the Slope
  • 45.
    Interpretation: With 𝛼 =5%, the slope of the number of sales calls made and the number of copiers sold in the population of salespeople is positive / significant. Testing the Significance of the Slope
  • 46.
    Testing the Significanceof the Slope & Intercept
  • 47.
    Y’ = 19.98+ 0.2606 X (Number of products sold) = 19.98 + 0.2606 (number of sales calls) Is the regression equation is a good predictor? Finding the exact outcome is practically impossible. Therefore, we know the standard error of estimate. Standard Error of Estimate is a measure of dispersion of the observed values around the line of regression. Standard Error of Estimate
  • 48.
  • 49.
  • 50.
    The interval ofestimated value of products sold (Y) could be determined by calculating the upper and lower bound. Interval Y’ = Y’ ± sy.x Standard Error of Estimate
  • 51.
  • 52.
    Interval of theIntercept & Slope
  • 53.
    The proportion ofthe total variation in the dependent variable Y that is explained by the variation in the independent variable X. Symbol : r^2 (R Square) The Coefficient of Determination
  • 54.
    The Coefficient ofDetermination
  • 55.
    r square =0.7475 Interpretation: 74.75% variance of products sold has been explained by sales calls. The other 25.25% could be explained by other factors. The Coefficient of Determination
  • 56.
  • 57.
    References Lind, Douglas A.,Marchal, William G., Wathen, Samuel A.. (2021). Statistical techniques in business & economics
  • 58.
    Present Form -System Pada bagian komentar silahkan isi: 1. Hal yang saya pelajari hari ini. 2.Hal menarik dari perkuliahan hari ini. 3.Hal yang masih ingin saya cari tahu setelah perkuliahan ini. 4.Saran.
  • 59.
    CREDITS: This presentationtemplate was created by Slidesgo, and includes icons by Flaticon, and infographics & images by Freepik Thanks! Any questions? Please keep this slide for attribution