Content:
1. Overview ofgreenhouse sector in Bulgaria
2. Energy as a production factor
3. Geothermal map
4. Greenhouse map
5. Geothermal-heated showcases
6. SWOT
8. Contacts
3.
1. Overview ofthe greenhouse sector in Bulgaria
Key takeaways:
- Bulgaria has traditions in greenhouse production of vegetables, the
focus being tomatoes and cucumbers.
- Local off-season production faces strong competition from Greece and
Türkiye, where costs are lower due to milder climate.
- The business is endangered by high energy costs. A substantial effort is
needed to decrease the share of heating in total production costs to
increase competitiveness.
4.
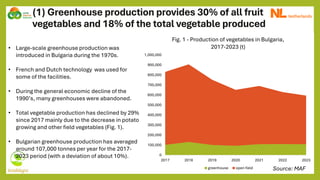
(1) Greenhouse productionprovides 30% of all fruit
vegetables and 18% of the total vegetable produced
0
100,000
200,000
300,000
400,000
500,000
600,000
700,000
800,000
900,000
1,000,000
2017 2018 2019 2020 2021 2022 2023
Fig. 1 - Production of vegetables in Bulgaria,
2017-2023 (t)
greenhouse open field
• Large-scale greenhouse production was
introduced in Bulgaria during the 1970s.
• French and Dutch technology was used for
some of the facilities.
• During the general economic decline of the
1990’s, many greenhouses were abandoned.
• Total vegetable production has declined by 29%
since 2017 mainly due to the decrease in potato
growing and other field vegetables (Fig. 1).
• Bulgarian greenhouse production has averaged
around 107,000 tonnes per year for the 2017-
2023 period (with a deviation of about 10%).
Source: MAF
5.
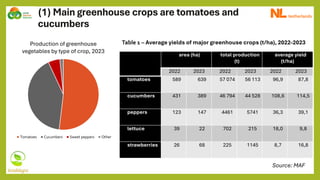
(1) Main greenhousecrops are tomatoes and
cucumbers
area (ha) total production
(t)
average yield
(t/ha)
2022 2023 2022 2023 2022 2023
tomatoes 589 639 57 074 56 113 96,9 87,8
cucumbers 431 389 46 794 44 528 108,6 114,5
peppers 123 147 4461 5741 36,3 39,1
lettuce 39 22 702 215 18,0 9,8
strawberries 26 68 225 1145 8,7 16,8
Production of greenhouse
vegetables by type of crop, 2023
Tomatoes Cucumbers Sweet peppers Other
Source: MAF
Table 1 – Average yields of major greenhouse crops (t/ha), 2022-2023
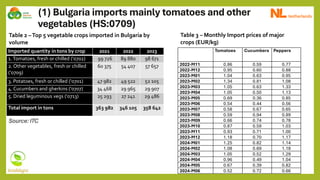
(1) Import ismainly off-season (November-April)
• Rapidly growing market –
EUR 57M in 2018 to EUR103
M in 2024.
• Highest numbers both in
volume and value are in
tomatoes (incl. cherry
tomatoes).
• Bell peppers and cucumbers
are the next high-value crops
with good off-season market
prospects.
Source: Eurostat
0
2,000,000
4,000,000
6,000,000
8,000,000
10,000,000
12,000,000
2018-06
2018-09
2018-12
2019-03
2019-06
2019-09
2019-12
2020-03
2020-06
2020-09
2020-12
2021-03
2021-06
2021-09
2021-12
2022-03
2022-06
2022-09
2022-12
2023-03
2023-06
2023-09
2023-12
2024-03
Fig. – 3 Seasonal Import of fresh vegetables (€), Jun 2018 – Apr
2024.
Tomatoes Lettuce and chicory Cucumbers and gherkins
Aubergines or "eggplants" Sweet peppers Courgettes
Strawberries
8.
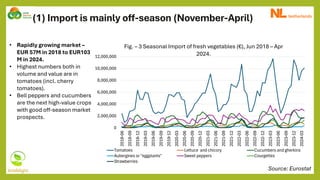
2. Energy asa production factor
Key takeaways:
- High energy costs can be a setback for production in a region that
borders competitors with milder climate.
- While biomass is probably used more often than any other source of
green energy, its competitive advantages are somewhat questionable.
- Geothermal energy can provide a low-cost alternative, depending on the
size of the initial investment.
9.
(2) Heating necessitiesand solutions
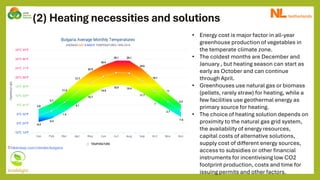
• Energy cost is major factor in all-year
greenhouse production of vegetables in
the temperate climate zone.
• The coldest months are December and
January , but heating season can start as
early as October and can continue
through April.
• Greenhouses use natural gas or biomass
(pellets, rarely straw) for heating, while a
few facilities use geothermal energy as
primary source for heating.
• The choice of heating solution depends on
proximity to the natural gas grid system,
the availability of energy resources,
capital costs of alternative solutions,
supply cost of different energy sources,
access to subsidies or other financial
instruments for incentivising low CO2
footprint production, costs and time for
issuing permits and other factors.
10.
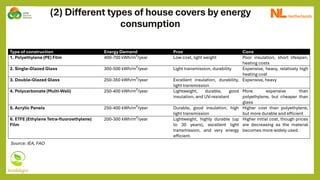
(2) Different typesof house covers by energy
consumption
Source: IEA, FAO
Type of construction Energy Demand Pros Cons
1. Polyethylene (PE) Film 400-700 kWh/m²/year Low cost, light weight Poor insulation, short lifespan,
heating costs
2. Single-Glazed Glass 300-500 kWh/m²/year Light transmission, durability Expensive, heavy, relatively high
heating cost
3. Double-Glazed Glass 250-350 kWh/m²/year Excellent insulation, durability,
light transmission
Expensive, heavy
4. Polycarbonate (Multi-Wall) 250-400 kWh/m²/year Lightweight, durable, good
insulation, and UV-resistant
More expensive than
polyethylene, but cheaper than
glass
5. Acrylic Panels 250-400 kWh/m²/year Durable, good insulation, high
light transmission
Higher cost than polyethylene,
but more durable and efficient
6. ETFE (Ethylene Tetra-fluoroethylene)
Film
200-300 kWh/m²/year Lightweight, highly durable (up
to 30 years), excellent light
transmission, and very energy
efficient.
Higher initial cost, though prices
are decreasing as the material
becomes more widely used.
11.
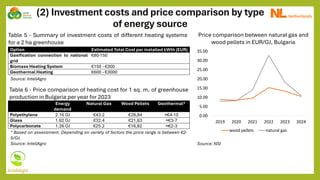
(2) Investment costsand price comparison by type
of energy source
Option Estimated Total Cost per installed kWth (EUR)
Gasification connection to national
grid
€80-150
Biomass Heating System €150 - €300
Geothermal Heating €600 - €3000
Source: InteliAgro
Table 5 - Summary of investment costs of different heating systems
for a 2 ha greenhouse
Energy
demand
Natural Gas Wood Pellets Geothermal*
Polyethylene 2.16 GJ €43.2 €28,84 ≈€4-10
Glass 1.62 GJ €32.4 €21,63 ≈€3-7
Polycarbonate 1.26 GJ €25.2 €16,82 ≈€2-3
* Based on assessment. Depending on variety of factors the price range is between €2-
5/GJ.
Source: InteliAgro
Table 6 - Price comparison of heating cost for 1 sq. m. of greenhouse
production in Bulgaria per year for 2023
0.00
5.00
10.00
15.00
20.00
25.00
30.00
35.00
2019 2020 2021 2022 2023 2024
wood pellets natural gas
Source: NSI
Price comparison between natural gas and
wood pellets in EUR/GJ, Bulgaria
12.
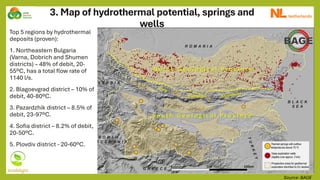
3. Map ofhydrothermal potential, springs and
wells
Source: BAGE
Top 5 regions by hydrothermal
deposits (proven):
1. Northeastern Bulgaria
(Varna, Dobrich and Shumen
districts) – 48% of debit, 20-
55ºС, has a total flow rate of
1140 l/s.
2. Blagoevgrad district – 10% of
debit, 40-80ºС.
3. Pazardzhik district – 8.5% of
debit, 23-97ºС.
4. Sofia district – 8.2% of debit,
20-50ºС.
5. Plovdiv district - 20-60ºС.
13.
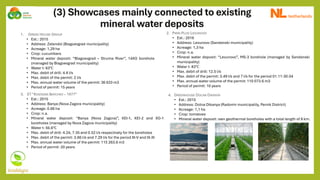
(3) Showcases mainlyconnected to existing
mineral water deposits
1. GREEN HOUSE GROUP
• Est.: 2015
• Address: Zelendol (Blagoevgrad municipality)
• Acreage: 1,29 ha
• Crop: cucumbers
• Mineral water deposit: “Blagoevgrad – Struma River”, 14XG borehole
(managed by Blagoevgrad municipality)
• Water t: 63℃
• Max. debit of drill: 4.8 l/s
• Max. debit of the permit: 2 l/s
• Max. annual water volume of the permit: 36 633 m3
• Period of permit: 15 years
2. PIRIN PLOD LEVUNOVO
• Est.: 2016
• Address: Levunovo (Sandanski municipality)
• Acreage: 1,3 ha
• Crop: n.a.
• Mineral water deposit: “Levunovo”, MS-3 borehole (managed by Sandanski
municipality)
• Water t: 83℃
• Max. debit of drill: 12.5 l/s
• Max. debit of the permit: 3.49 l/s and 7 l/s for the period 01.11-30.04
• Max. annual water volume of the permit: 110 073.6 m3
• Period of permit: 10 years
3. ET “KOSTADIN BAYCHEV – 1977”
• Est.: 2015
• Address: Banya (Nova Zagora municipality)
• Acreage: 0.66 ha
• Crop: n.a.
• Mineral water deposit: “Banya (Nova Zagora)”, KEI-1, KEI-2 and XG-1
boreholes (managed by Nova Zagora municipality)
• Water t: 56.6℃
• Max. debit of drill: 4.24, 7.35 and 0.52 l/s respectively for the boreholes
• Max. debit of the permit: 3.66 l/s and 7.29 l/s for the period III-V and IX-XI
• Max. annual water volume of the permit: 115 263.6 m3
• Period of permit: 20 years
4. GREENHOUSE DOLNA DIKANYA
• Est.: 2015
• Address: Dolna Dikanya (Radomir municipality, Pernik District)
• Acreage: 1,1 ha
• Crop: tomatoes
• Mineral water deposit: own geothermal boreholes with a total length of 8 km.
14.
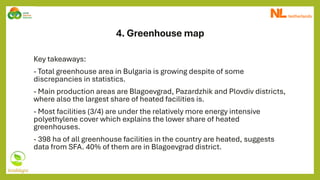
4. Greenhouse map
Keytakeaways:
- Total greenhouse area in Bulgaria is growing despite of some
discrepancies in statistics.
- Main production areas are Blagoevgrad, Pazardzhik and Plovdiv districts,
where also the largest share of heated facilities is.
- Most facilities (3/4) are under the relatively more energy intensive
polyethylene cover which explains the lower share of heated
greenhouses.
- 398 ha of all greenhouse facilities in the country are heated, suggests
data from SFA. 40% of them are in Blagoevgrad district.
15.
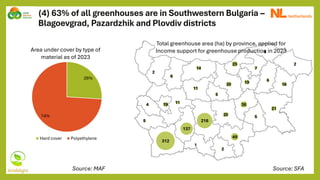
(4) 63% ofall greenhouses are in Southwestern Bulgaria –
Blagoevgrad, Pazardzhik and Plovdiv districts
Source: SFA
312
21
16
20
6
5
2
2
5
11
2
137
4
14
216
7
25
4
36
1
11
19
20
19
49
6
5
Total greenhouse area (ha) by province, applied for
Income support for greenhouse production in 2023
26%
74%
Area under cover by type of
material as of 2023
Hard cover Polyethylene
Source: MAF
16.
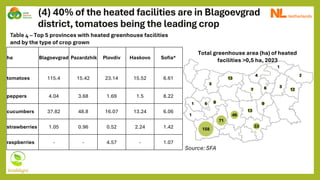
(4) 40% ofthe heated facilities are in Blagoevgrad
district, tomatoes being the leading crop
Source: SFA
Table 4 – Top 5 provinces with heated greenhouse facilities
and by the type of crop grown
158
12
7
3
2
1
71
1
13
46
4
1
9
8
5
13
6
33
3
Total greenhouse area (ha) of heated
facilities >0,5 ha, 2023
ha Blagoevgrad Pazardzhik Plovdiv Haskovo Sofia*
tomatoes 115.4 15.42 23.14 15.52 6.61
peppers 4.04 3.68 1.69 1.5 8.22
cucumbers 37.82 48.8 16.07 13.24 6.06
strawberries 1.05 0.96 0.52 2.24 1.42
raspberries - - 4.57 - 1.07
17.
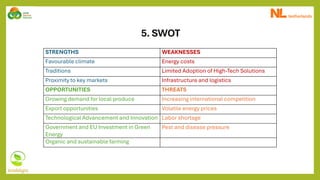
5. SWOT
STRENGTHS WEAKNESSES
Favourableclimate Energy costs
Traditions Limited Adoption of High-Tech Solutions
Proximity to key markets Infrastructure and logistics
OPPORTUNITIES THREATS
Growing demand for local produce Increasing international competition
Export opportunities Volatile energy prices
Technological Advancement and Innovation Labor shortage
Government and EU Investment in Green
Energy
Pest and disease pressure
Organic and sustainable farming
18.
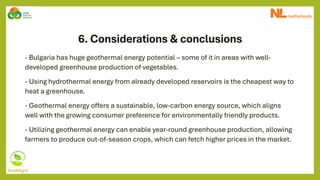
6. Considerations &conclusions
- Bulgaria has huge geothermal energy potential – some of it in areas with well-
developed greenhouse production of vegetables.
- Using hydrothermal energy from already developed reservoirs is the cheapest way to
heat a greenhouse.
- Geothermal energy offers a sustainable, low-carbon energy source, which aligns
well with the growing consumer preference for environmentally friendly products.
- Utilizing geothermal energy can enable year-round greenhouse production, allowing
farmers to produce out-of-season crops, which can fetch higher prices in the market.