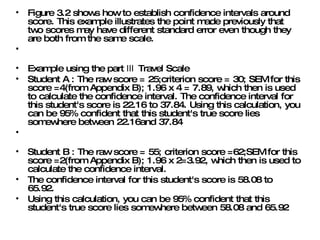
Determining standard error values and using confidence intervals  Standard error values represent the standard error of measurement (SEM) for particular score, or the extent to which the score may be expected to vary if one were to test the student repeatedly. In many standardized tests, a single standard error values is applied to all possible scores. In contrast, the IRT methodology used to develop the SFA provides a standard error values for each possible criterion score. These values can be used to construct a confidence interval around each criterion score. Confidence interval around the score. The lower and of the interval is established by subtracting 1.96 times the standard error from the criterion score, and the upper and of the interval is established by adding 1.96 times the standard error to the criterion score.
Figure 3.2 shows how to establish confidence intervals around score. This example illustrates the point made previously that two scores may have different standard error even though they are both from the same scale.  Example using the part Ⅲ Travel Scale  Student A : The raw score = 25;criterion score = 30; SEM for this score =4(from Appendix B); 1.96 x 4 = 7.89, which then is used to calculate the confidence interval. The confidence interval for this student's score is 22.16 to 37.84. Using this calculation, you can be 95% confident that this student's true score lies somewhere between 22.16and 37.84  Student B : The raw score = 55; criterion score =62;SEM for this score =2(from Appendix B); 1.96 x 2=3.92, which then is used to calculate the confidence interval.  The confidence interval for this student's score is 58.08 to 65.92.  Using this calculation, you can be 95% confident that this student's true score lies somewhere between 58.08 and 65.92

평가도구피피티

  • 1.
  • 2.
    Determining standard errorvalues and using confidence intervals Standard error values represent the standard error of measurement (SEM) for particular score, or the extent to which the score may be expected to vary if one were to test the student repeatedly. In many standardized tests, a single standard error values is applied to all possible scores. In contrast, the IRT methodology used to develop the SFA provides a standard error values for each possible criterion score. These values can be used to construct a confidence interval around each criterion score. Confidence interval around the score. The lower and of the interval is established by subtracting 1.96 times the standard error from the criterion score, and the upper and of the interval is established by adding 1.96 times the standard error to the criterion score.
  • 3.
    Figure 3.2 showshow to establish confidence intervals around score. This example illustrates the point made previously that two scores may have different standard error even though they are both from the same scale. Example using the part Ⅲ Travel Scale Student A : The raw score = 25;criterion score = 30; SEM for this score =4(from Appendix B); 1.96 x 4 = 7.89, which then is used to calculate the confidence interval. The confidence interval for this student's score is 22.16 to 37.84. Using this calculation, you can be 95% confident that this student's true score lies somewhere between 22.16and 37.84 Student B : The raw score = 55; criterion score =62;SEM for this score =2(from Appendix B); 1.96 x 2=3.92, which then is used to calculate the confidence interval. The confidence interval for this student's score is 58.08 to 65.92. Using this calculation, you can be 95% confident that this student's true score lies somewhere between 58.08 and 65.92