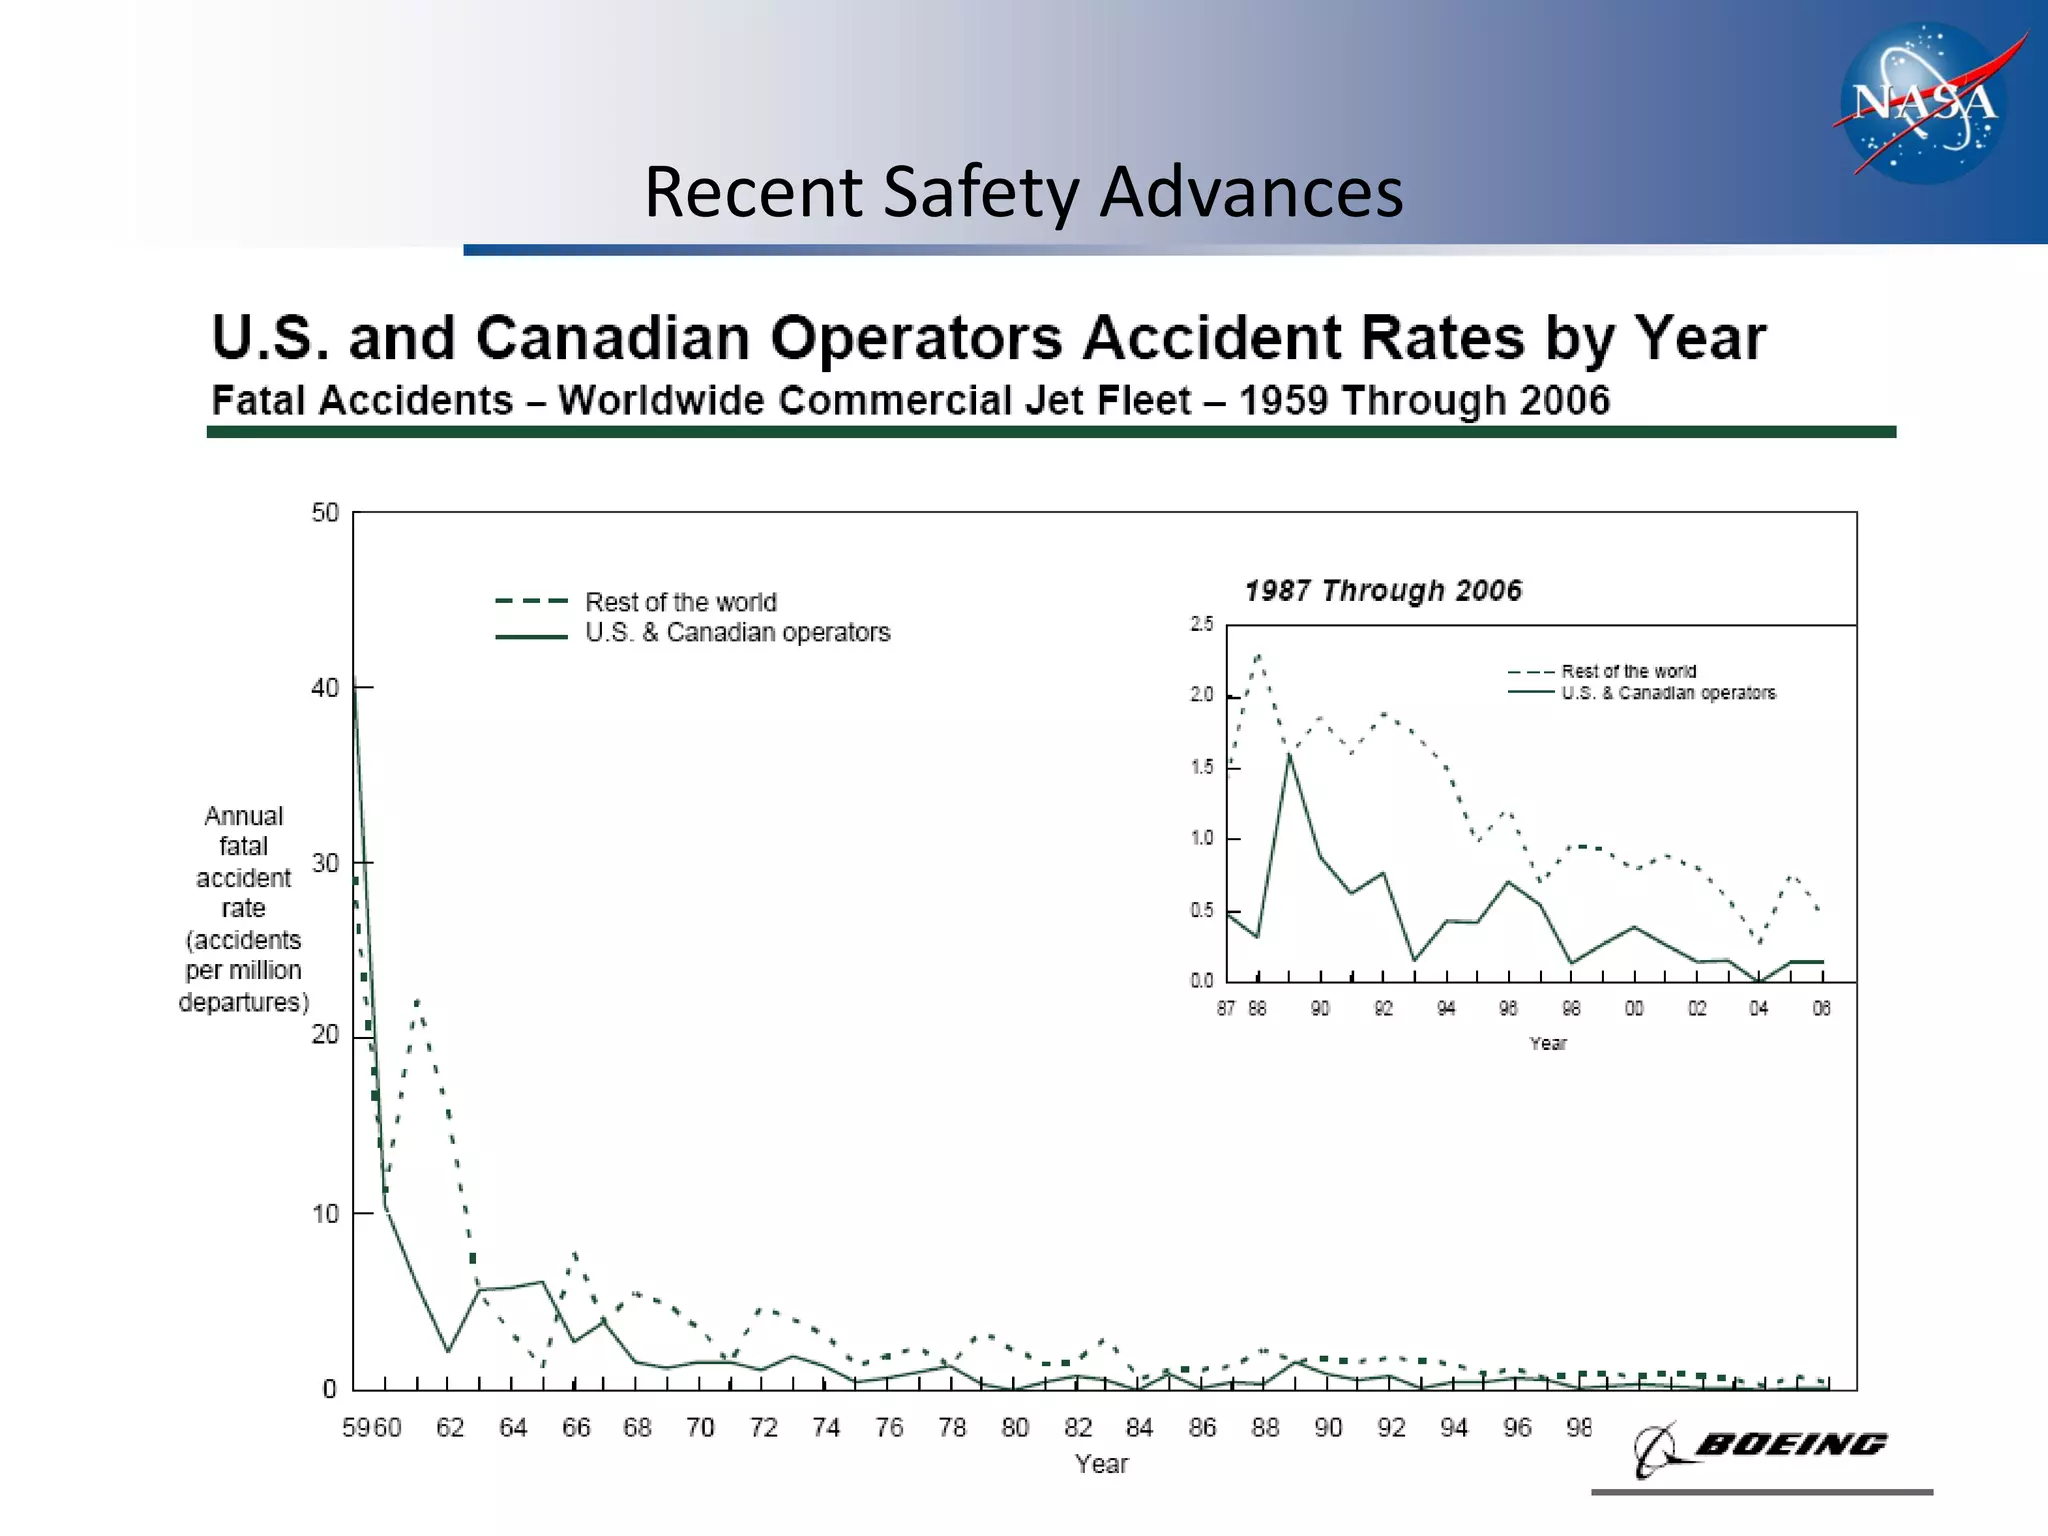
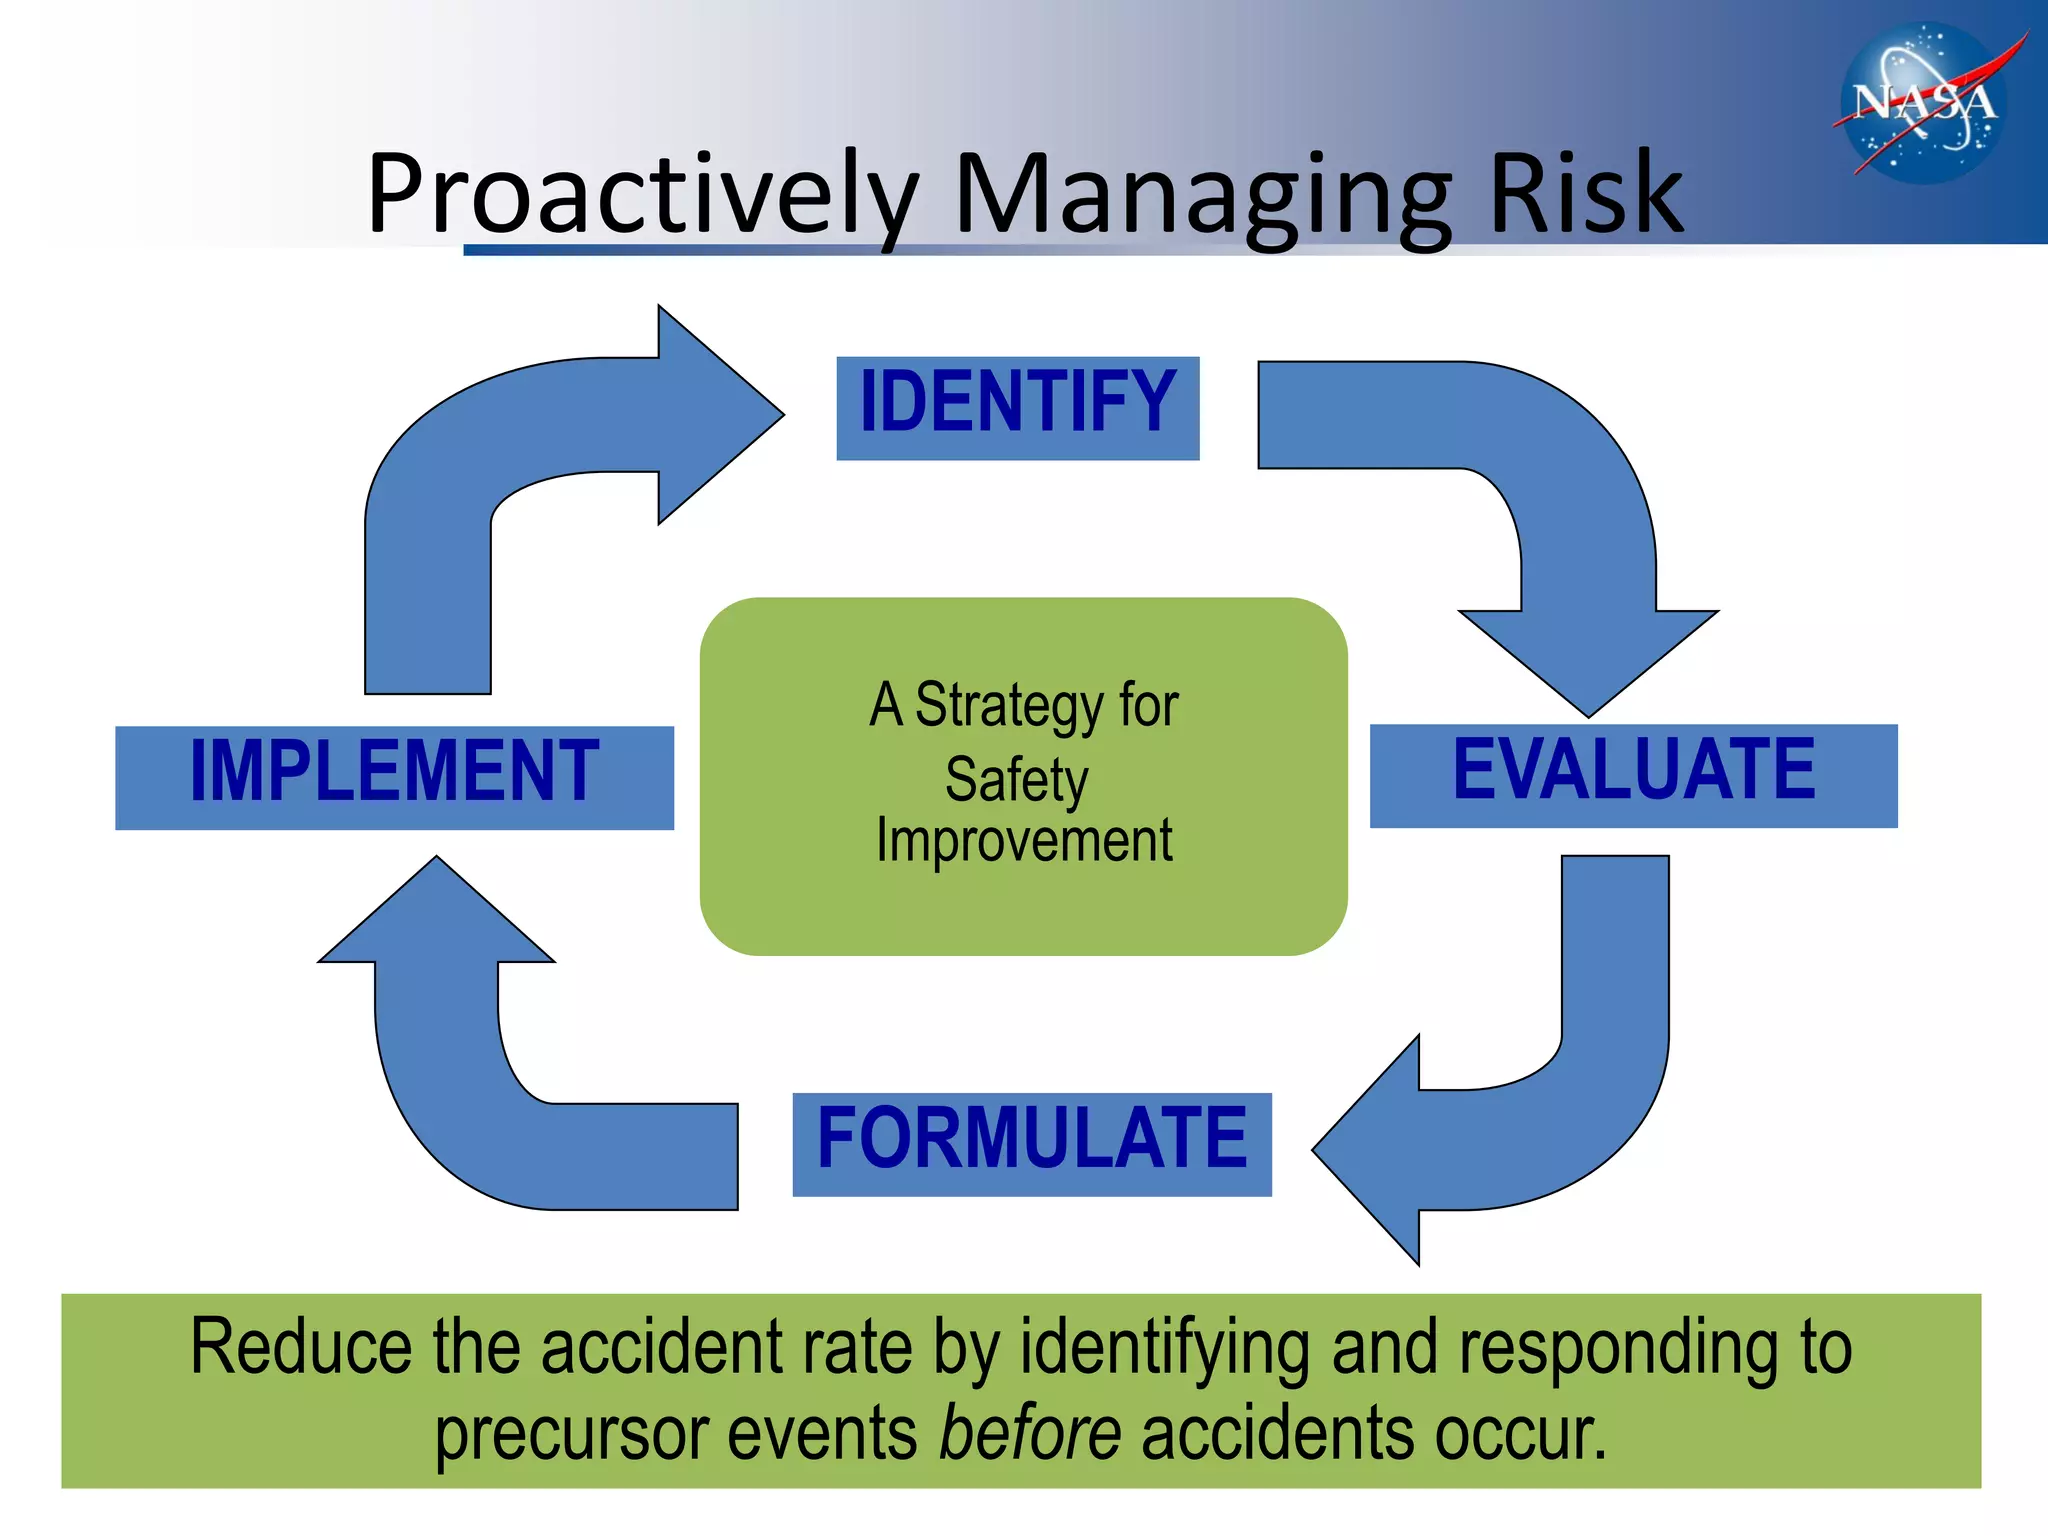
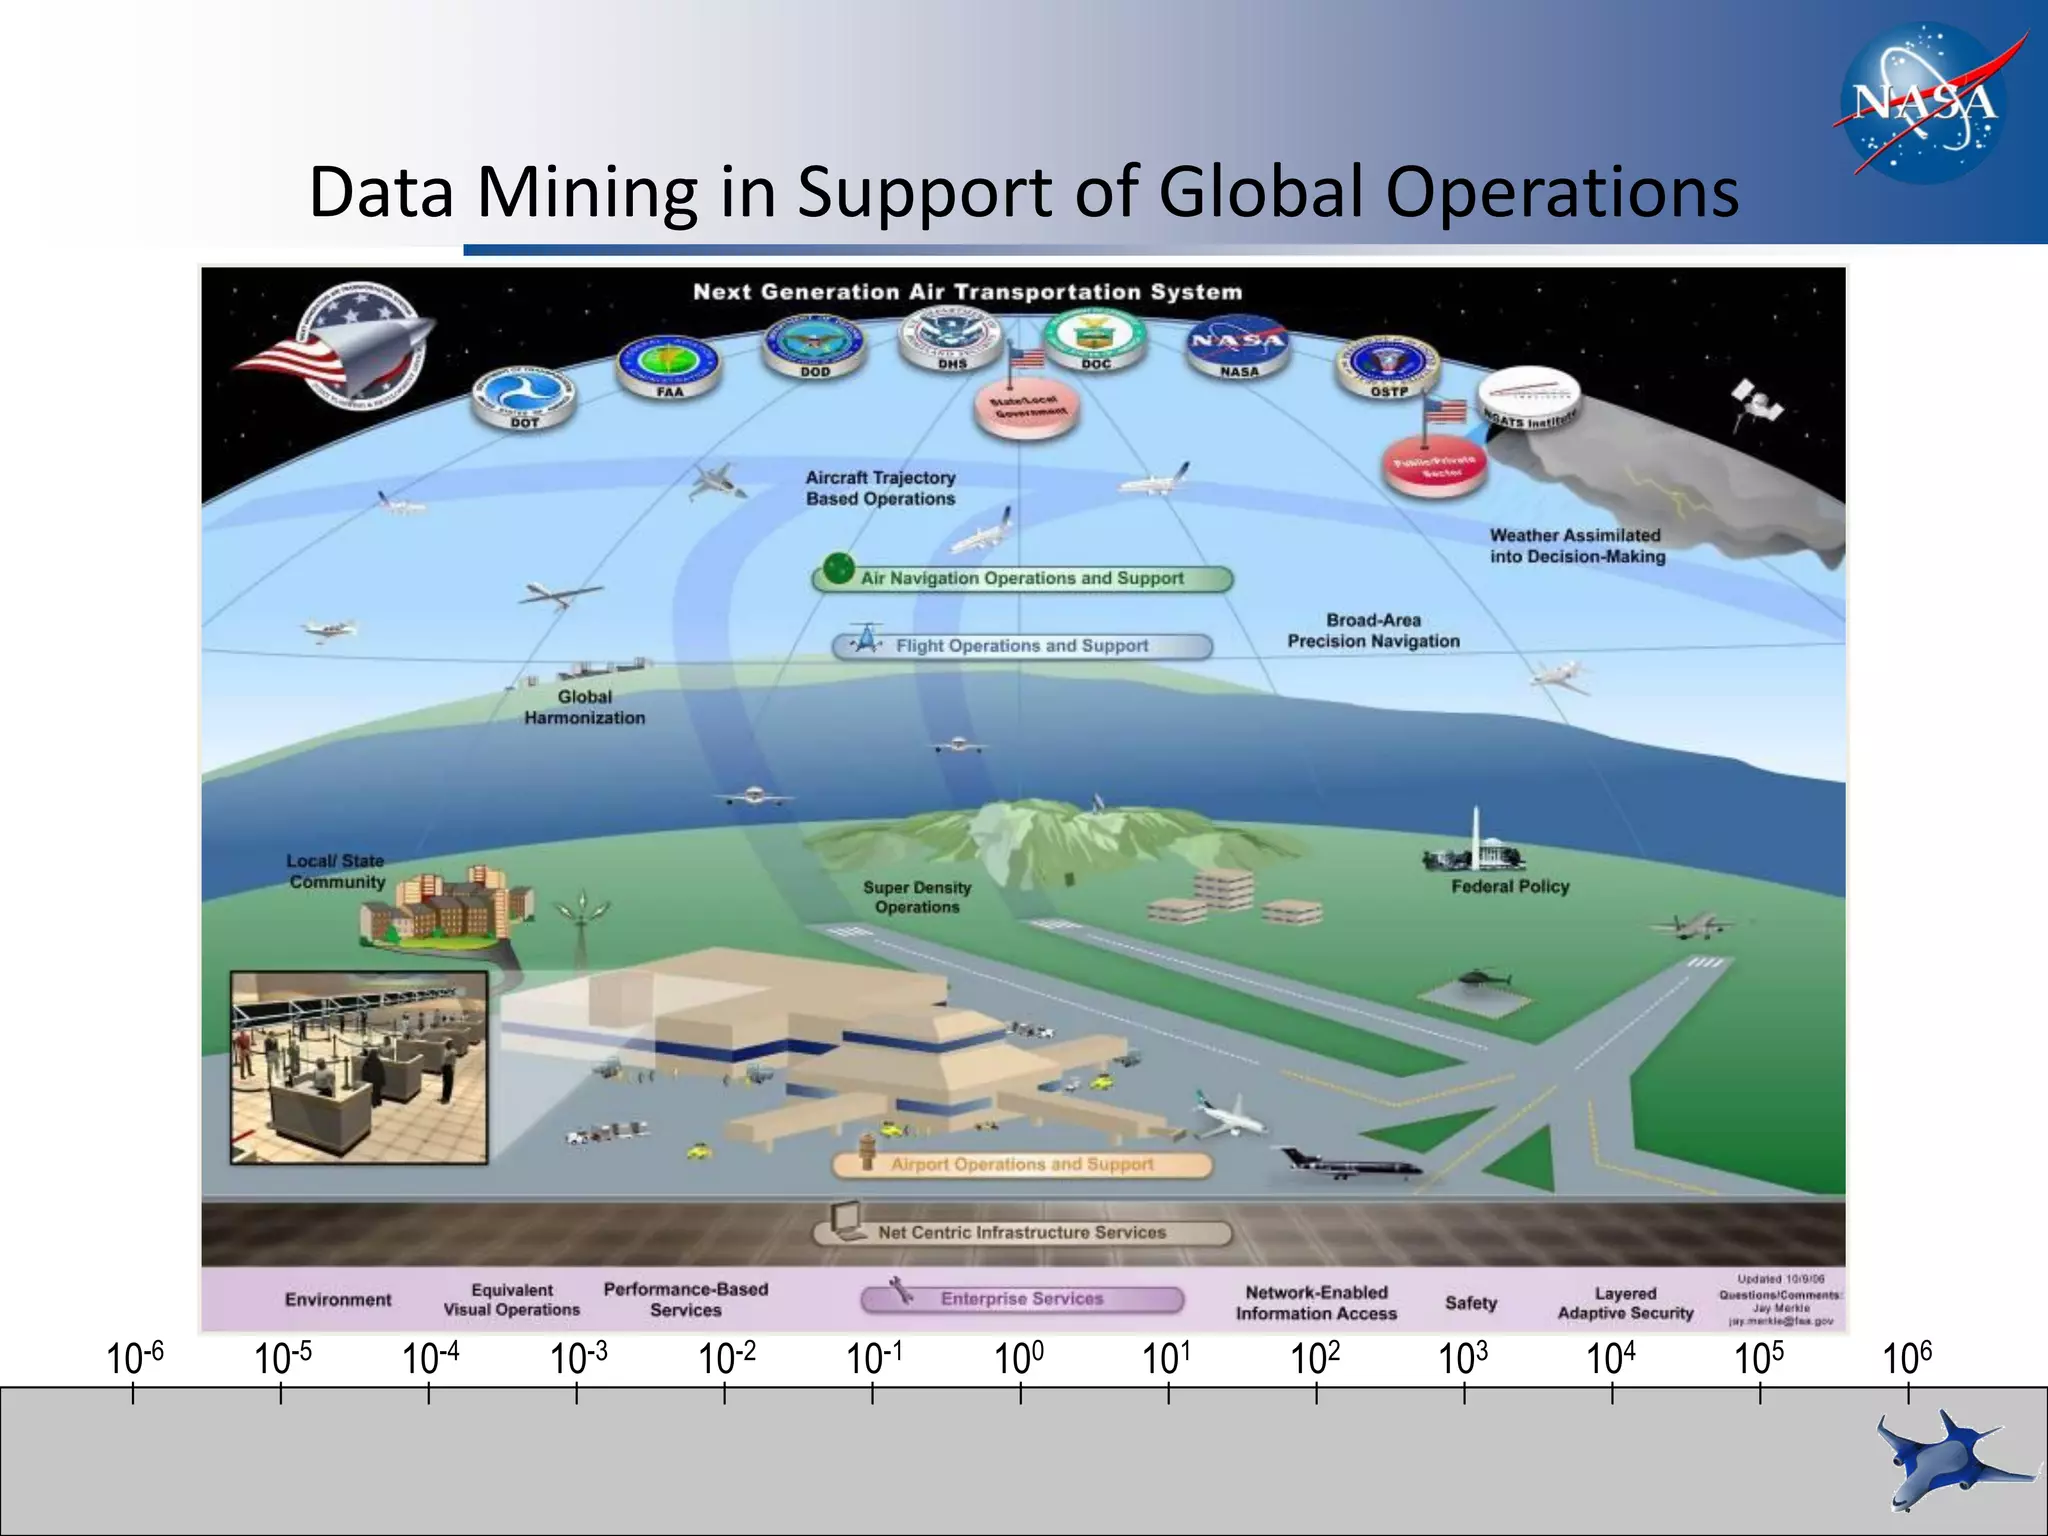
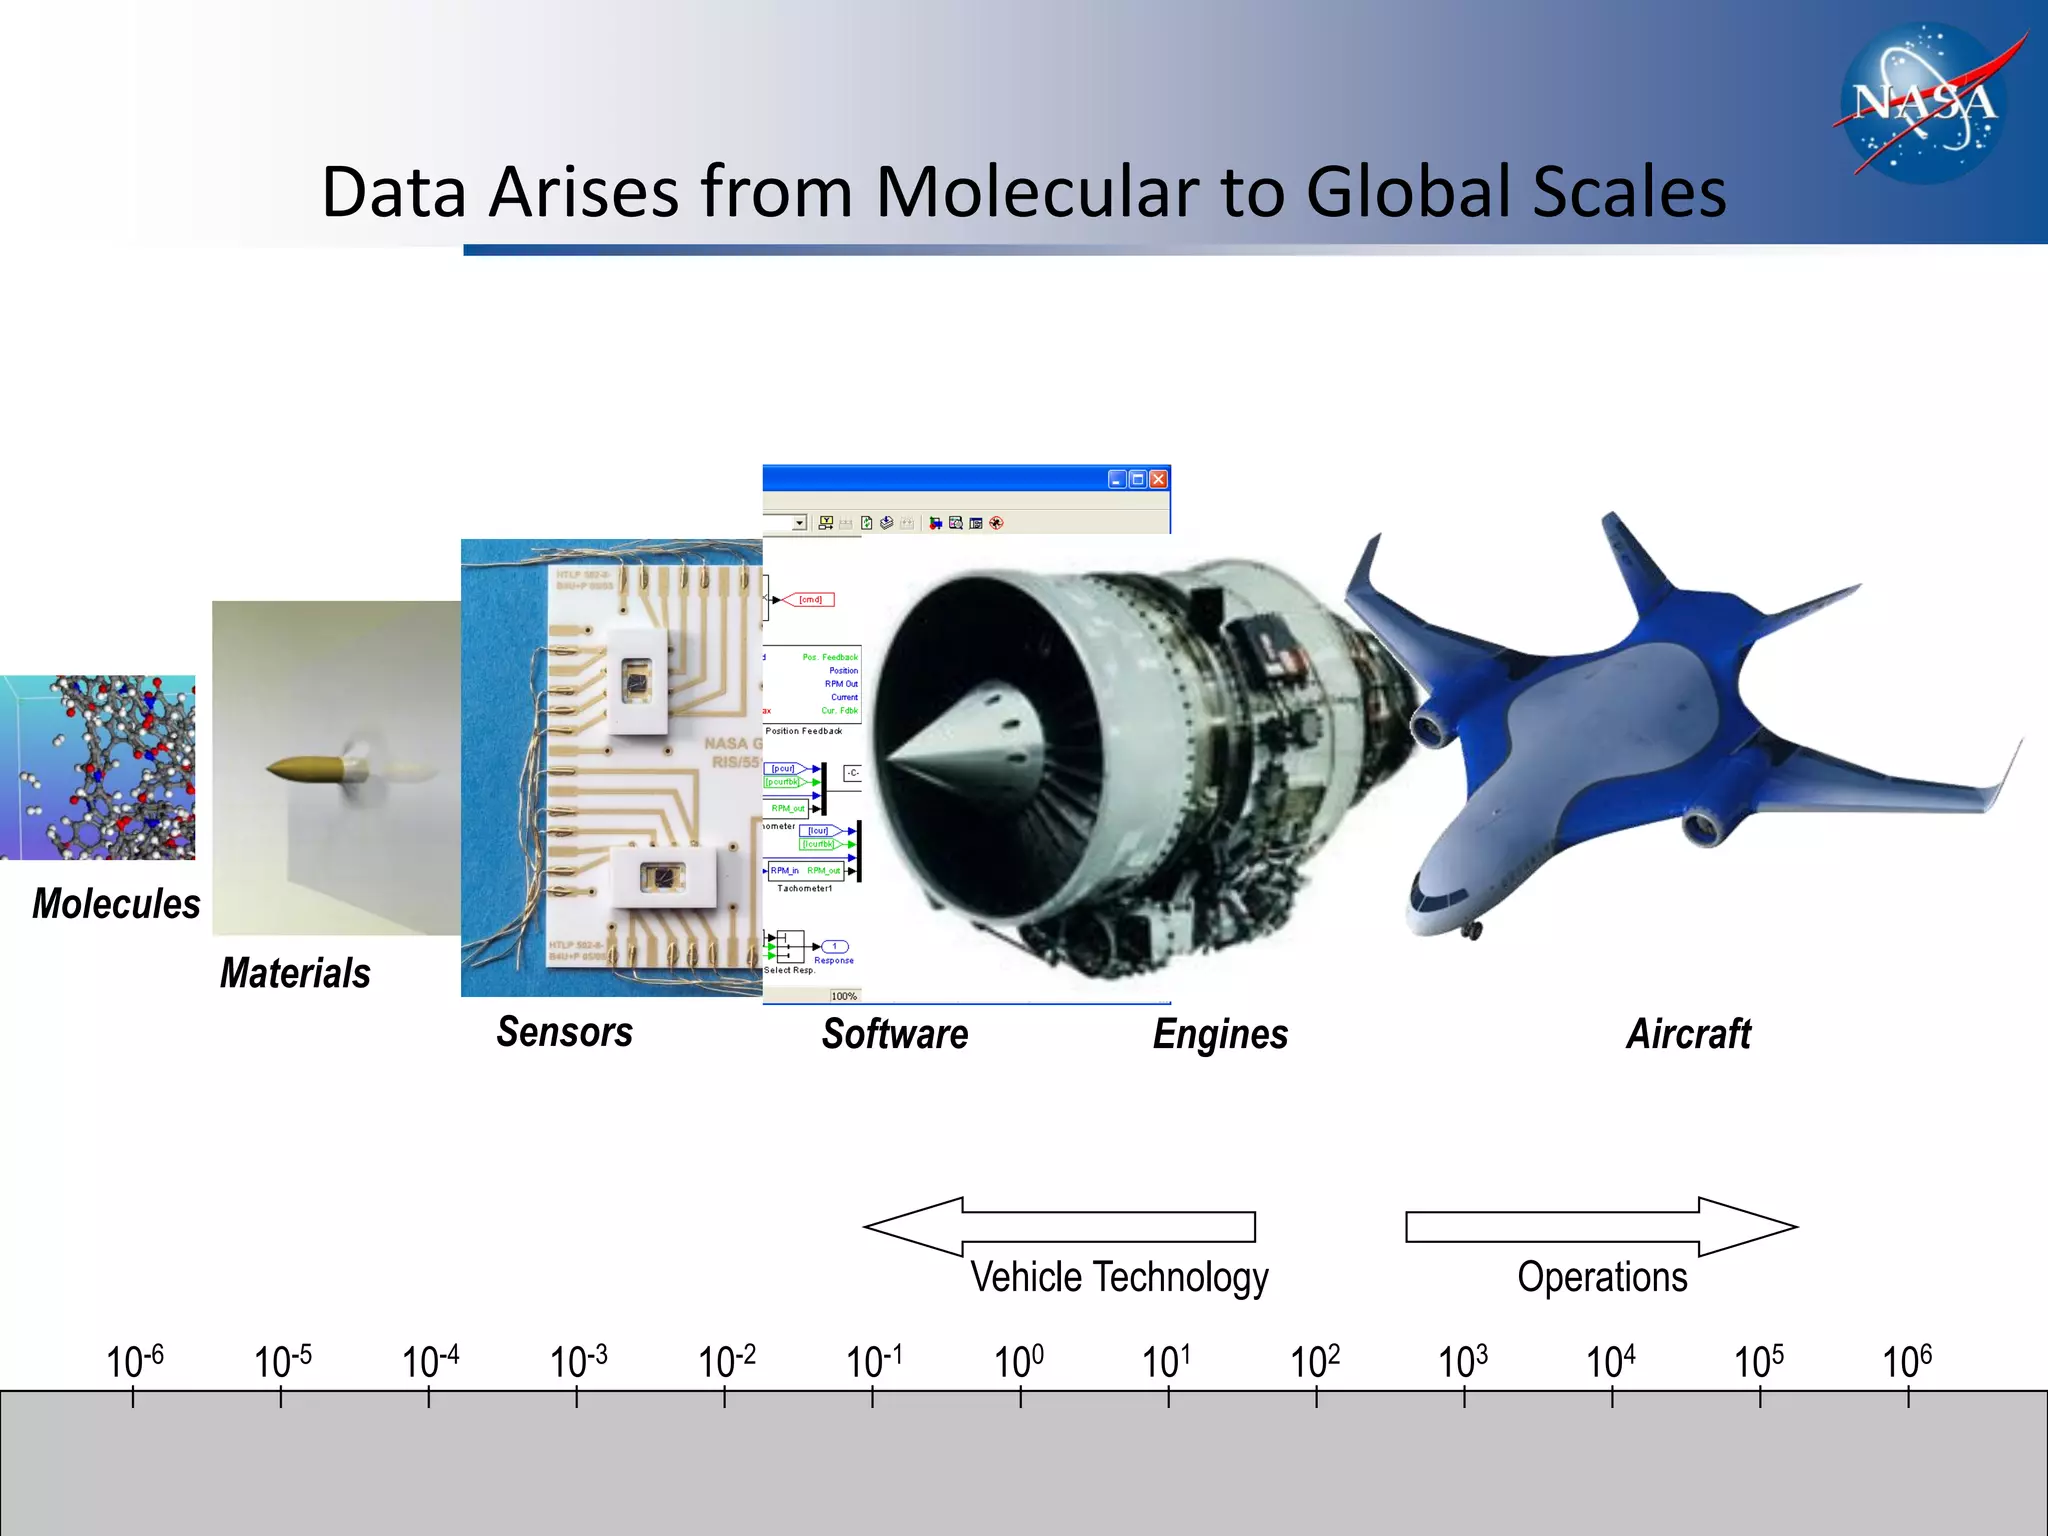
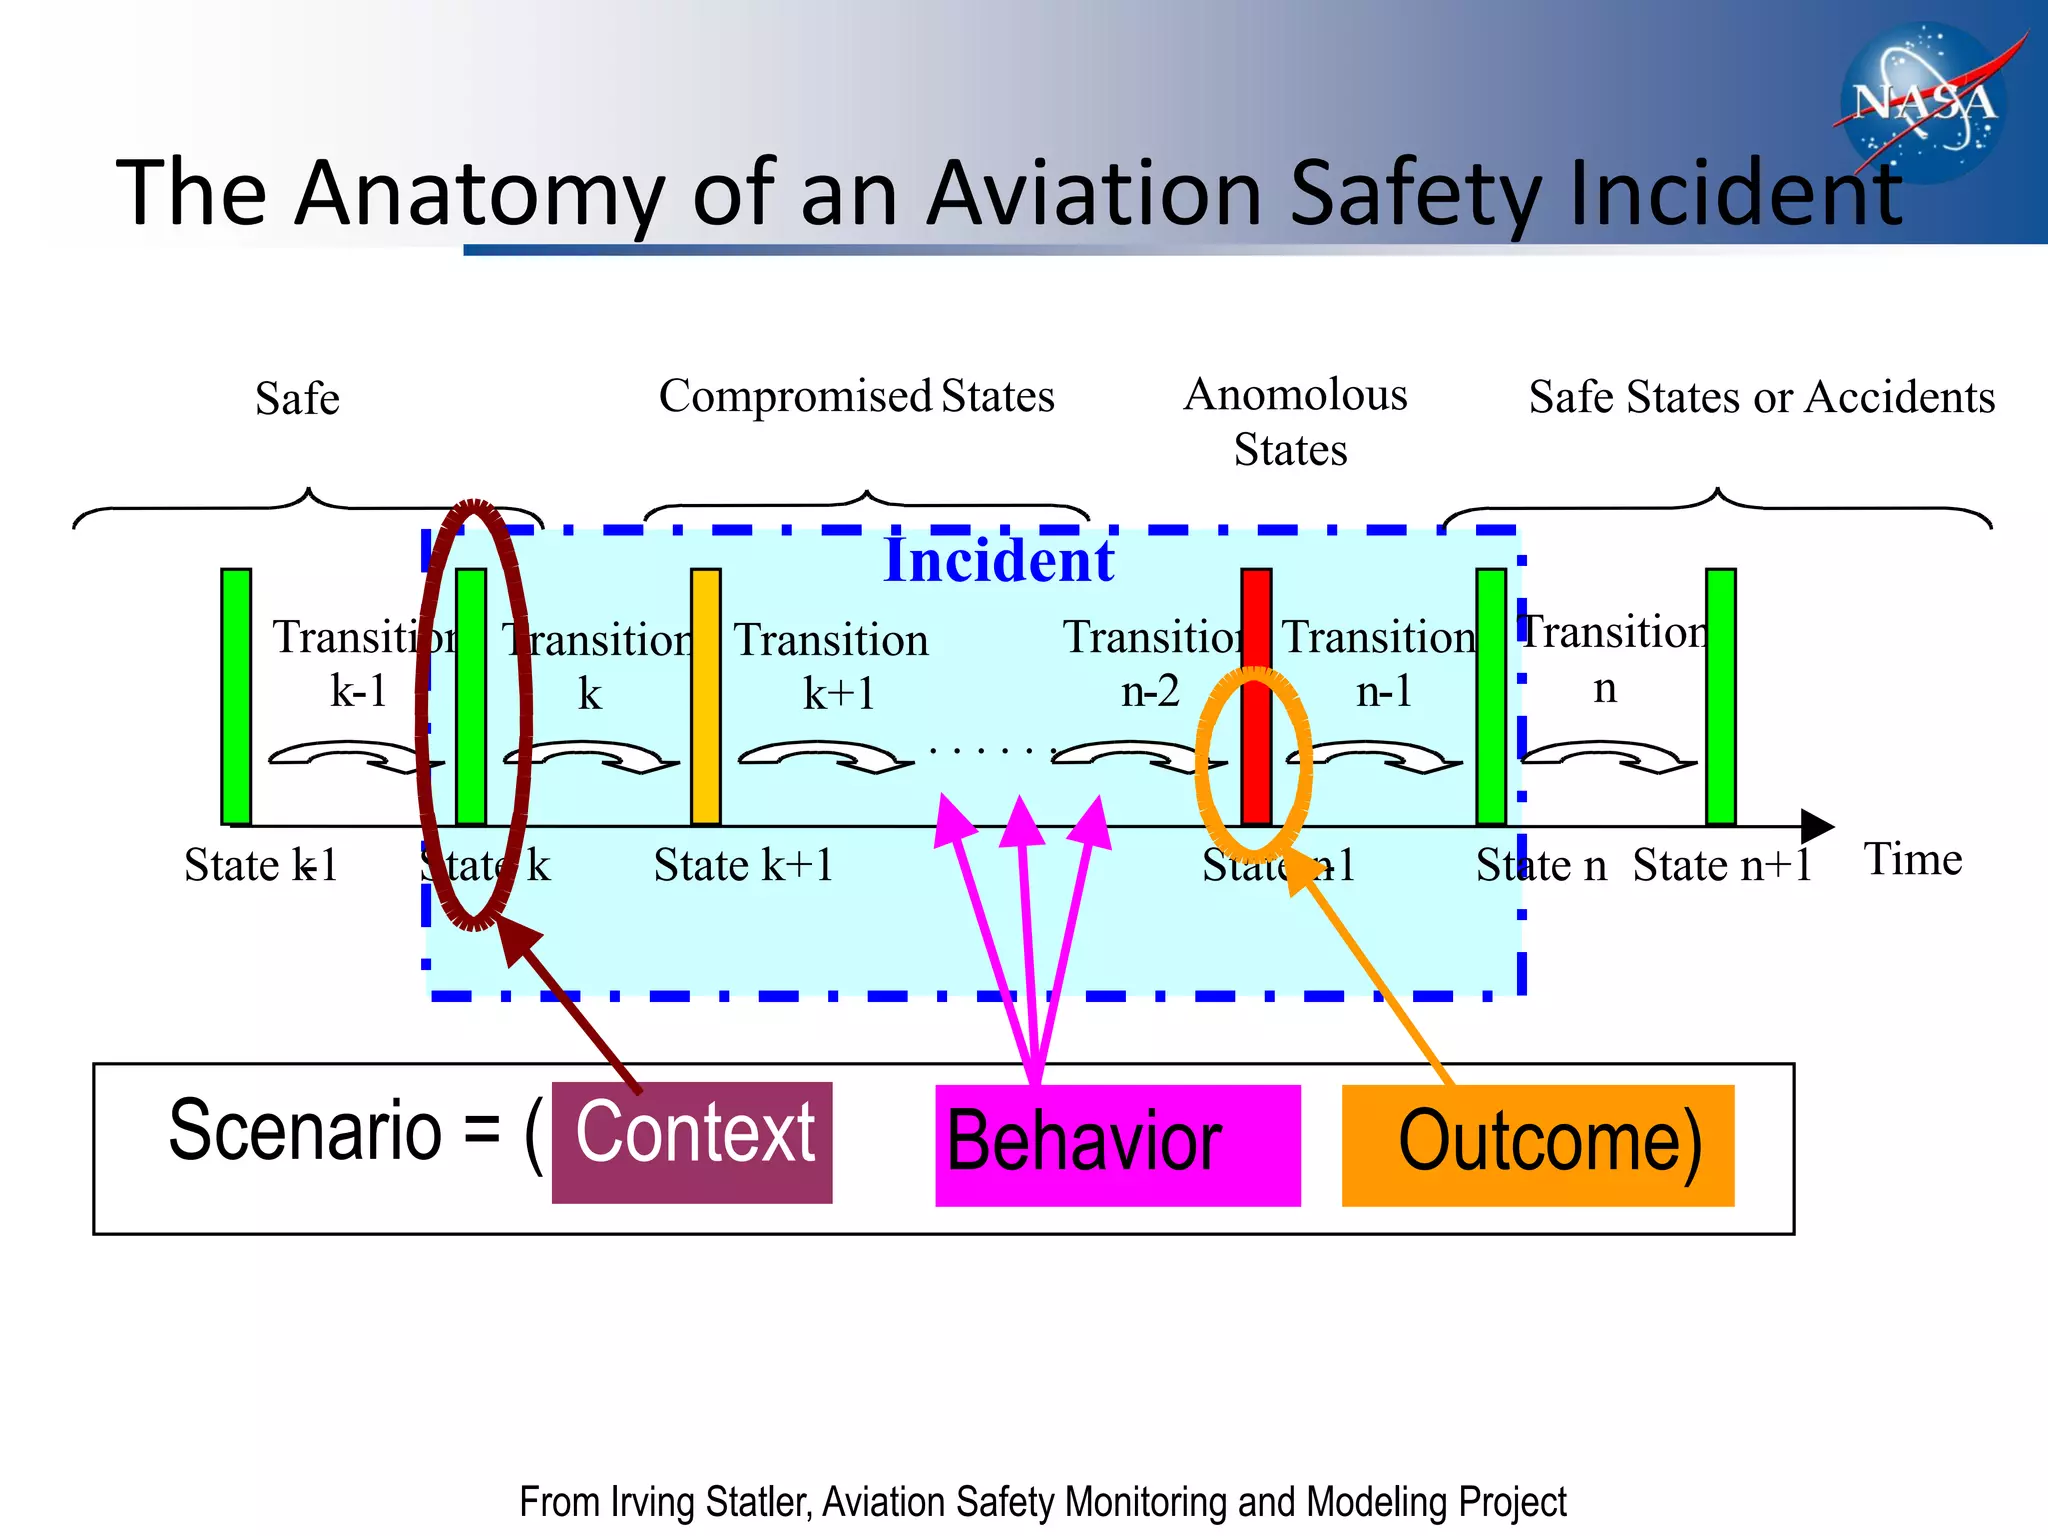
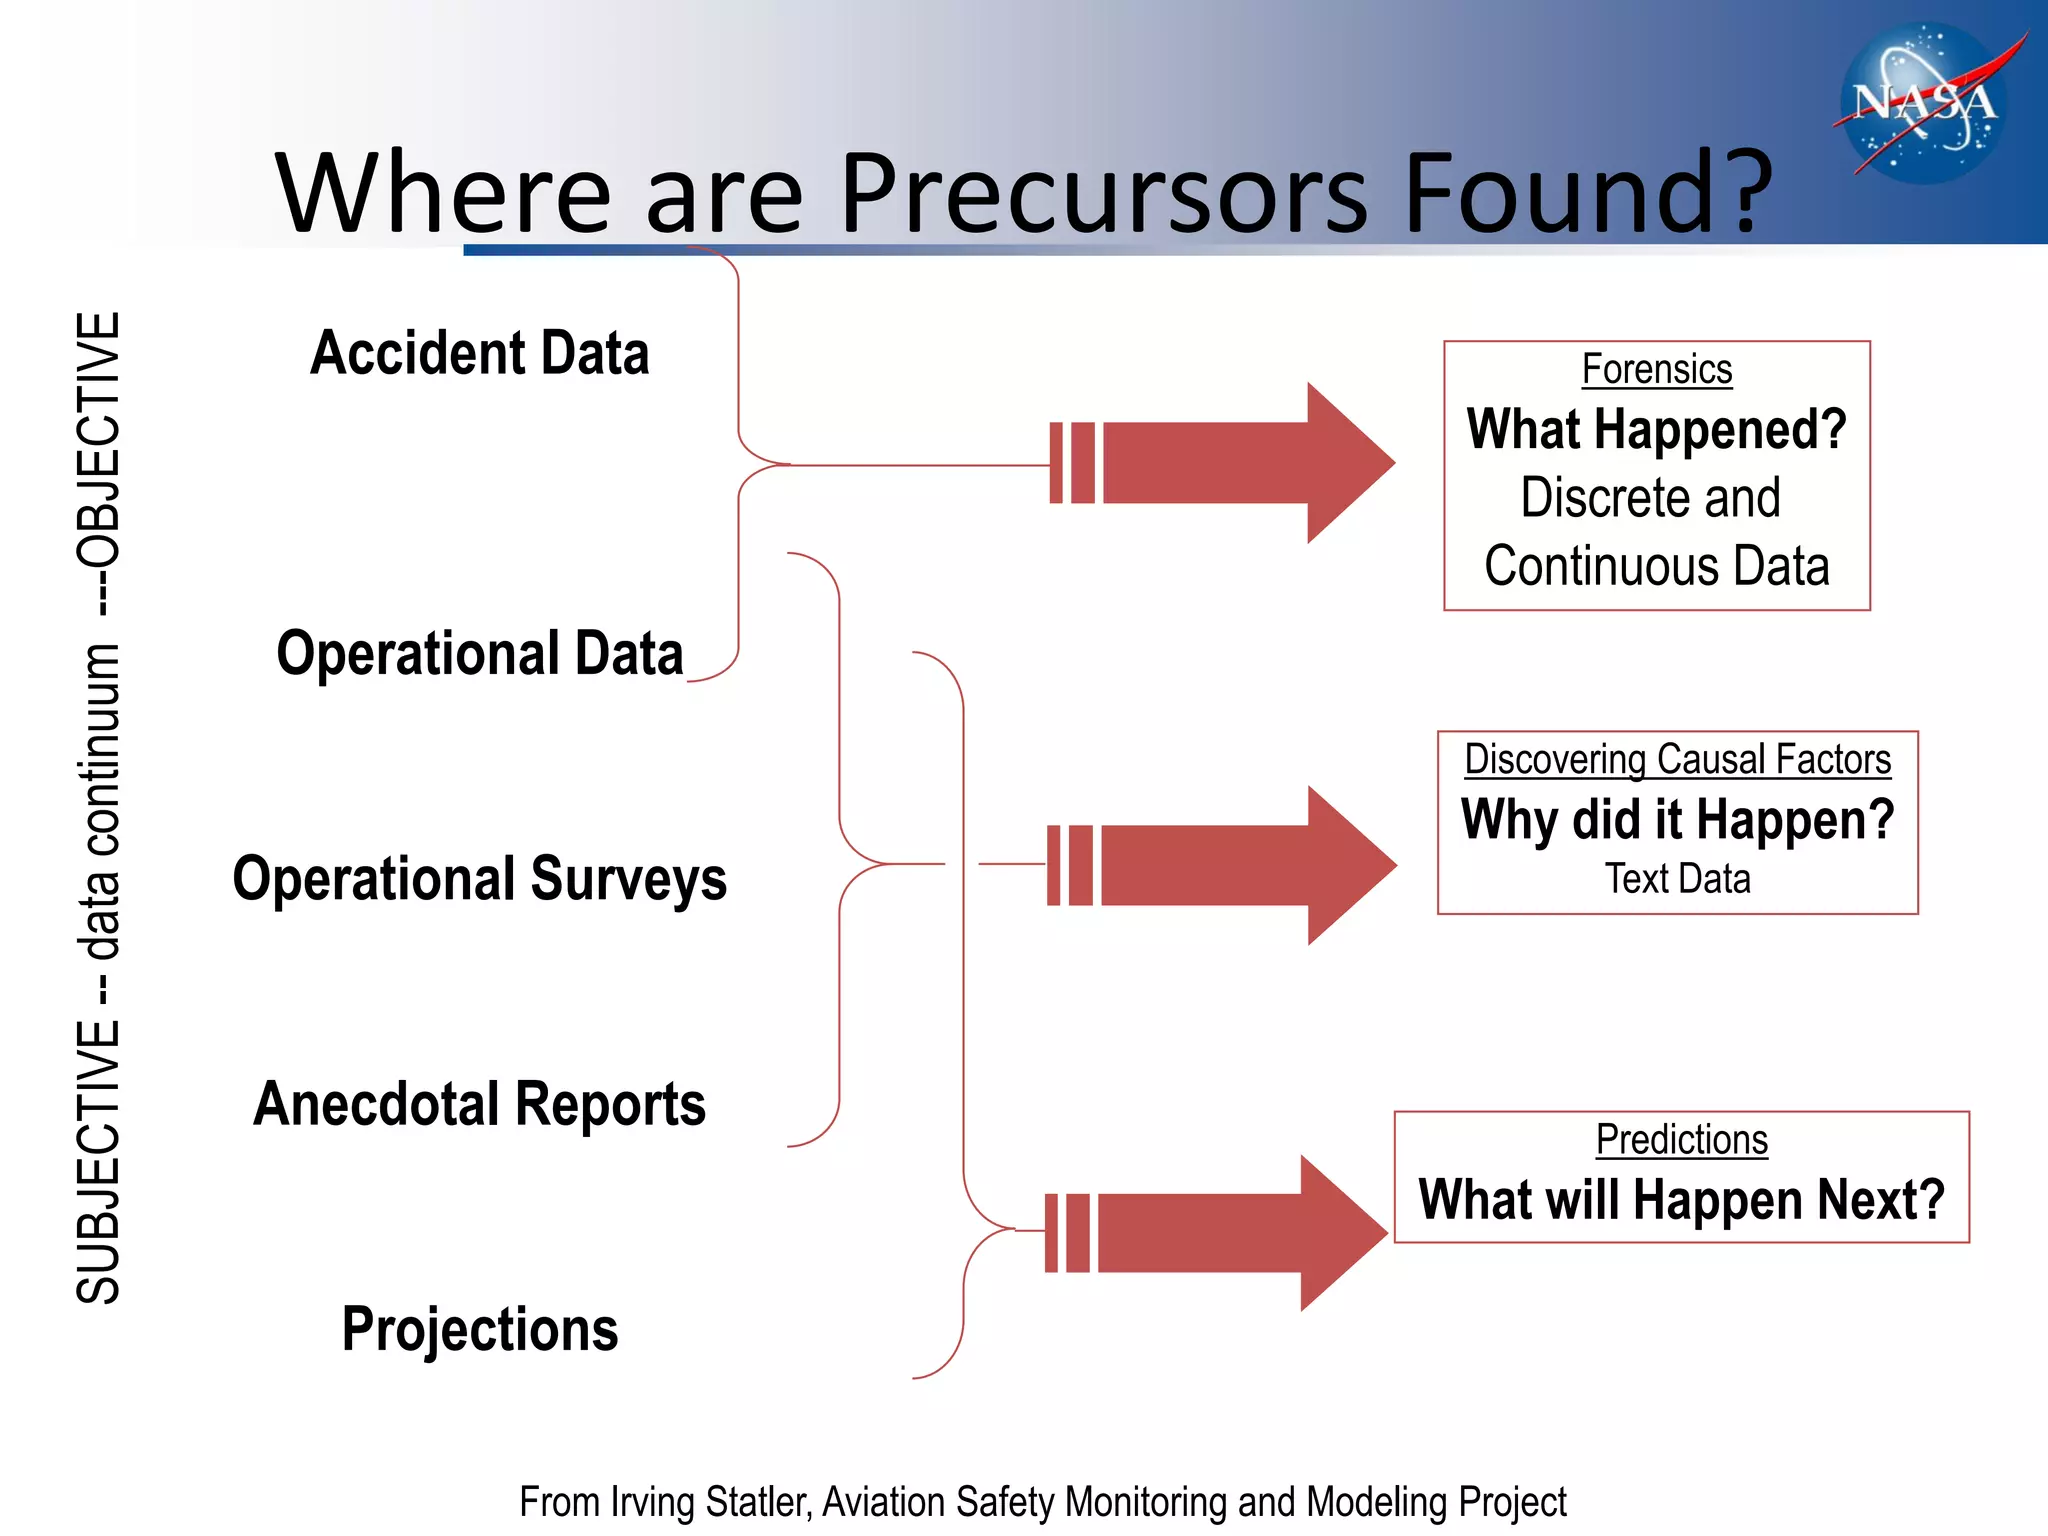
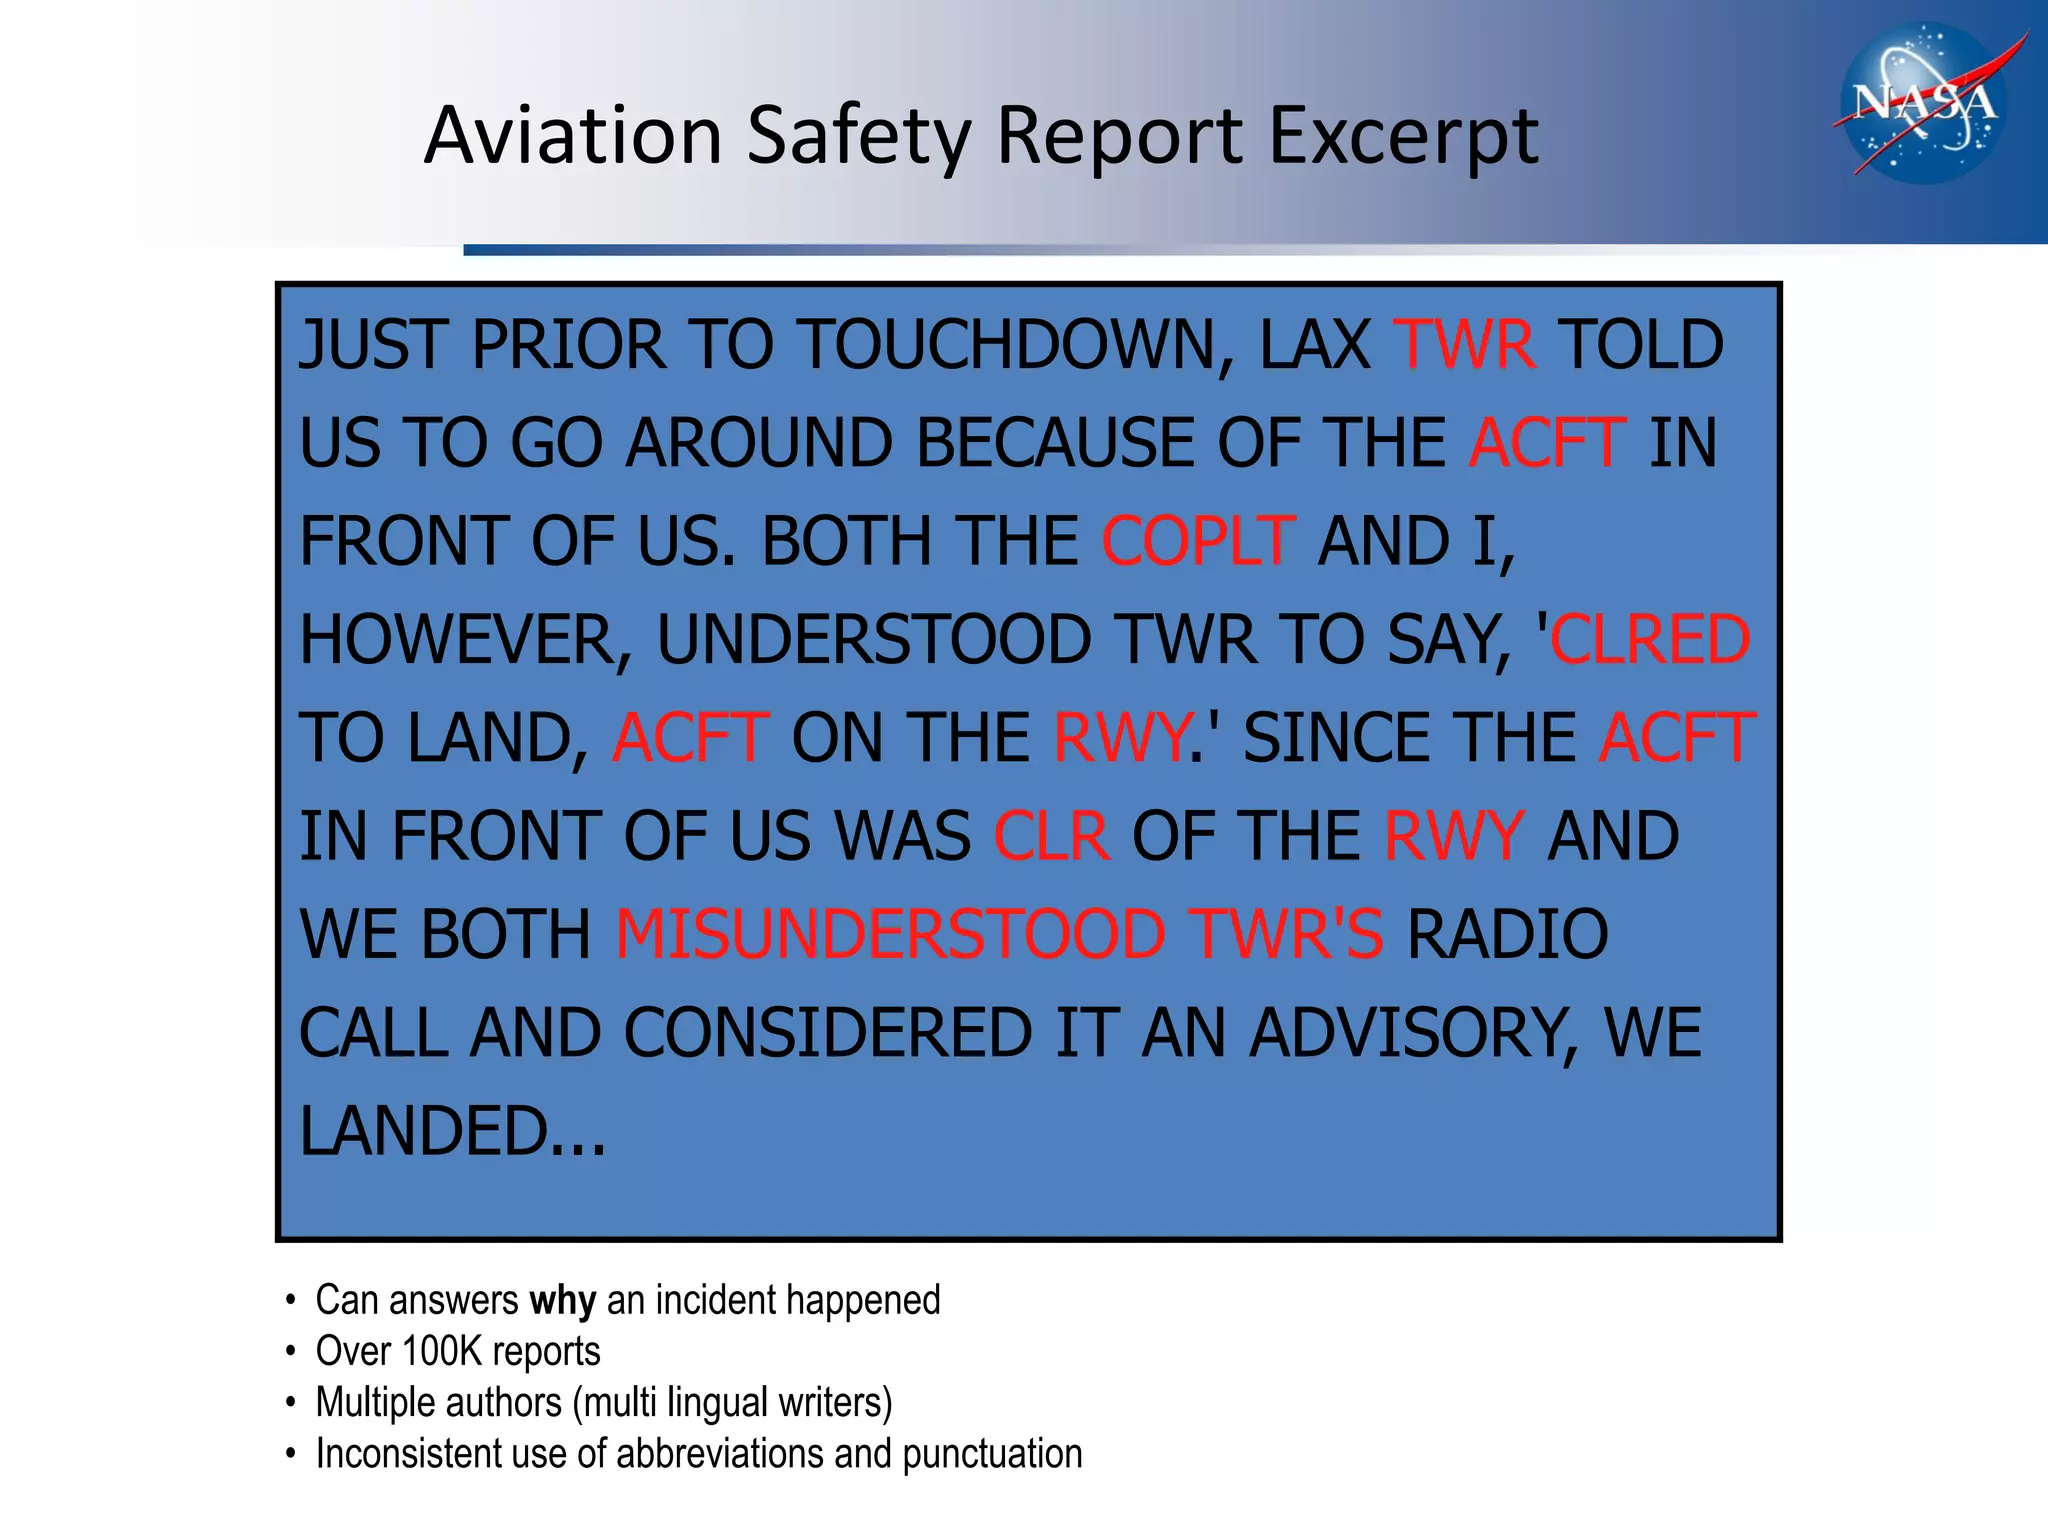
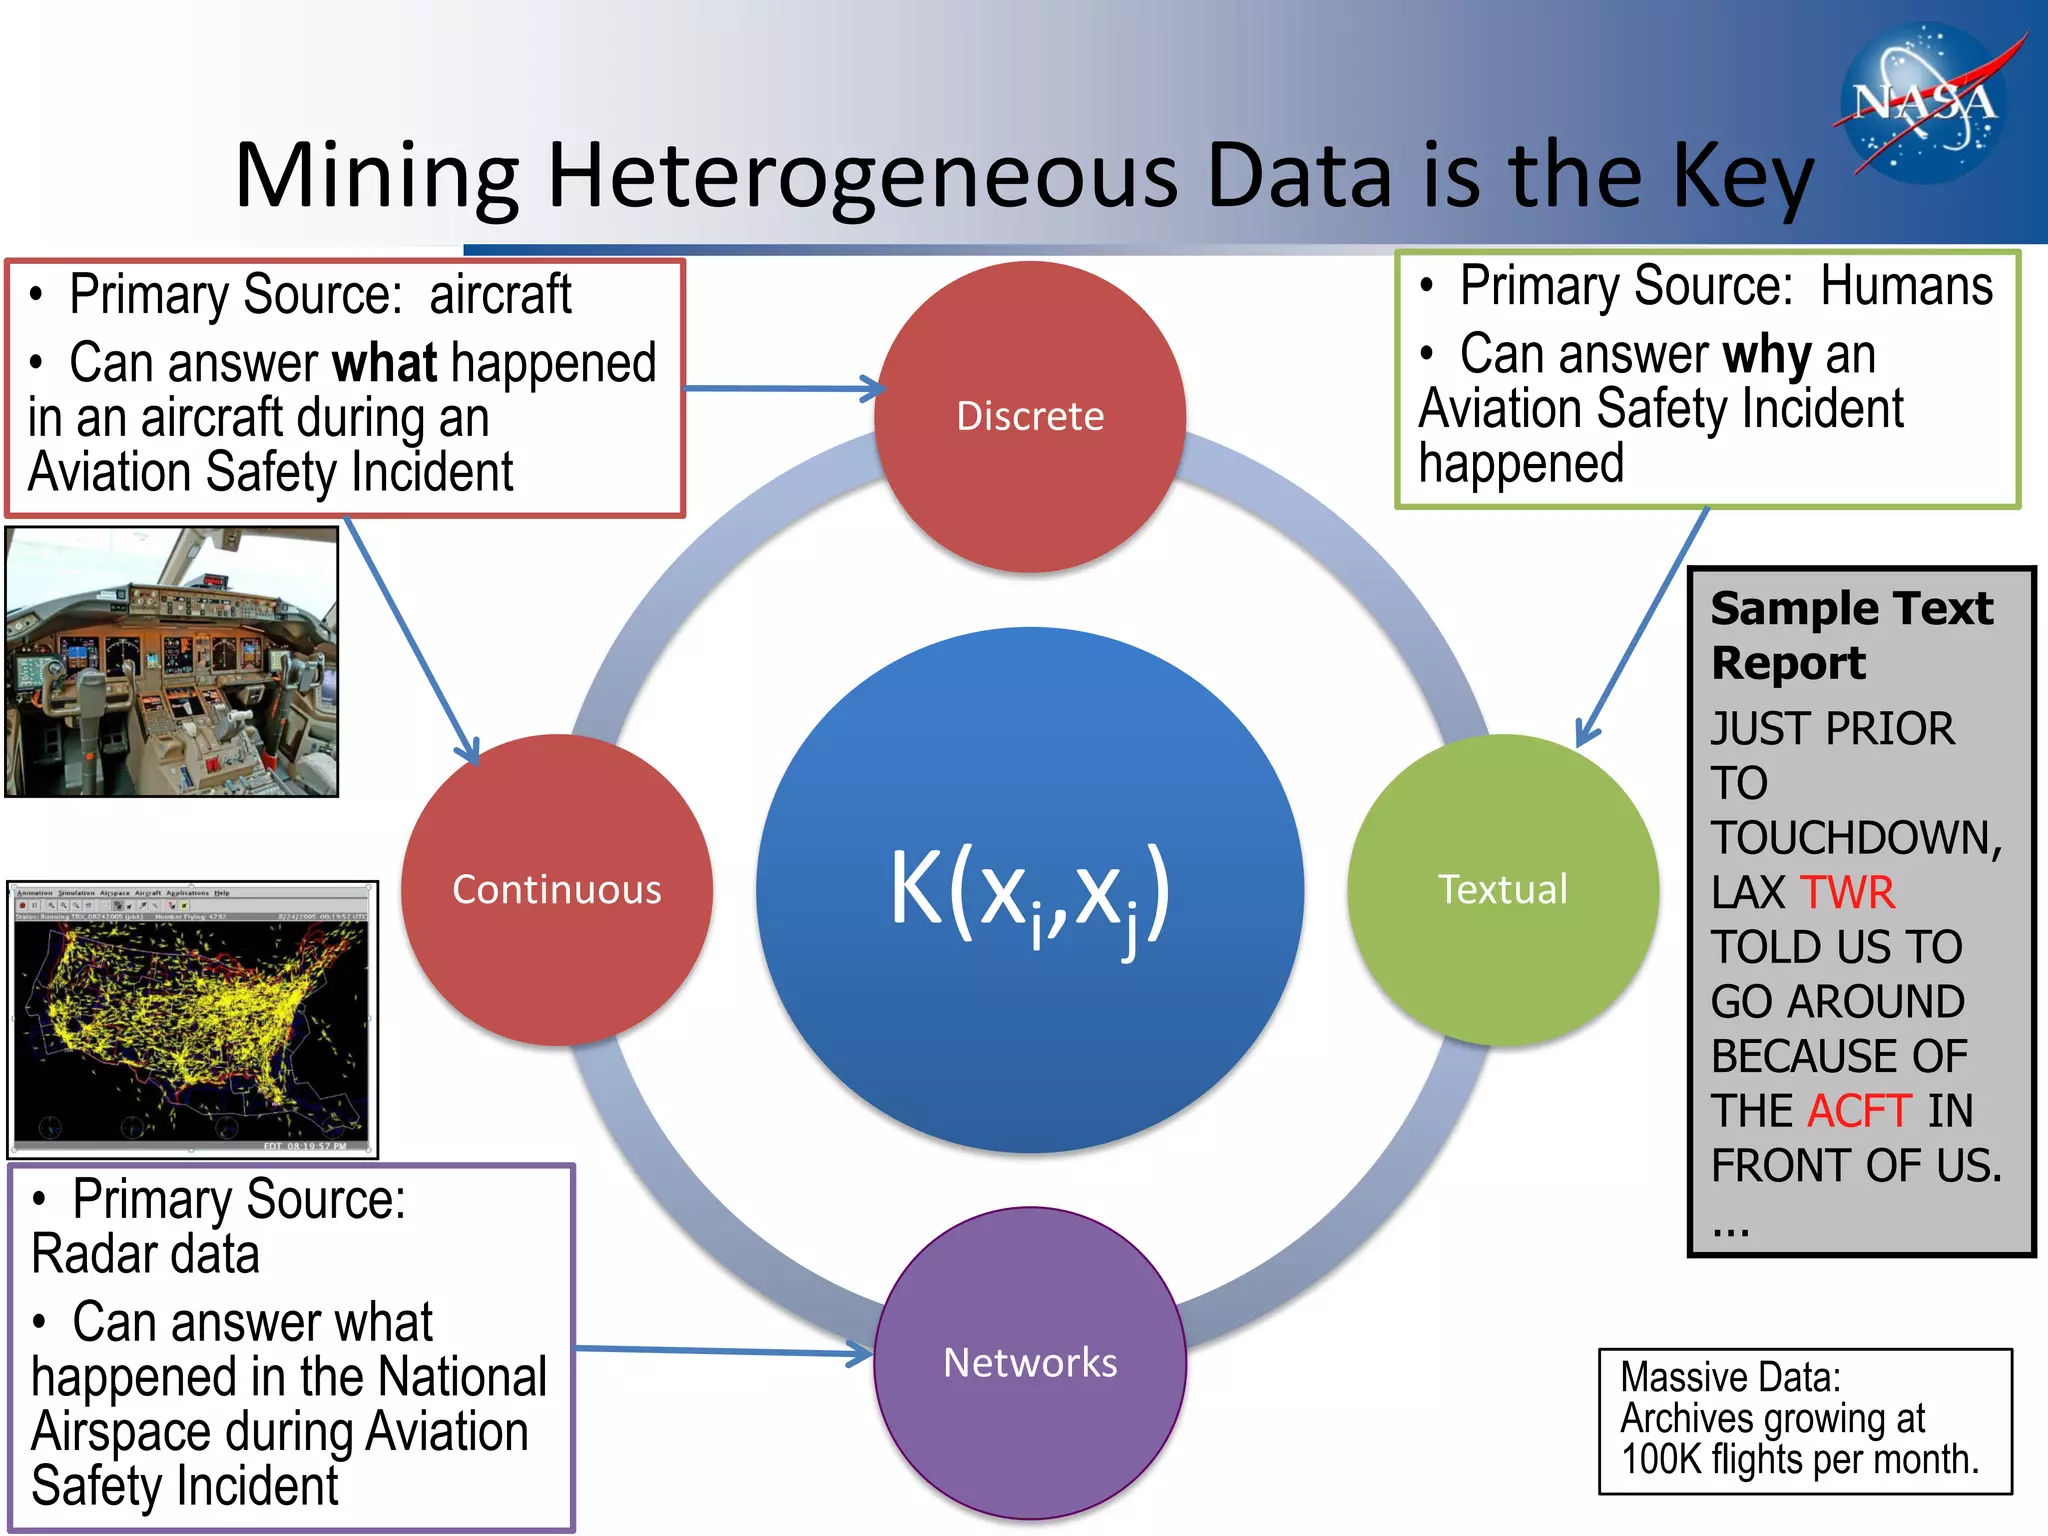
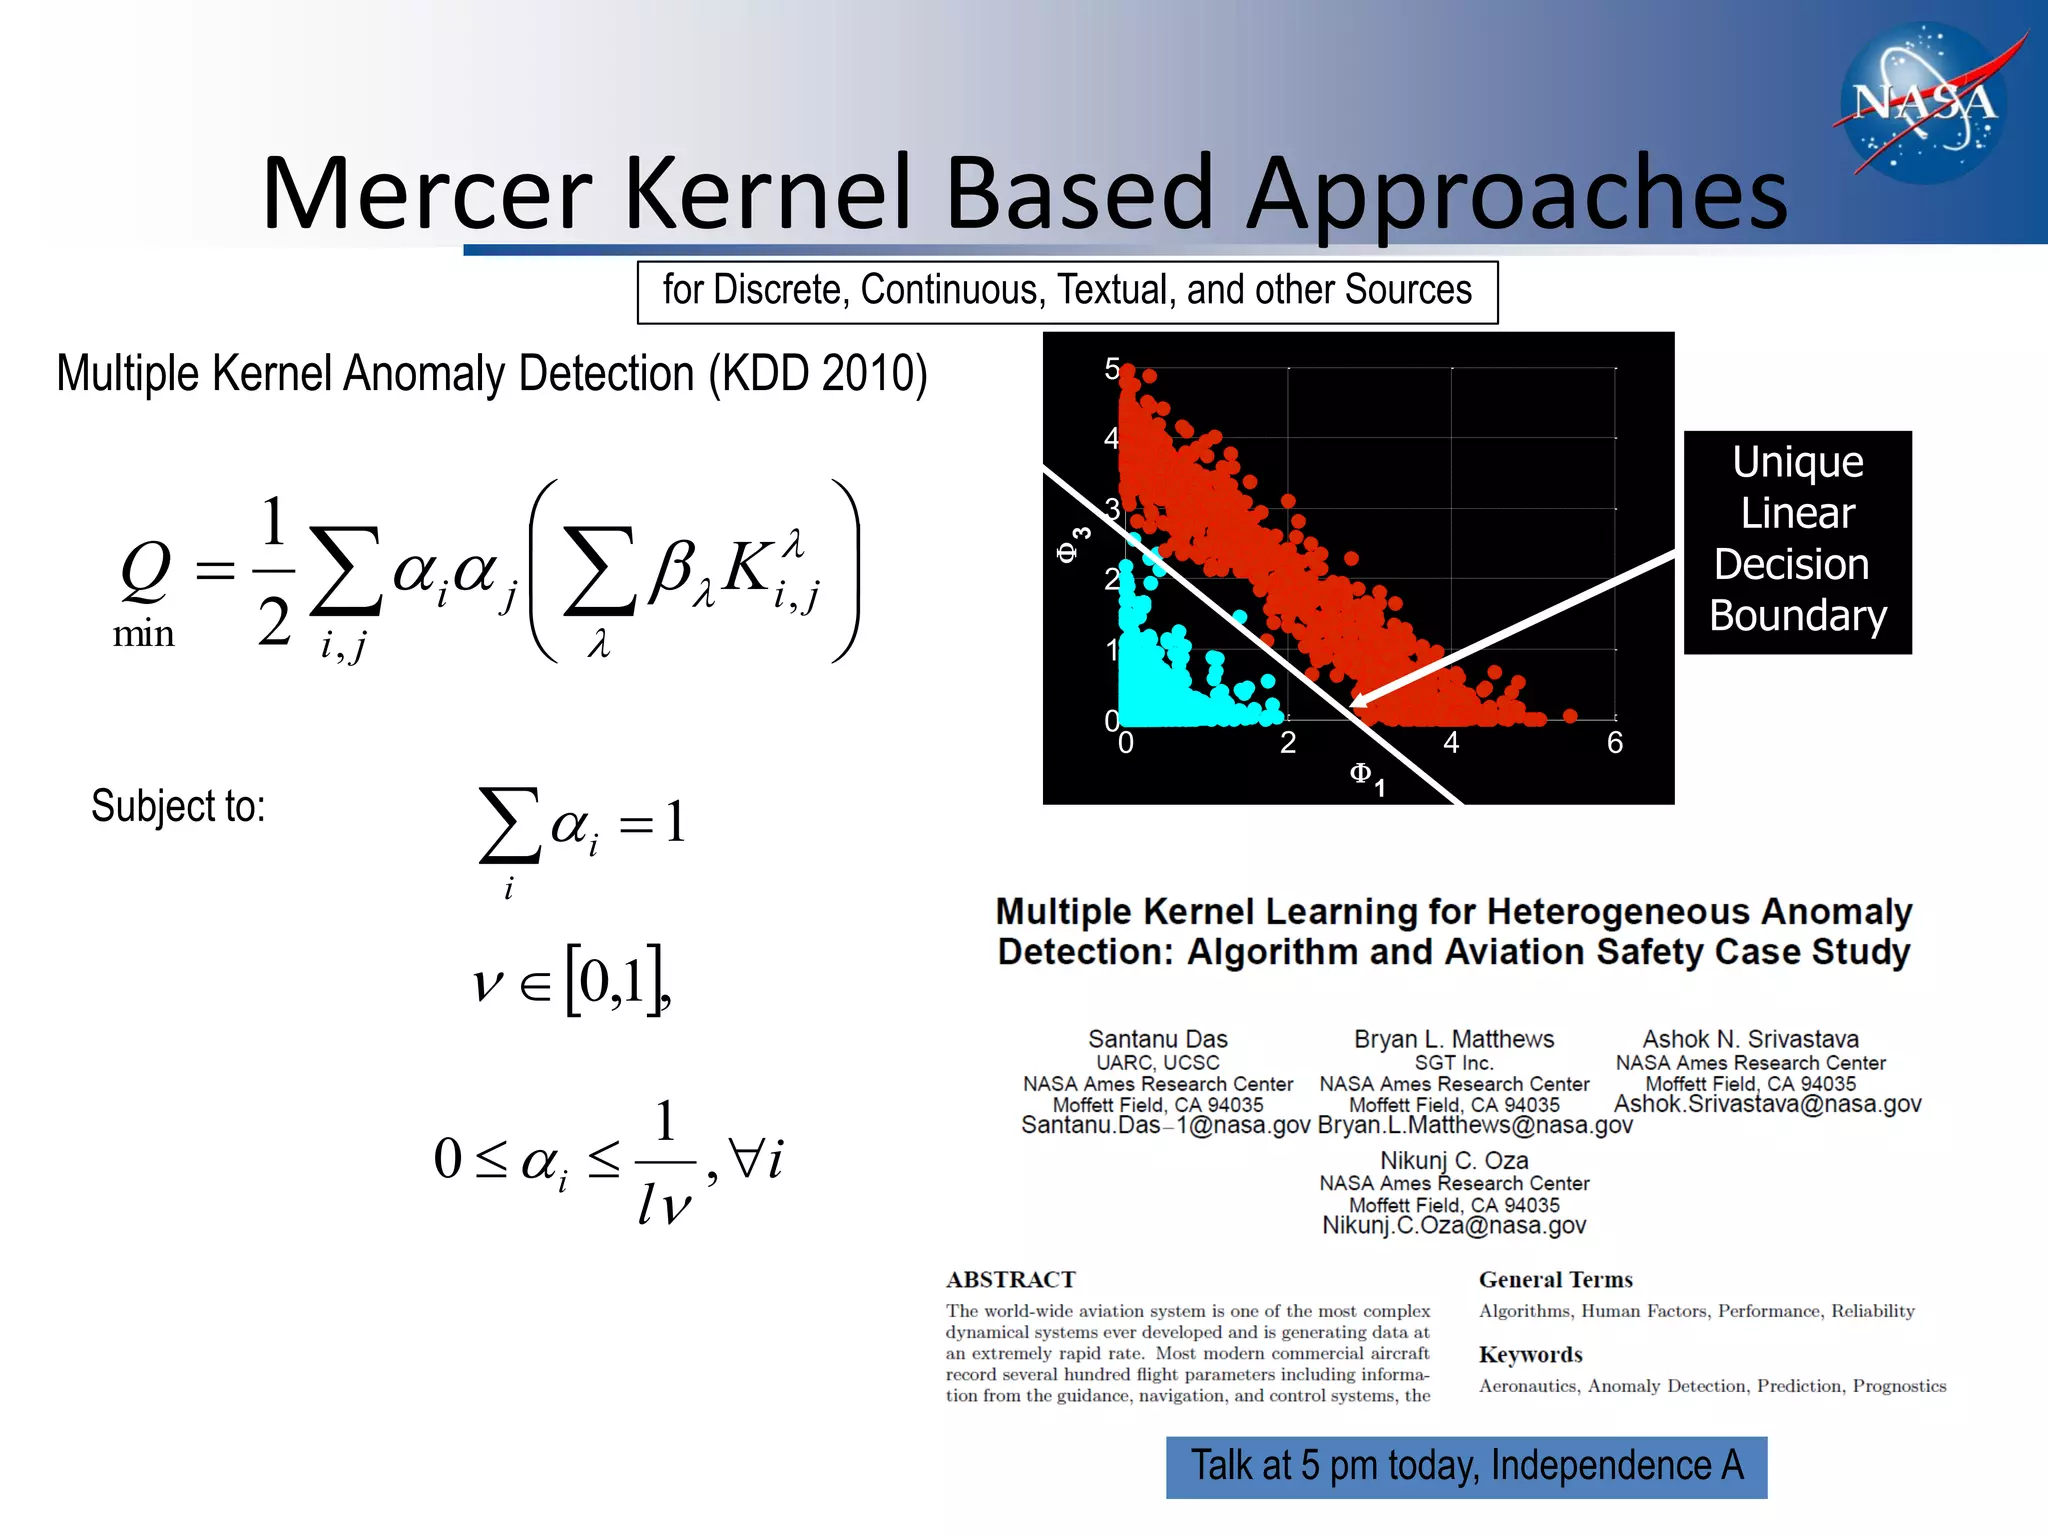
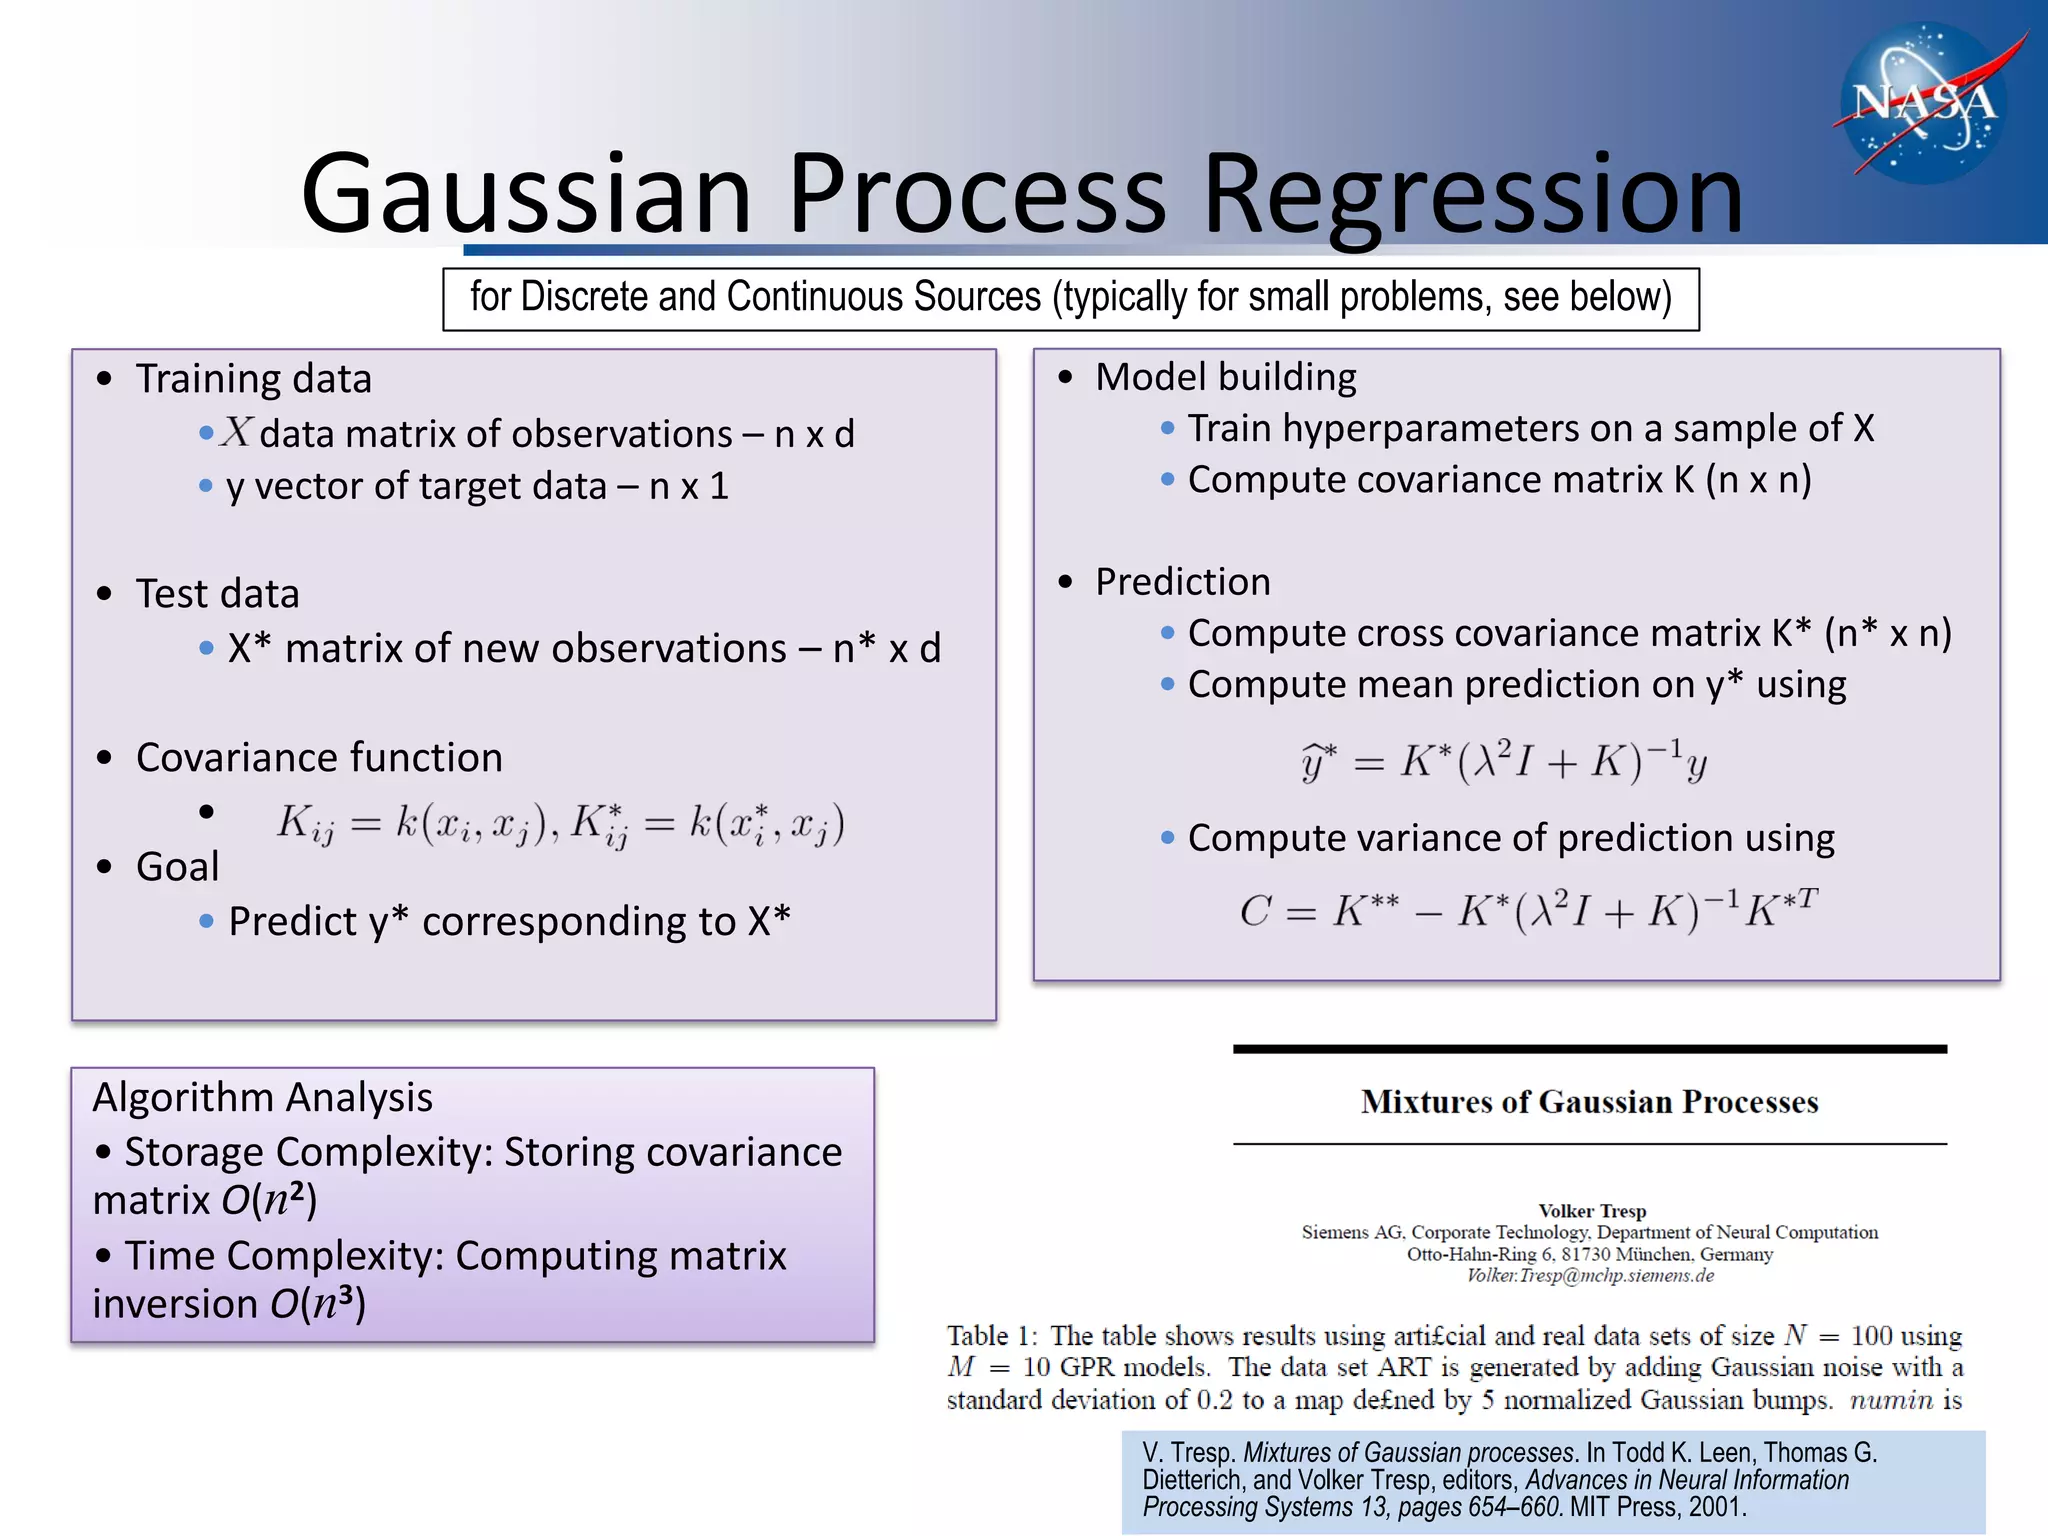
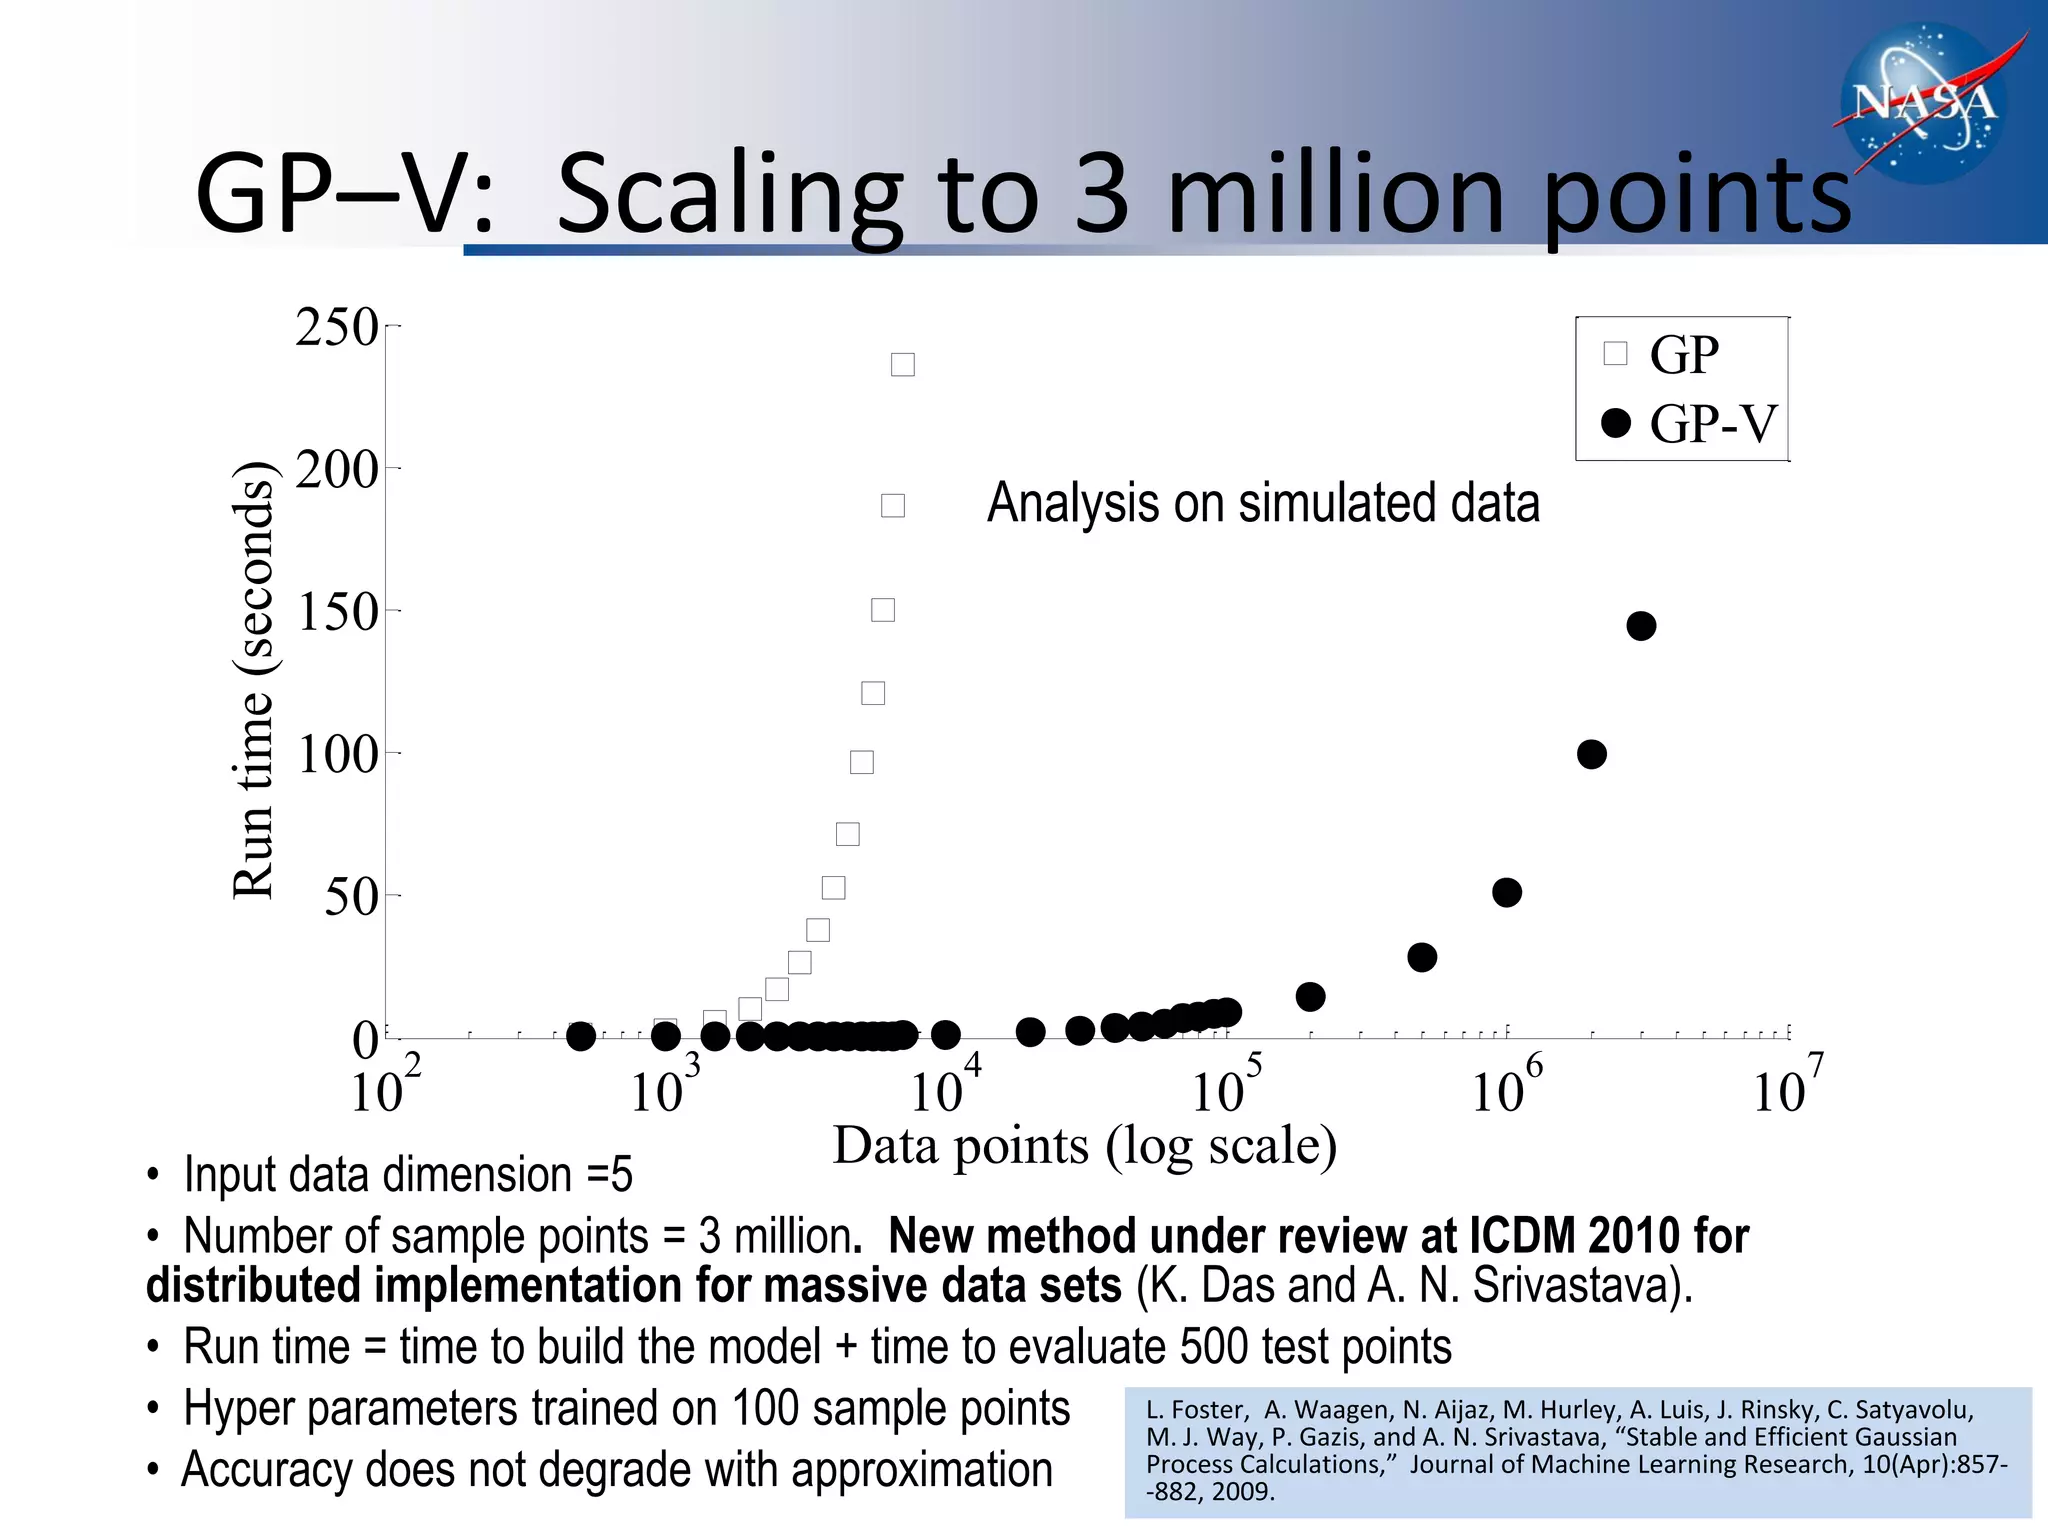
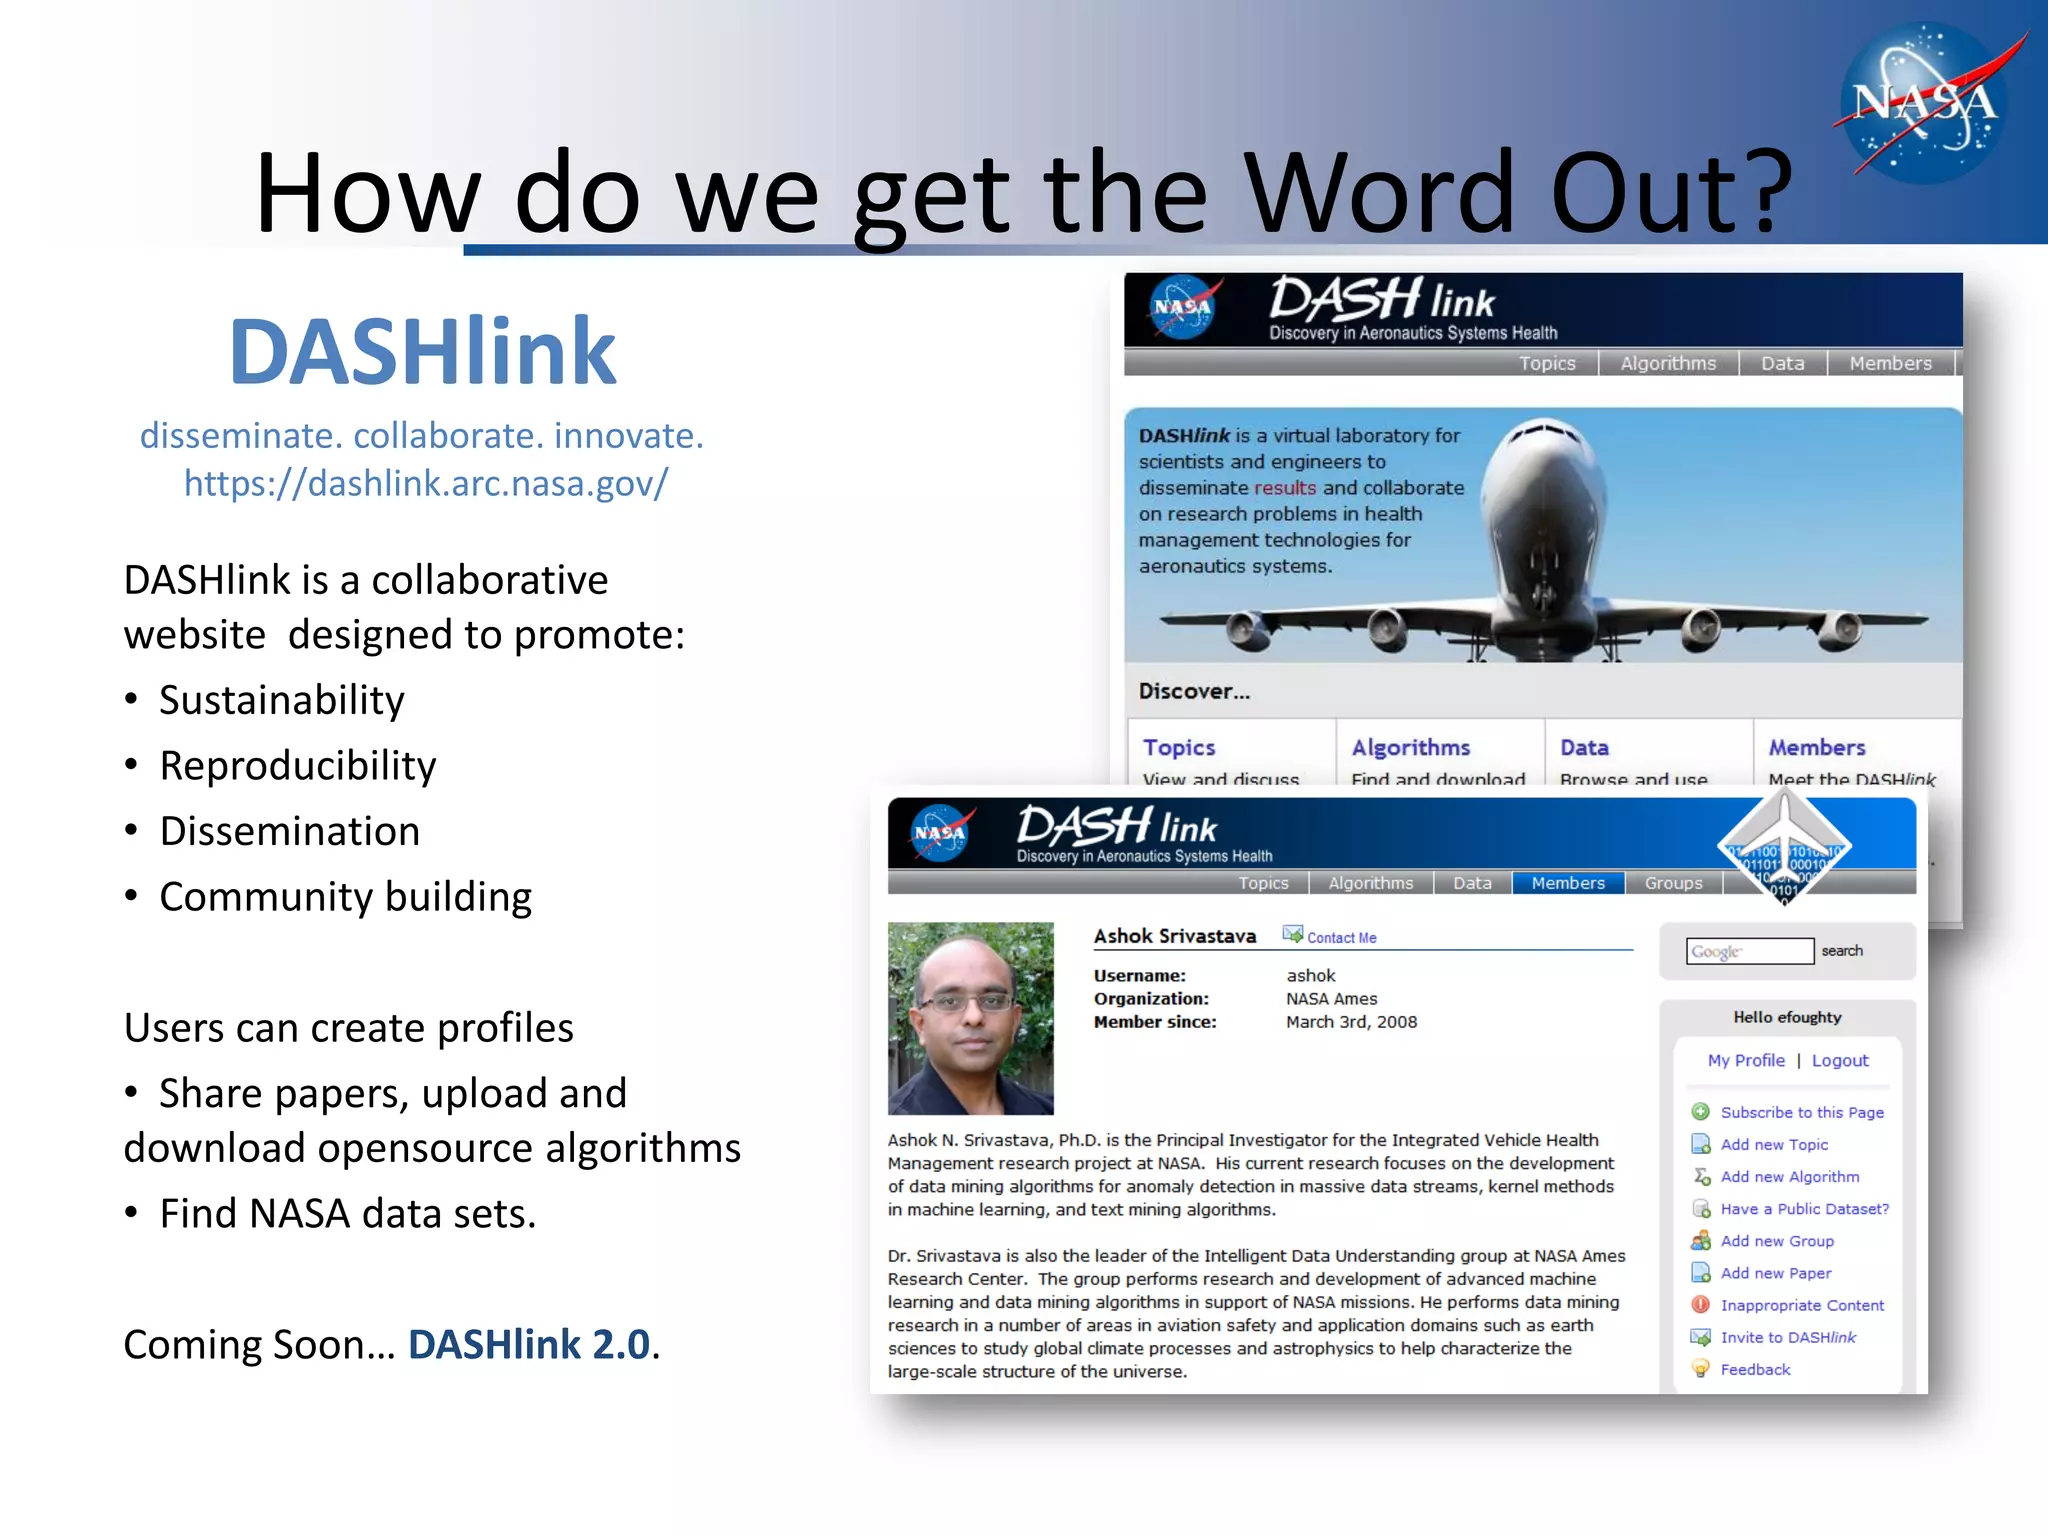
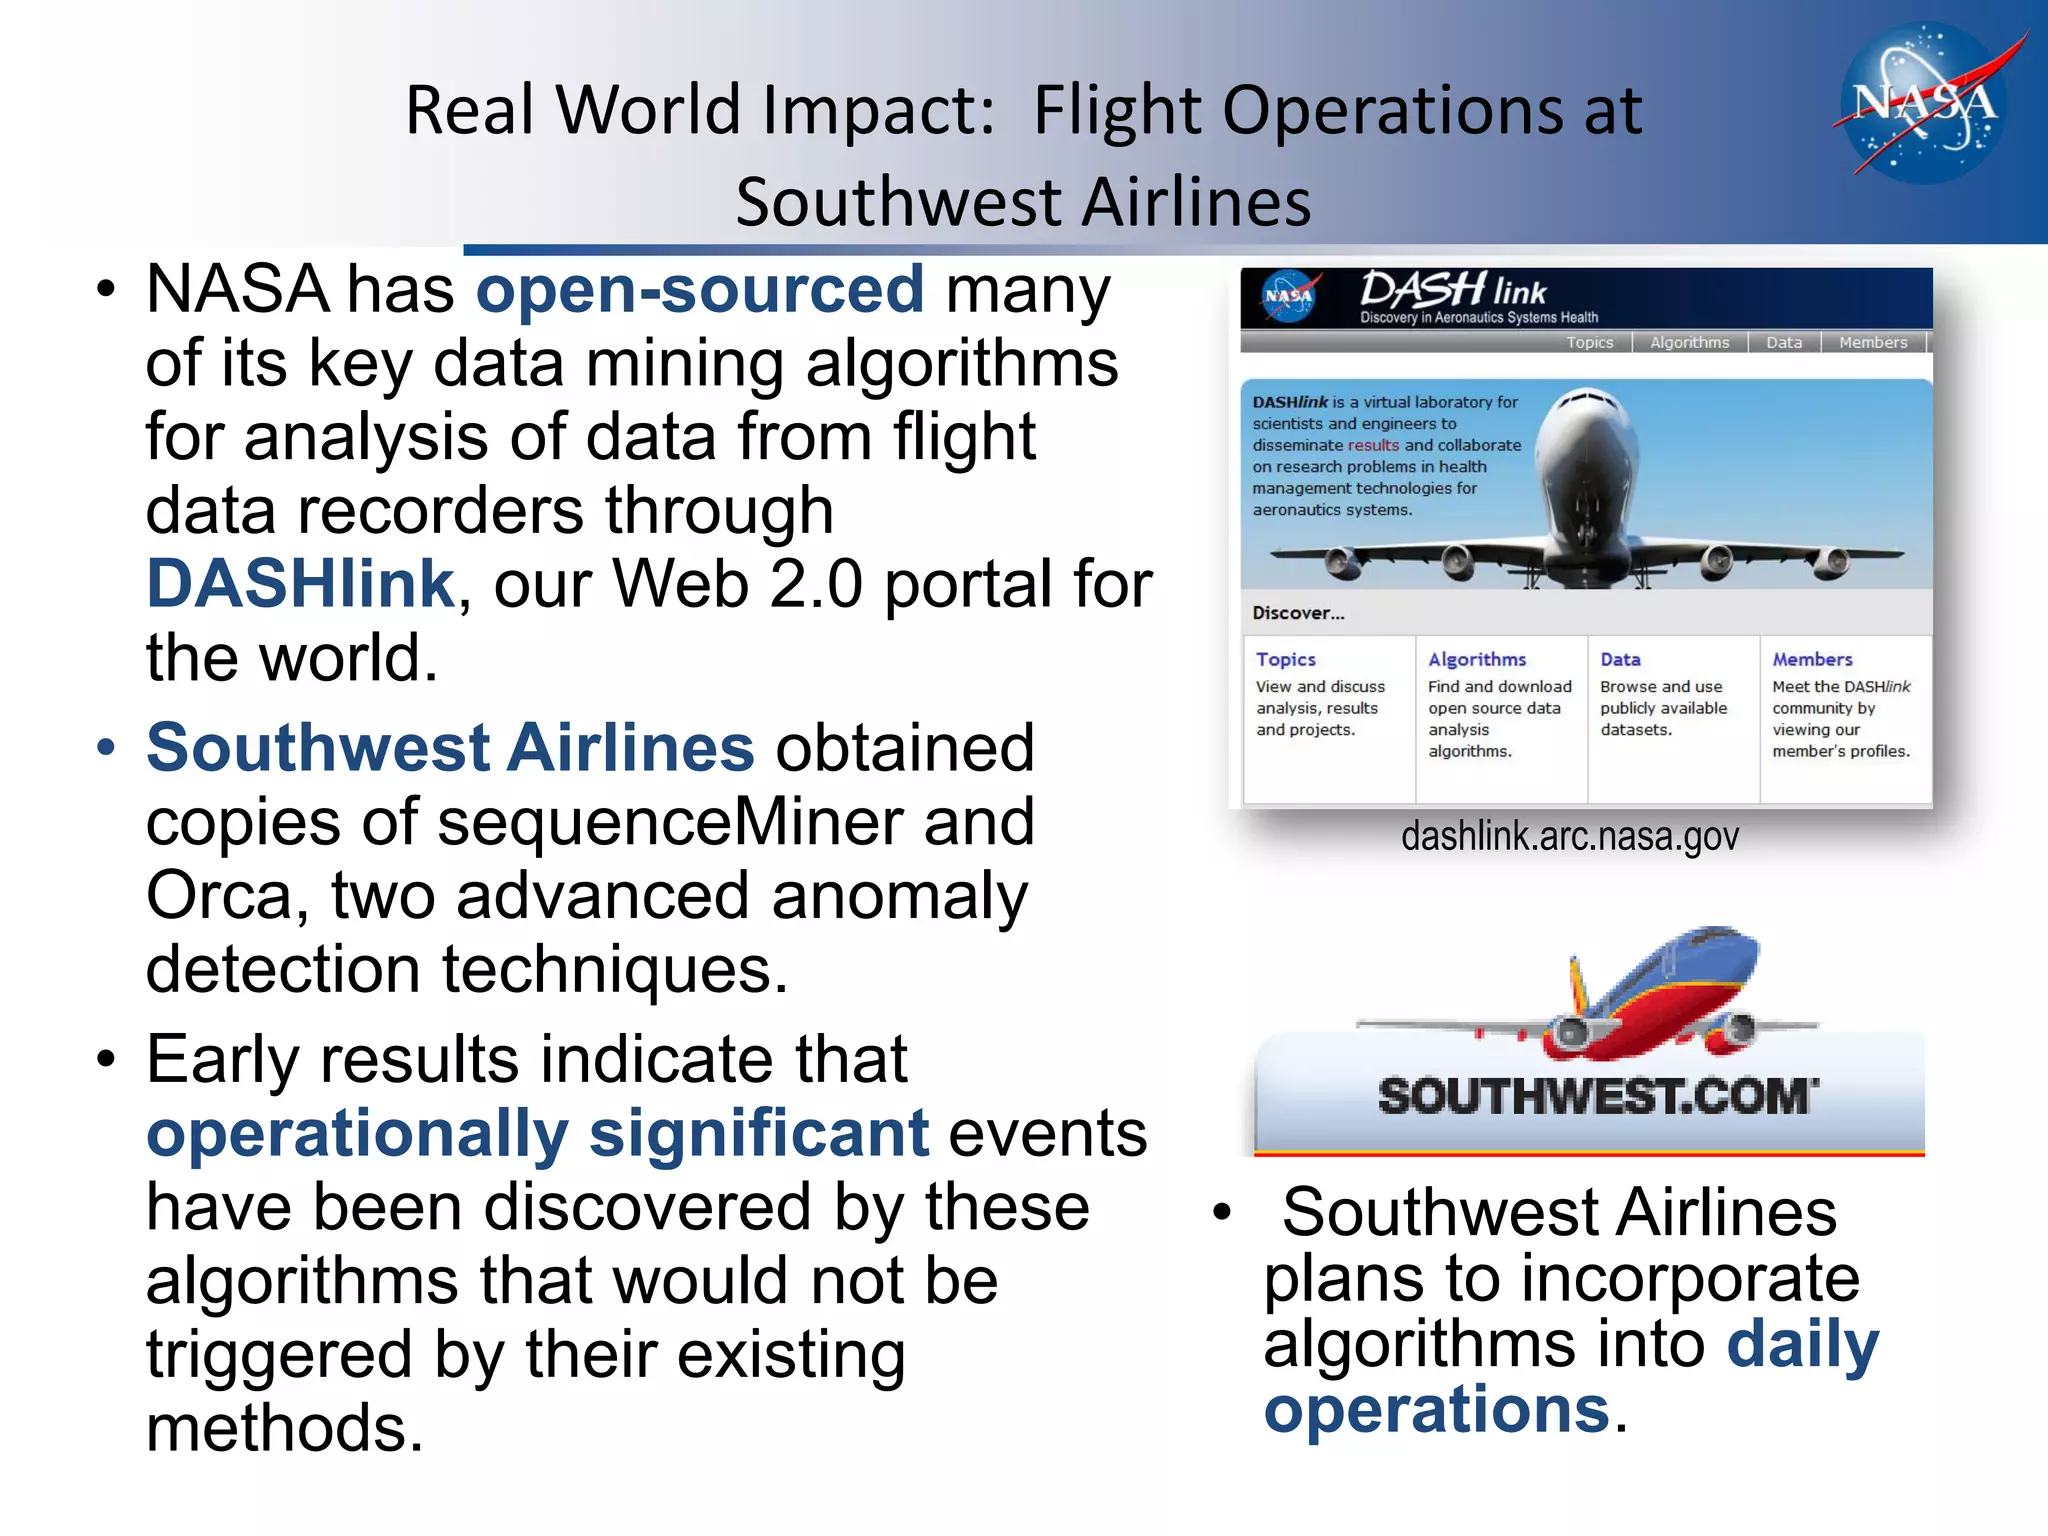
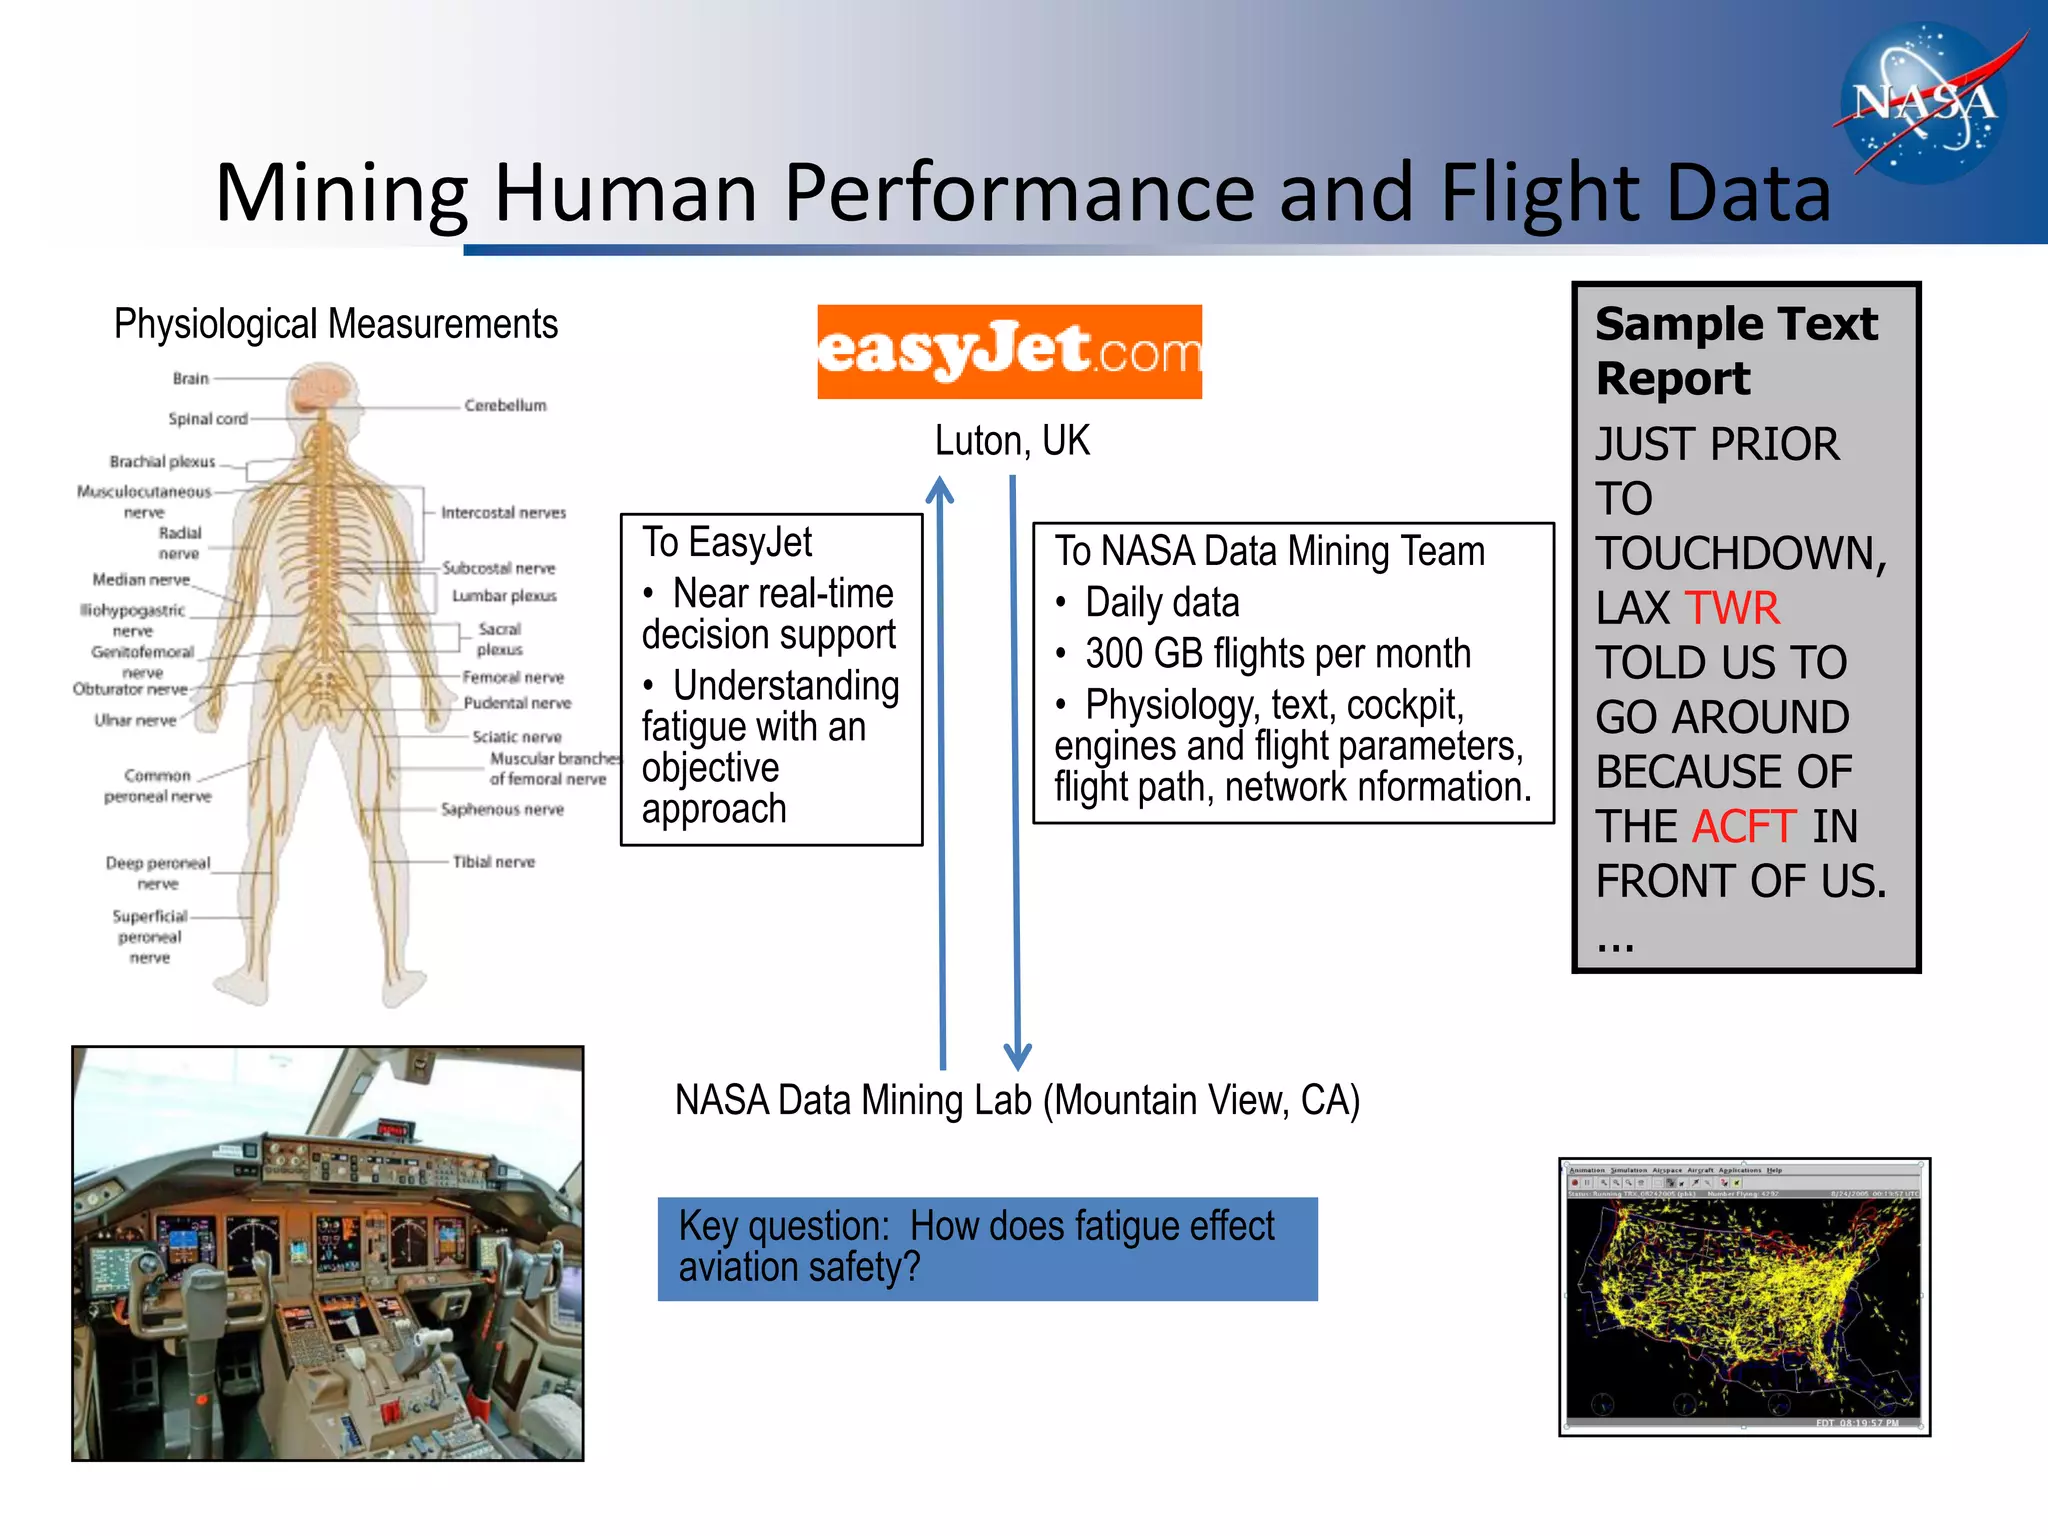
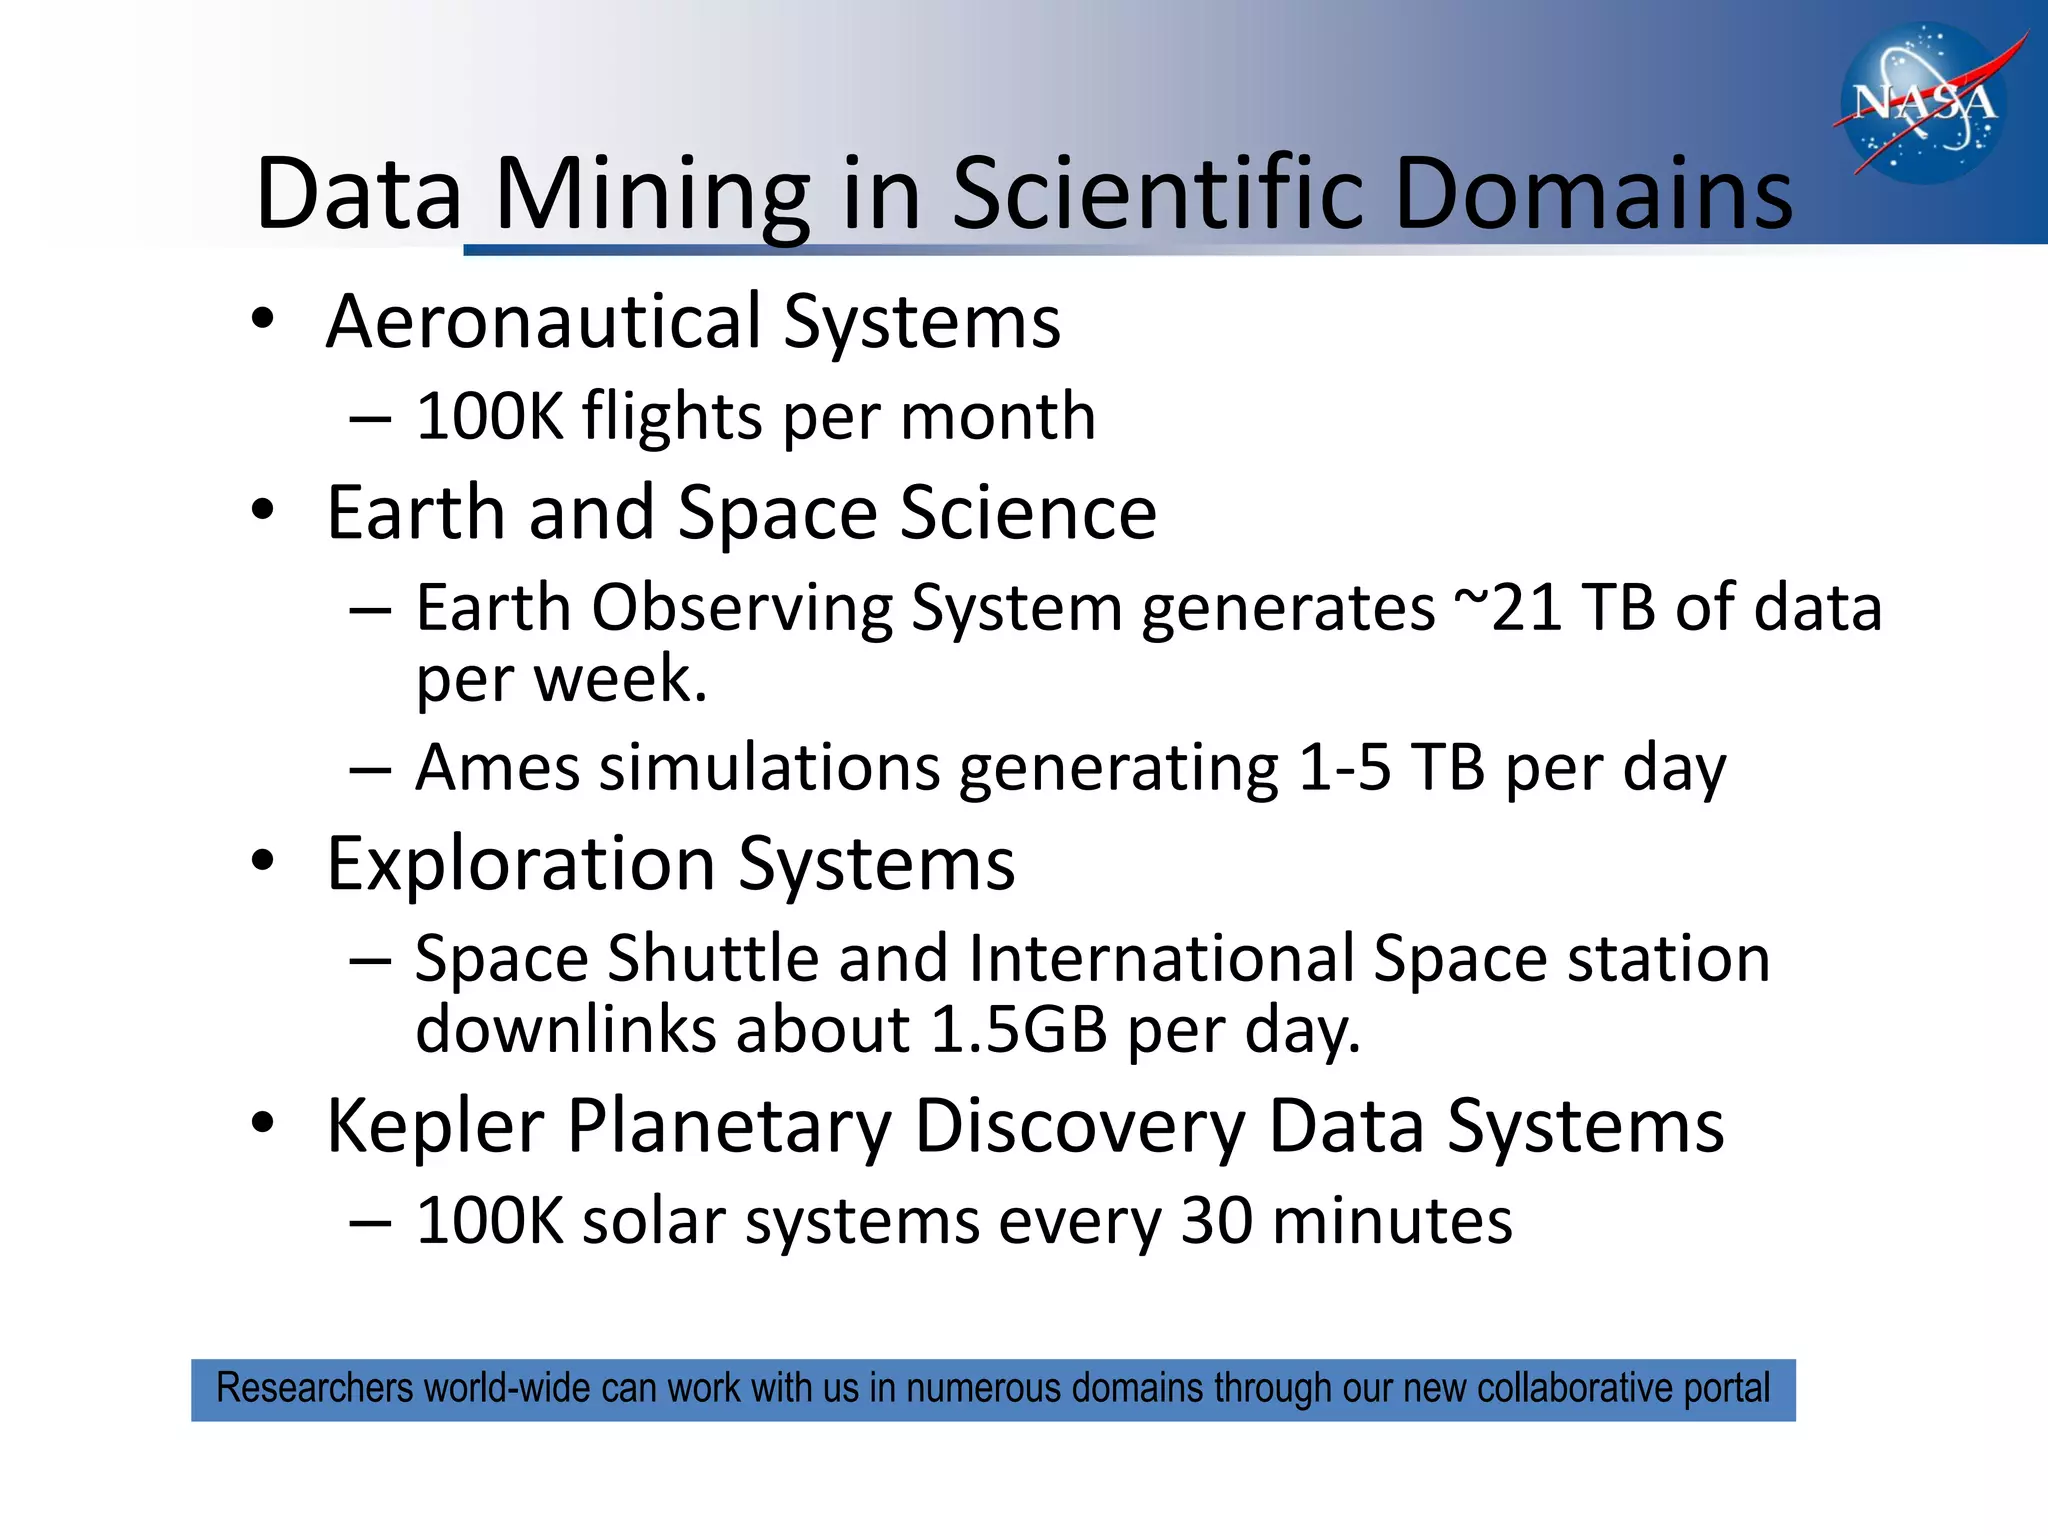
Discovering Precursors
   to Aviation Safety Incidents:
from Massive Data to Actionable
            Information
           Ashok N. Srivastava
   Principal Investigator, IVHM Project
Group Lead, Intelligent Data Understanding
      ashok.n.srivastava@nasa.gov
A Day in the Life of the National Airspace
Recent Safety Advances
Proactively Managing Risk
                      IDENTIFY


                       A Strategy for
IMPLEMENT                 Safety           EVALUATE
                       Improvement


                     FORMULATE

Reduce the accident rate by identifying and responding to
       precursor events before accidents occur.
Data Mining in Support of Global Operations


                                            105


                                   Data sharing
                                   Just culture / safety culture


10-6   10-5   10-4   10-3   10-2   10-1      100        101        102   103   104   105   106
Data Arises from Molecular to Global Scales


Molecules
            Materials
                               Sensors          Software             Engines                      Aircraft


                                                           Vehicle Technology               Operations

   10-6       10-5      10-4     10-3    10-2    10-1       100      101        102   103      104       105   106
The Anatomy of an Aviation Safety Incident
    Safe                  Compromised States                Anomolous             Safe States or Accidents
                                                              States

                                        Incident
     Transition Transition Transition       Transition Transition Transition
        k-1        k          k+1              n-2        n-1         n
                                     ......

 State k
       -1   State k      State k+1                           State n
                                                                   -1          State n State n+1 Time


 Scenario = ( Context                       Behavior                     Outcome)


                 From Irving Statler, Aviation Safety Monitoring and Modeling Project
Where are Precursors Found?
SUBJECTIVE -- data continuum ---OBJECTIVE


                                              Accident Data                                                                   Forensics
                                                                                                                    What Happened?
                                                                                                                     Discrete and
                                                                                                                    Continuous Data
                                             Operational Data
                                                                                                                    Discovering Causal Factors
                                                                                                                    Why did it Happen?
                                            Operational Surveys                                                                Text Data


                                            Anecdotal Reports                                                                 Predictions
                                                                                                                 What will Happen Next?

                                                Projections

                                                       From Irving Statler, Aviation Safety Monitoring and Modeling Project
Aviation Safety Report Excerpt

    JUST PRIOR TO TOUCHDOWN, LAX TWR TOLD
    US TO GO AROUND BECAUSE OF THE ACFT IN
    FRONT OF US. BOTH THE COPLT AND I,
    HOWEVER, UNDERSTOOD TWR TO SAY, 'CLRED
    TO LAND, ACFT ON THE RWY.' SINCE THE ACFT
    IN FRONT OF US WAS CLR OF THE RWY AND
    WE BOTH MISUNDERSTOOD TWR'S RADIO
    CALL AND CONSIDERED IT AN ADVISORY, WE
    LANDED...

•   Can answers why an incident happened
•   Over 100K reports
•   Multiple authors (multi lingual writers)
•   Inconsistent use of abbreviations and punctuation
Mining Heterogeneous Data is the Key
• Primary Source: aircraft                  • Primary Source: Humans
• Can answer what happened                  • Can answer why an
in an aircraft during an         Discrete   Aviation Safety Incident
Aviation Safety Incident                    happened

                                                           Sample Text
                                                           Report
                                                           JUST PRIOR
                                                           TO
                                                           TOUCHDOWN,
                   Continuous   K(xi,xj)    Textual        LAX TWR
                                                           TOLD US TO
                                                           GO AROUND
                                                           BECAUSE OF
                                                           THE ACFT IN
                                                           FRONT OF US.
• Primary Source:                                          ...
Radar data
• Can answer what
happened in the National         Networks             Massive Data:
Airspace during Aviation                              Archives growing at
                                                      100K flights per month.
Safety Incident
Mercer Kernel Based Approaches
                               for Discrete, Continuous, Textual, and other Sources

Multiple Kernel Anomaly Detection (KDD 2010)                 5

                                                             4
                                                                                                  Unique
      1                   
                                                             3                                    Linear
  Q    i j     K i , j 


                                                         3
                                                                                                 Decision


                                                       
                                                             2
  min 2 i, j                                              1
                                                                                                 Boundary

                                                             0
                                                              0        2           4       6
                                                                           
 Subject to:
                     i  1
                                                                               1


                      i

                      0,1,

                               1
                   0  i       , i
                              l


                                                                  Talk at 5 pm today, Independence A
Gaussian Process Regression
                     for Discrete and Continuous Sources (typically for small problems, see below)
• Training data                                           • Model building
     • data matrix of observations – n x d                    • Train hyperparameters on a sample of X
     • y vector of target data – n x 1                        • Compute covariance matrix K (n x n)

• Test data                                               • Prediction
     • X* matrix of new observations – n* x d                  • Compute cross covariance matrix K* (n* x n)
                                                               • Compute mean prediction on y* using
• Covariance function
     •
                                                                 • Compute variance of prediction using
• Goal
     • Predict y* corresponding to X*


Algorithm Analysis
• Storage Complexity: Storing covariance
matrix O(n2)
• Time Complexity: Computing matrix
inversion O(n3)


                                                                V. Tresp. Mixtures of Gaussian processes. In Todd K. Leen, Thomas G.
                                                                Dietterich, and Volker Tresp, editors, Advances in Neural Information
                                                                Processing Systems 13, pages 654–660. MIT Press, 2001.
GP–V: Scaling to 3 million points
                           250                                                                          GP
                                                                                                        GP-V
                           200
      Run time (seconds)


                                                            Analysis on simulated data
                           150

                           100

                            50

                            0 2        3                4                   5                  6                    7
                            10    10              10           10                          10                  10
                                               Data points (log scale)
• Input data dimension =5
• Number of sample points = 3 million. New method under review at ICDM 2010 for
distributed implementation for massive data sets (K. Das and A. N. Srivastava).
• Run time = time to build the model + time to evaluate 500 test points
• Hyper parameters trained on 100 sample points L. Foster, A. Waagen, N.A. N. Srivastava, “Stable andRinsky, C. Gaussian
                                                      M. J. Way, P. Gazis, and
                                                                               Aijaz, M. Hurley, A. Luis, J.
                                                                                                             Efficient
                                                                                                                       Satyavolu,

• Accuracy does not degrade with approximation        Process Calculations,” Journal of Machine Learning Research, 10(Apr):857-
                                                      -882, 2009.
How do we get the Word Out?
     DASHlink
disseminate. collaborate. innovate.
   https://dashlink.arc.nasa.gov/

DASHlink is a collaborative
website designed to promote:
• Sustainability
• Reproducibility
• Dissemination
• Community building

Users can create profiles
• Share papers, upload and
download opensource algorithms
• Find NASA data sets.

Coming Soon… DASHlink 2.0.
Real World Impact: Flight Operations at
                    Southwest Airlines
• NASA has open-sourced many
  of its key data mining algorithms
  for analysis of data from flight
  data recorders through
  DASHlink, our Web 2.0 portal for
  the world.
• Southwest Airlines obtained
  copies of sequenceMiner and             dashlink.arc.nasa.gov
  Orca, two advanced anomaly
  detection techniques.
• Early results indicate that
  operationally significant events
  have been discovered by these     • Southwest Airlines
  algorithms that would not be        plans to incorporate
  triggered by their existing         algorithms into daily
  methods.                            operations.
Mining Human Performance and Flight Data
Physiological Measurements                                                               Sample Text
                                                                                         Report
                                                Luton, UK                                JUST PRIOR
                                                                                         TO
                             To EasyJet               To NASA Data Mining Team           TOUCHDOWN,
                             • Near real-time         • Daily data                       LAX TWR
                             decision support         • 300 GB flights per month
                             • Understanding                                             TOLD US TO
                                                      • Physiology, text, cockpit,       GO AROUND
                             fatigue with an          engines and flight parameters,
                             objective                flight path, network nformation.   BECAUSE OF
                             approach                                                    THE ACFT IN
                                                                                         FRONT OF US.
                                                                                         ...


                               NASA Data Mining Lab (Mountain View, CA)

                               Key question: How does fatigue effect
                               aviation safety?
Data Mining in Scientific Domains
 • Aeronautical Systems
        – 100K flights per month
 • Earth and Space Science
        – Earth Observing System generates ~21 TB of data
          per week.
        – Ames simulations generating 1-5 TB per day
 • Exploration Systems
        – Space Shuttle and International Space station
          downlinks about 1.5GB per day.
 • Kepler Planetary Discovery Data Systems
        – 100K solar systems every 30 minutes

Researchers world-wide can work with us in numerous domains through our new collaborative portal
Introducing NASA Earth Exchange (NEX)
                 Collaborative Earth Science


NEX provides a platform for researchers to share information and data derived from NASA’s Earth
observing satellites. Its goal is to encourage exploration and collaboration to create new ways to
                             understand and improve life here on Earth.

                                   Public Release: August 2010
NEX website and DASHlink 2.0 Capabilities
• Collaboration with NASA on Projects (and initiating the process for further collaboration with NEX
researchers on NASA supercomputing facilities).
• Share Resources: Papers, algorithms, data sets etc.
• Find and contact other researchers in your field via member profiles.
• Learn about other cutting edge work at NASA and beyond.
• Cross reference work on DASHlink and NEX.
NASA Earth Exchange Components
The Data Mining Team

   Group Members                                Funding Sources
Ashok N. Srivastava
                               • NASA Aeronautics Research Mission
Kanishka Bhaduri
Kamalika Das                     Directorate- IVHM Project
Santanu Das                    • NASA Engineering and Safety Center
Elizabeth Foughty
                               • Exploration Systems Mission Directorate
Dave Iverson
Rodney Martin                    Exploration Technology Development
Bryan Matthews                   Program, ISHM Project
Dawn McIntosh                  • Science Mission Directorate
Nikunj Oza
Mark Schwabacher
John Stutz
David Wolpert
+ 7 summer students

         Team Members are NASA Employees, Contractors, and Students.
                                                                           •21

Srivastava KDD 2010 Presentation

  • 1.
    Discovering Precursors to Aviation Safety Incidents: from Massive Data to Actionable Information Ashok N. Srivastava Principal Investigator, IVHM Project Group Lead, Intelligent Data Understanding ashok.n.srivastava@nasa.gov
  • 2.
    A Day inthe Life of the National Airspace
  • 3.
  • 4.
    Proactively Managing Risk IDENTIFY A Strategy for IMPLEMENT Safety EVALUATE Improvement FORMULATE Reduce the accident rate by identifying and responding to precursor events before accidents occur.
  • 5.
    Data Mining inSupport of Global Operations 105 Data sharing Just culture / safety culture 10-6 10-5 10-4 10-3 10-2 10-1 100 101 102 103 104 105 106
  • 6.
    Data Arises fromMolecular to Global Scales Molecules Materials Sensors Software Engines Aircraft Vehicle Technology Operations 10-6 10-5 10-4 10-3 10-2 10-1 100 101 102 103 104 105 106
  • 7.
    The Anatomy ofan Aviation Safety Incident Safe Compromised States Anomolous Safe States or Accidents States Incident Transition Transition Transition Transition Transition Transition k-1 k k+1 n-2 n-1 n ...... State k -1 State k State k+1 State n -1 State n State n+1 Time Scenario = ( Context Behavior Outcome) From Irving Statler, Aviation Safety Monitoring and Modeling Project
  • 8.
    Where are PrecursorsFound? SUBJECTIVE -- data continuum ---OBJECTIVE Accident Data Forensics What Happened? Discrete and Continuous Data Operational Data Discovering Causal Factors Why did it Happen? Operational Surveys Text Data Anecdotal Reports Predictions What will Happen Next? Projections From Irving Statler, Aviation Safety Monitoring and Modeling Project
  • 9.
    Aviation Safety ReportExcerpt JUST PRIOR TO TOUCHDOWN, LAX TWR TOLD US TO GO AROUND BECAUSE OF THE ACFT IN FRONT OF US. BOTH THE COPLT AND I, HOWEVER, UNDERSTOOD TWR TO SAY, 'CLRED TO LAND, ACFT ON THE RWY.' SINCE THE ACFT IN FRONT OF US WAS CLR OF THE RWY AND WE BOTH MISUNDERSTOOD TWR'S RADIO CALL AND CONSIDERED IT AN ADVISORY, WE LANDED... • Can answers why an incident happened • Over 100K reports • Multiple authors (multi lingual writers) • Inconsistent use of abbreviations and punctuation
  • 10.
    Mining Heterogeneous Datais the Key • Primary Source: aircraft • Primary Source: Humans • Can answer what happened • Can answer why an in an aircraft during an Discrete Aviation Safety Incident Aviation Safety Incident happened Sample Text Report JUST PRIOR TO TOUCHDOWN, Continuous K(xi,xj) Textual LAX TWR TOLD US TO GO AROUND BECAUSE OF THE ACFT IN FRONT OF US. • Primary Source: ... Radar data • Can answer what happened in the National Networks Massive Data: Airspace during Aviation Archives growing at 100K flights per month. Safety Incident
  • 11.
    Mercer Kernel BasedApproaches for Discrete, Continuous, Textual, and other Sources Multiple Kernel Anomaly Detection (KDD 2010) 5 4 Unique 1    3 Linear Q    i j     K i , j  3 Decision  2 min 2 i, j    1 Boundary 0 0 2 4 6  Subject to: i  1 1 i   0,1, 1 0  i  , i l Talk at 5 pm today, Independence A
  • 12.
    Gaussian Process Regression for Discrete and Continuous Sources (typically for small problems, see below) • Training data • Model building • data matrix of observations – n x d • Train hyperparameters on a sample of X • y vector of target data – n x 1 • Compute covariance matrix K (n x n) • Test data • Prediction • X* matrix of new observations – n* x d • Compute cross covariance matrix K* (n* x n) • Compute mean prediction on y* using • Covariance function • • Compute variance of prediction using • Goal • Predict y* corresponding to X* Algorithm Analysis • Storage Complexity: Storing covariance matrix O(n2) • Time Complexity: Computing matrix inversion O(n3) V. Tresp. Mixtures of Gaussian processes. In Todd K. Leen, Thomas G. Dietterich, and Volker Tresp, editors, Advances in Neural Information Processing Systems 13, pages 654–660. MIT Press, 2001.
  • 13.
    GP–V: Scaling to3 million points 250 GP GP-V 200 Run time (seconds) Analysis on simulated data 150 100 50 0 2 3 4 5 6 7 10 10 10 10 10 10 Data points (log scale) • Input data dimension =5 • Number of sample points = 3 million. New method under review at ICDM 2010 for distributed implementation for massive data sets (K. Das and A. N. Srivastava). • Run time = time to build the model + time to evaluate 500 test points • Hyper parameters trained on 100 sample points L. Foster, A. Waagen, N.A. N. Srivastava, “Stable andRinsky, C. Gaussian M. J. Way, P. Gazis, and Aijaz, M. Hurley, A. Luis, J. Efficient Satyavolu, • Accuracy does not degrade with approximation Process Calculations,” Journal of Machine Learning Research, 10(Apr):857- -882, 2009.
  • 14.
    How do weget the Word Out? DASHlink disseminate. collaborate. innovate. https://dashlink.arc.nasa.gov/ DASHlink is a collaborative website designed to promote: • Sustainability • Reproducibility • Dissemination • Community building Users can create profiles • Share papers, upload and download opensource algorithms • Find NASA data sets. Coming Soon… DASHlink 2.0.
  • 15.
    Real World Impact:Flight Operations at Southwest Airlines • NASA has open-sourced many of its key data mining algorithms for analysis of data from flight data recorders through DASHlink, our Web 2.0 portal for the world. • Southwest Airlines obtained copies of sequenceMiner and dashlink.arc.nasa.gov Orca, two advanced anomaly detection techniques. • Early results indicate that operationally significant events have been discovered by these • Southwest Airlines algorithms that would not be plans to incorporate triggered by their existing algorithms into daily methods. operations.
  • 16.
    Mining Human Performanceand Flight Data Physiological Measurements Sample Text Report Luton, UK JUST PRIOR TO To EasyJet To NASA Data Mining Team TOUCHDOWN, • Near real-time • Daily data LAX TWR decision support • 300 GB flights per month • Understanding TOLD US TO • Physiology, text, cockpit, GO AROUND fatigue with an engines and flight parameters, objective flight path, network nformation. BECAUSE OF approach THE ACFT IN FRONT OF US. ... NASA Data Mining Lab (Mountain View, CA) Key question: How does fatigue effect aviation safety?
  • 17.
    Data Mining inScientific Domains • Aeronautical Systems – 100K flights per month • Earth and Space Science – Earth Observing System generates ~21 TB of data per week. – Ames simulations generating 1-5 TB per day • Exploration Systems – Space Shuttle and International Space station downlinks about 1.5GB per day. • Kepler Planetary Discovery Data Systems – 100K solar systems every 30 minutes Researchers world-wide can work with us in numerous domains through our new collaborative portal
  • 18.
    Introducing NASA EarthExchange (NEX) Collaborative Earth Science NEX provides a platform for researchers to share information and data derived from NASA’s Earth observing satellites. Its goal is to encourage exploration and collaboration to create new ways to understand and improve life here on Earth. Public Release: August 2010
  • 19.
    NEX website andDASHlink 2.0 Capabilities • Collaboration with NASA on Projects (and initiating the process for further collaboration with NEX researchers on NASA supercomputing facilities). • Share Resources: Papers, algorithms, data sets etc. • Find and contact other researchers in your field via member profiles. • Learn about other cutting edge work at NASA and beyond. • Cross reference work on DASHlink and NEX.
  • 20.
  • 21.
    The Data MiningTeam Group Members Funding Sources Ashok N. Srivastava • NASA Aeronautics Research Mission Kanishka Bhaduri Kamalika Das Directorate- IVHM Project Santanu Das • NASA Engineering and Safety Center Elizabeth Foughty • Exploration Systems Mission Directorate Dave Iverson Rodney Martin Exploration Technology Development Bryan Matthews Program, ISHM Project Dawn McIntosh • Science Mission Directorate Nikunj Oza Mark Schwabacher John Stutz David Wolpert + 7 summer students Team Members are NASA Employees, Contractors, and Students. •21