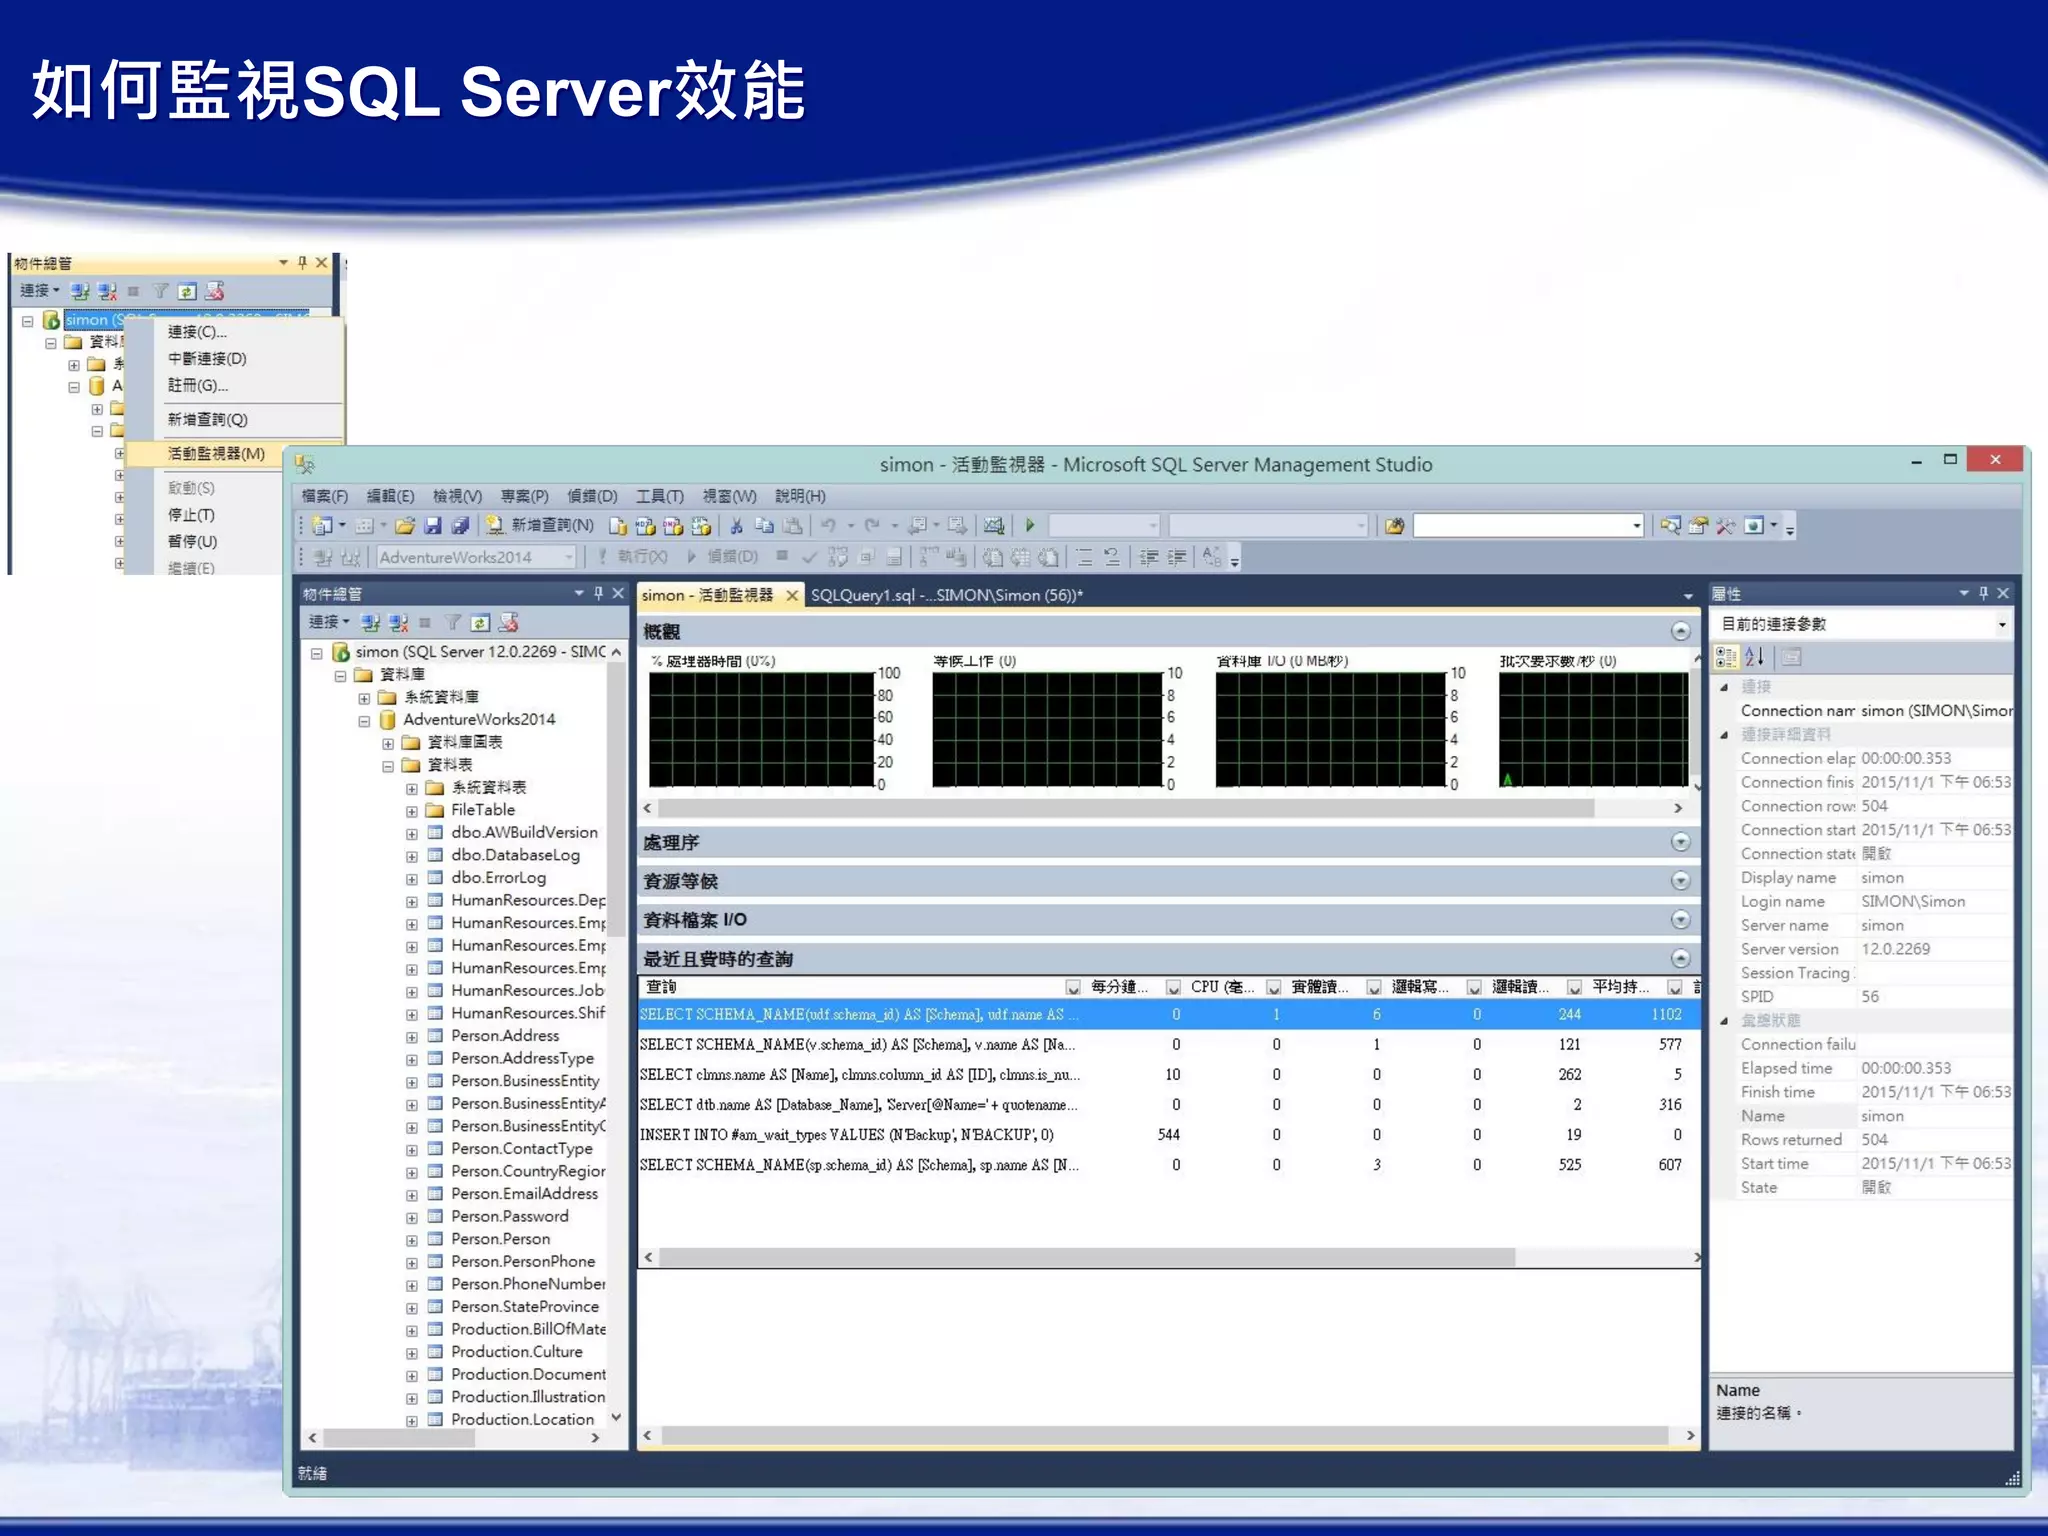
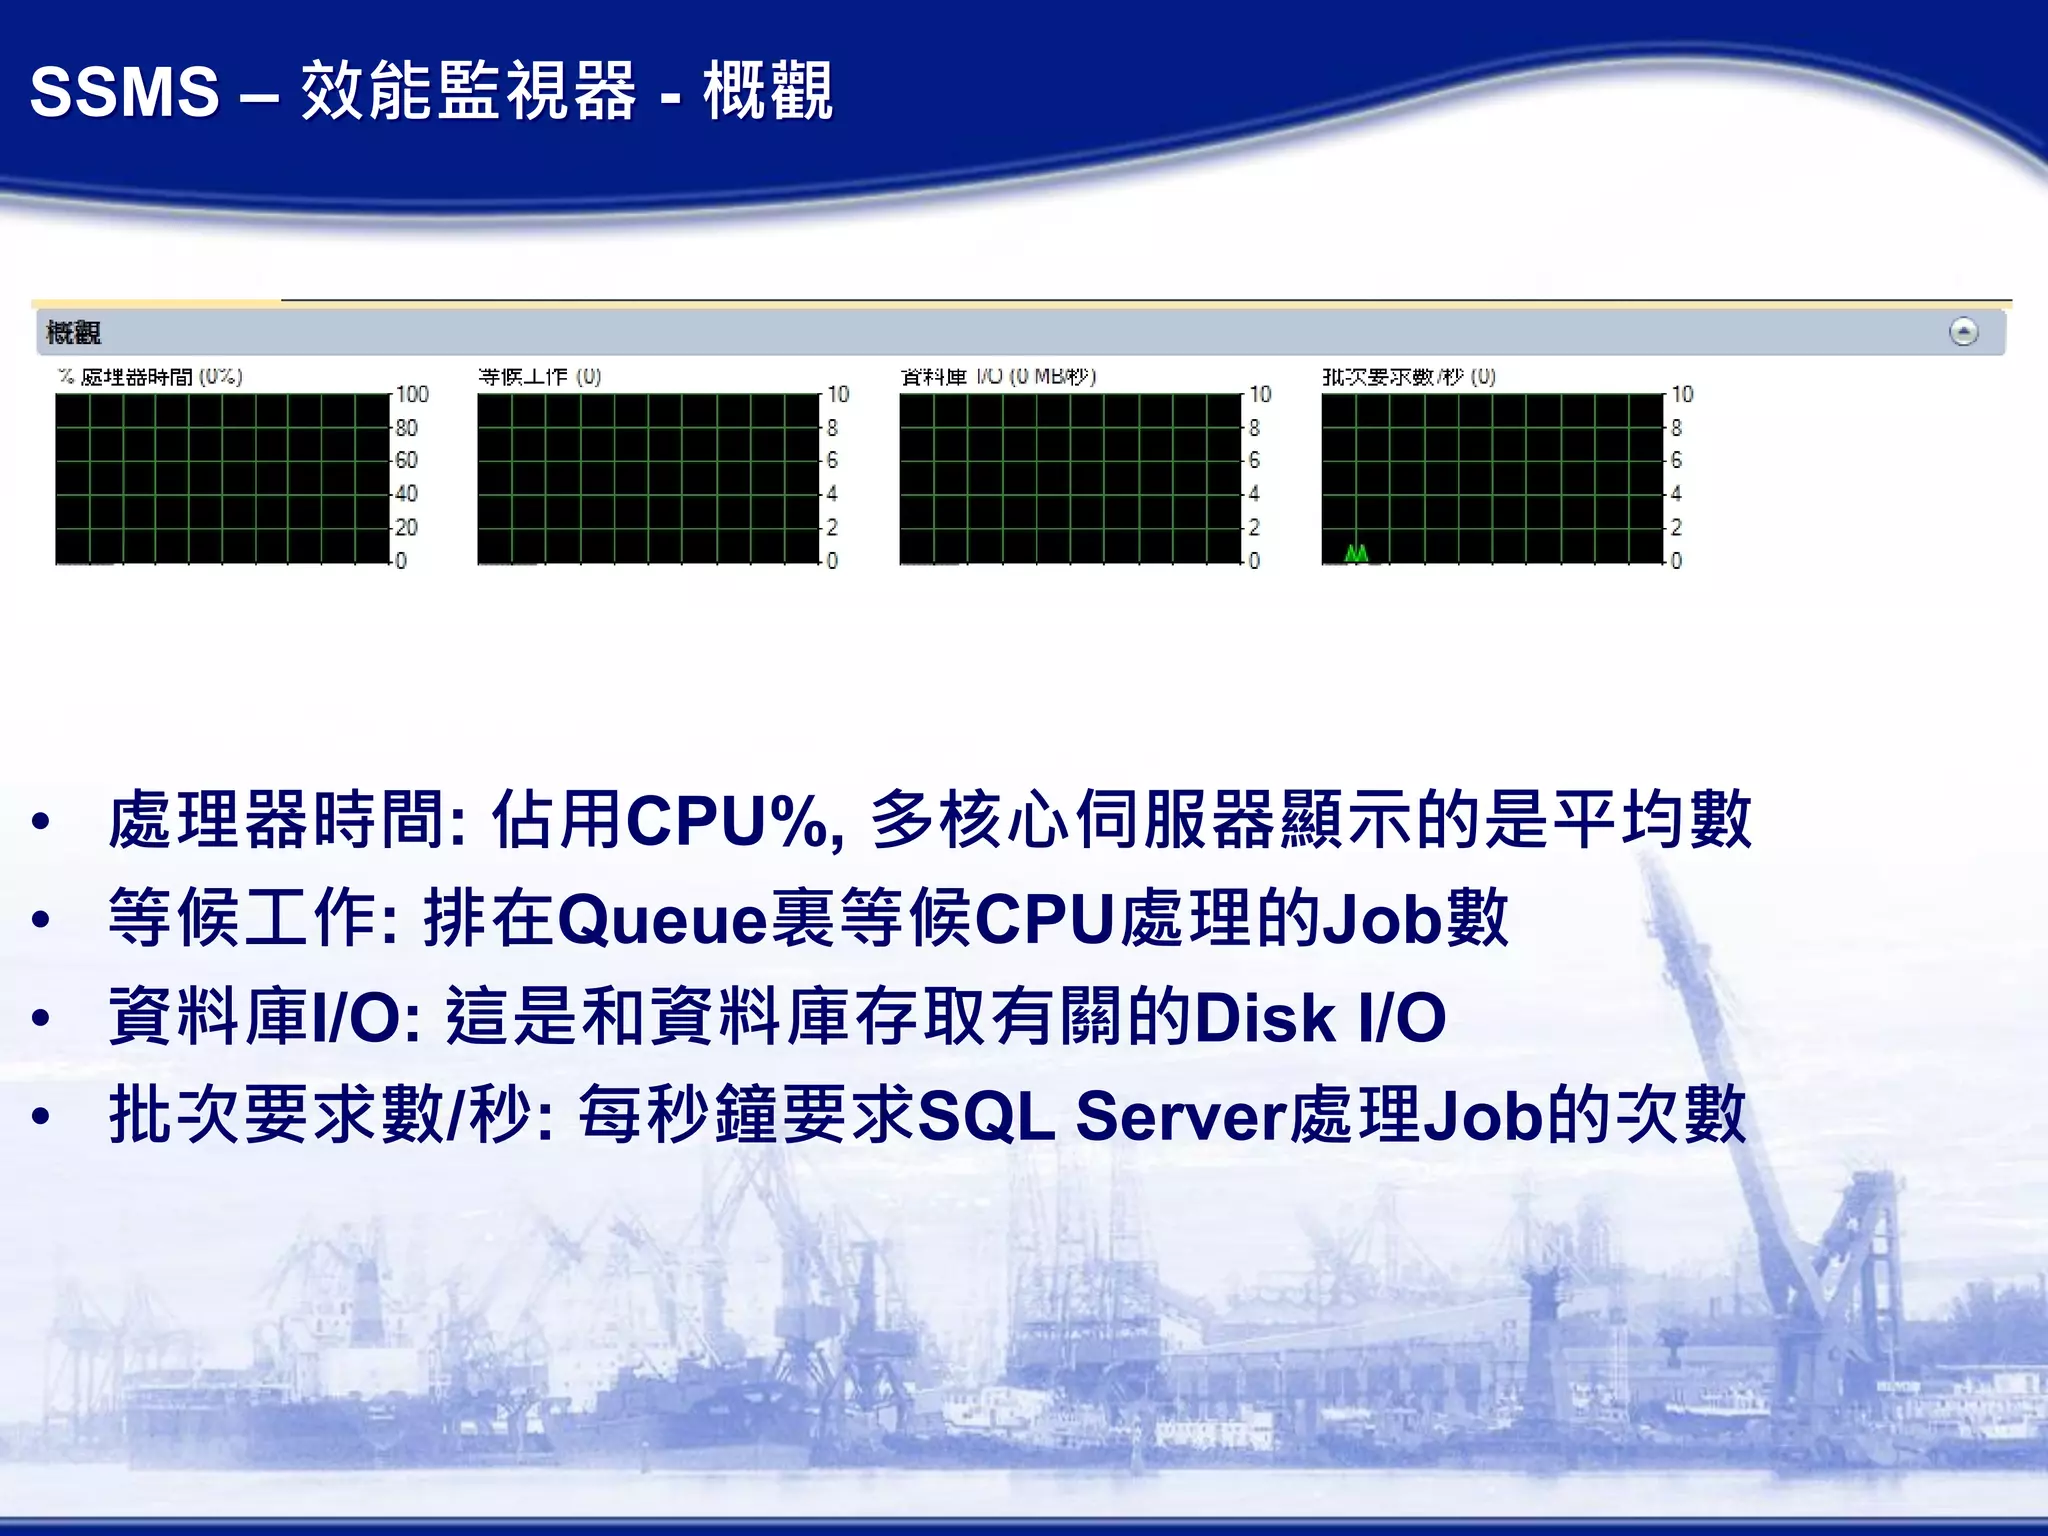
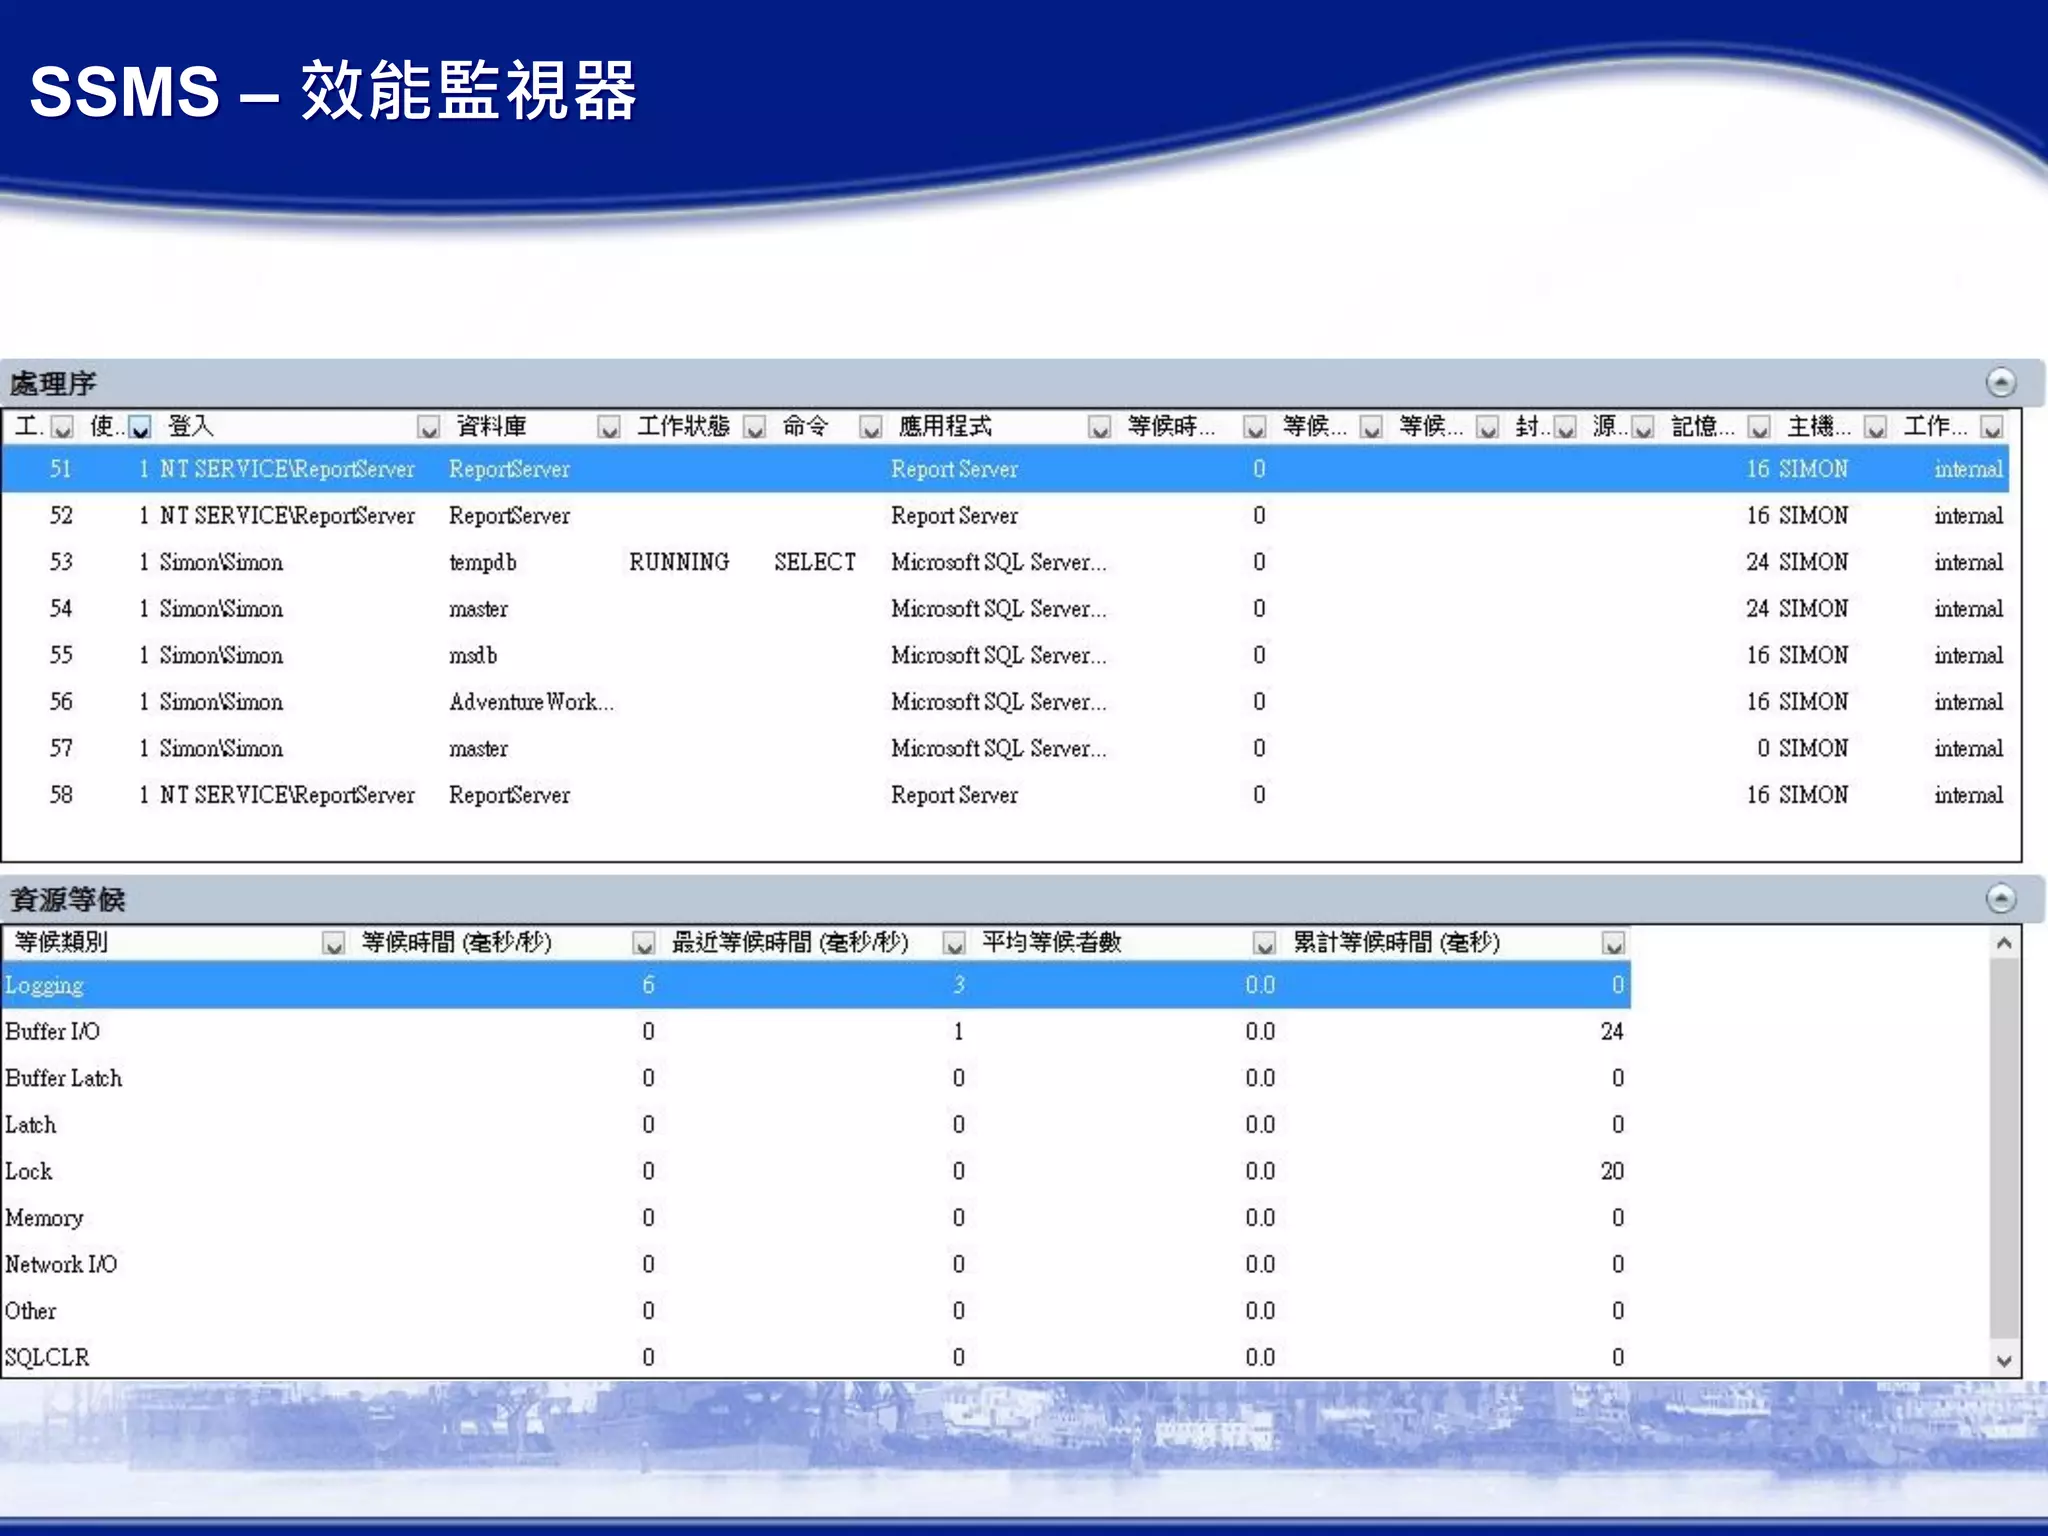
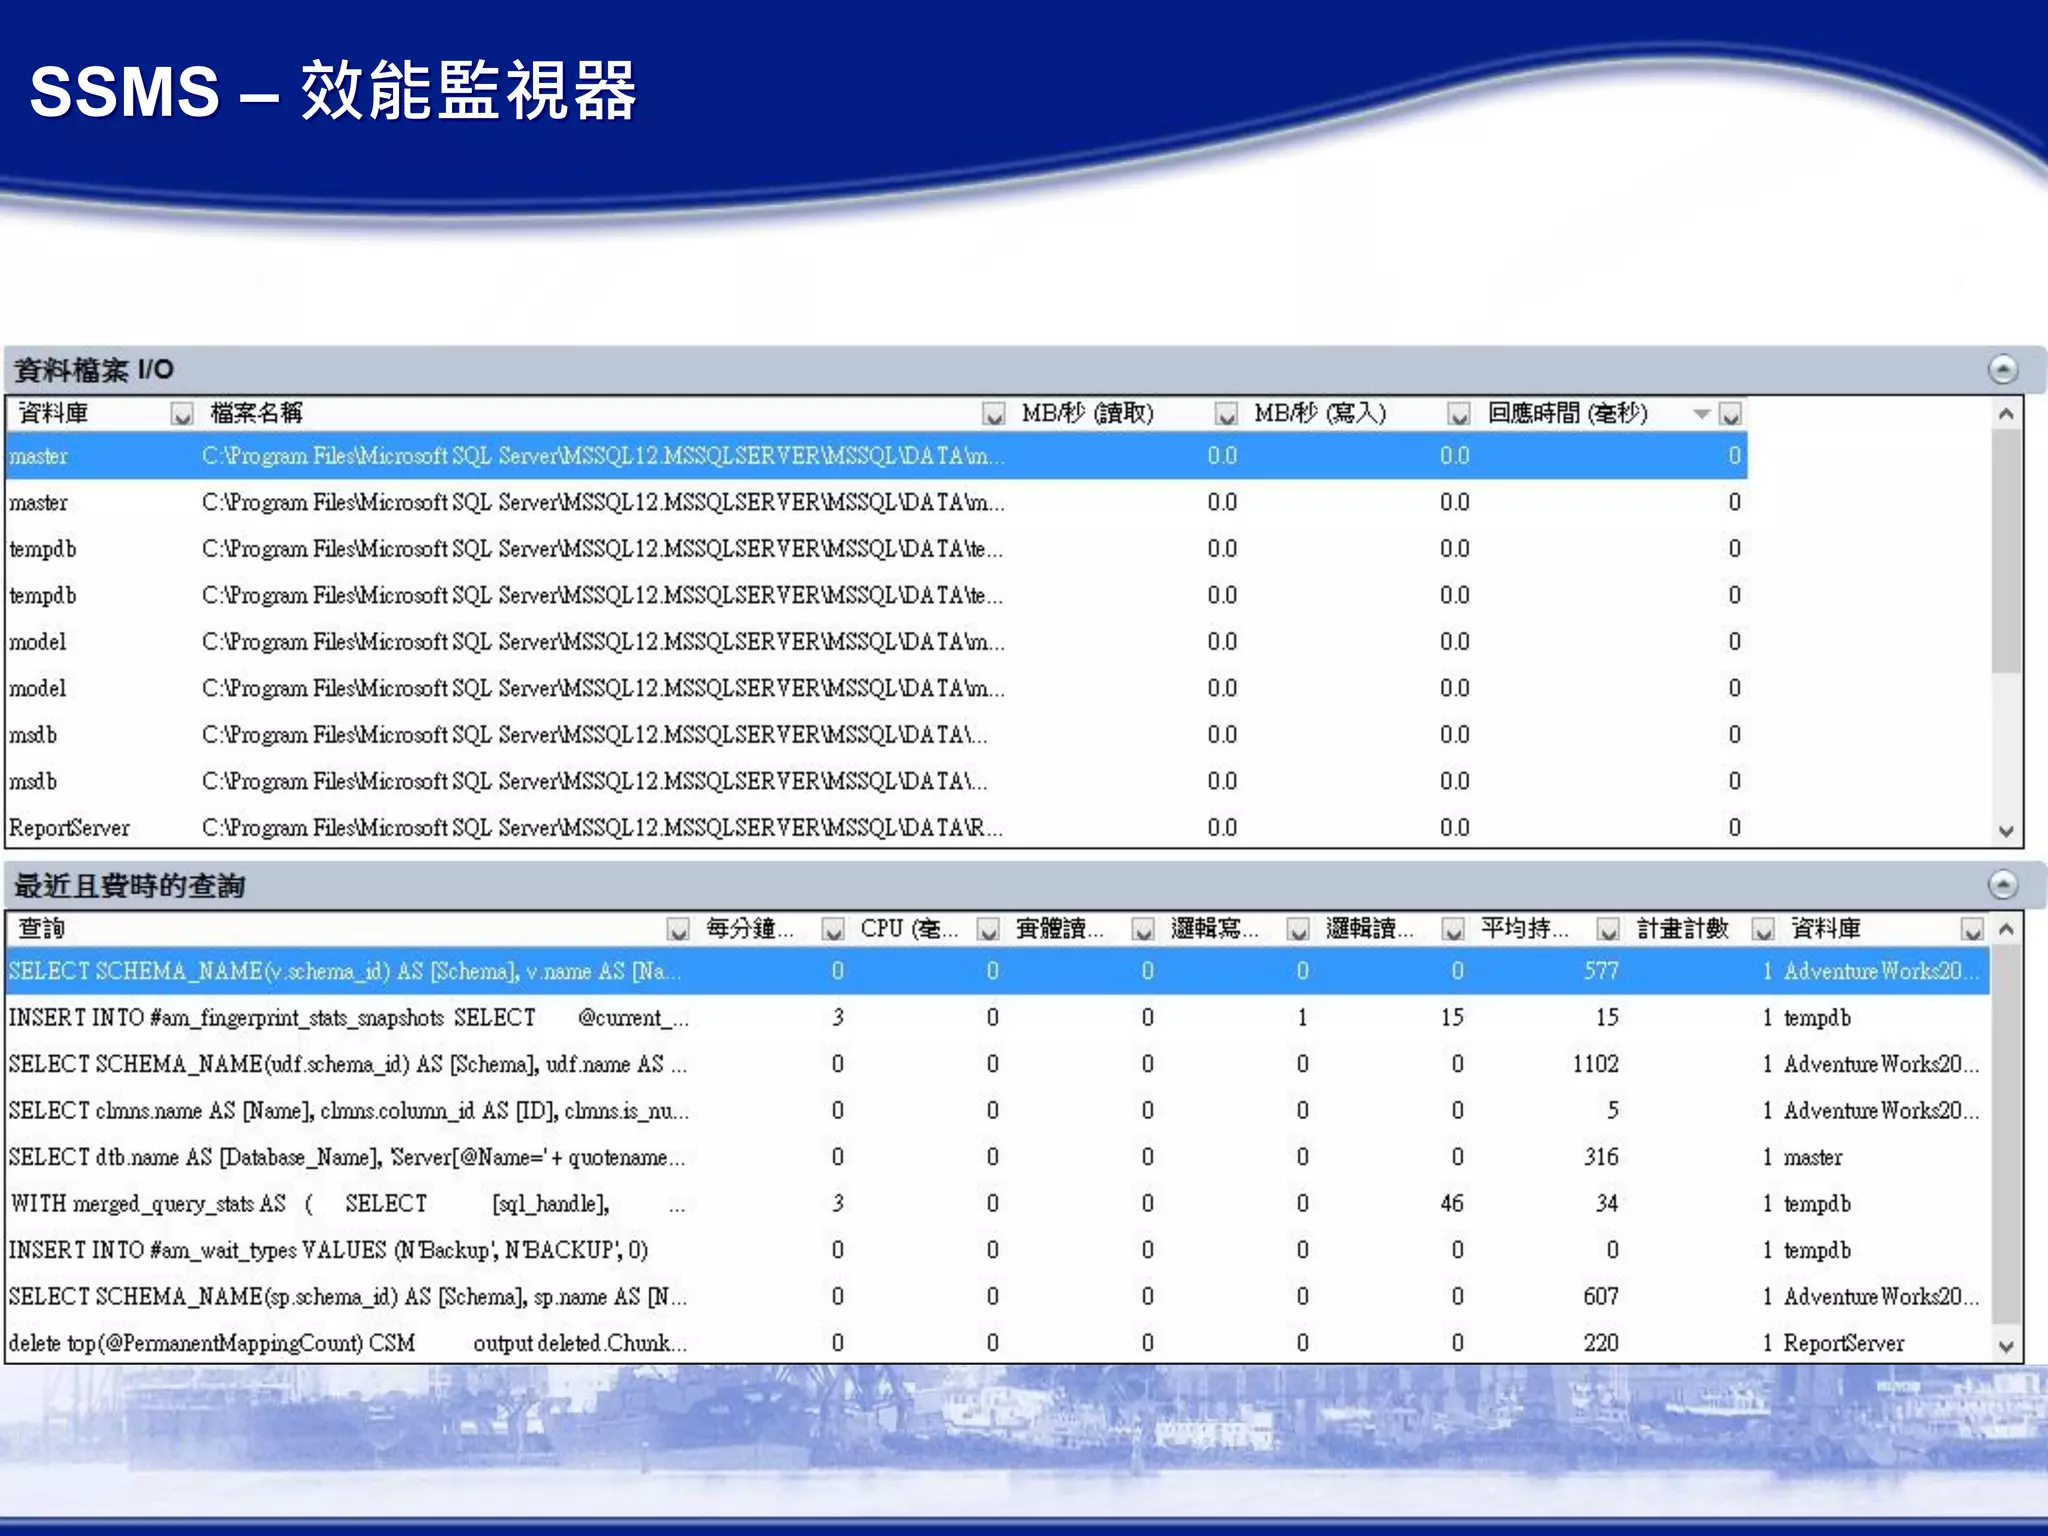
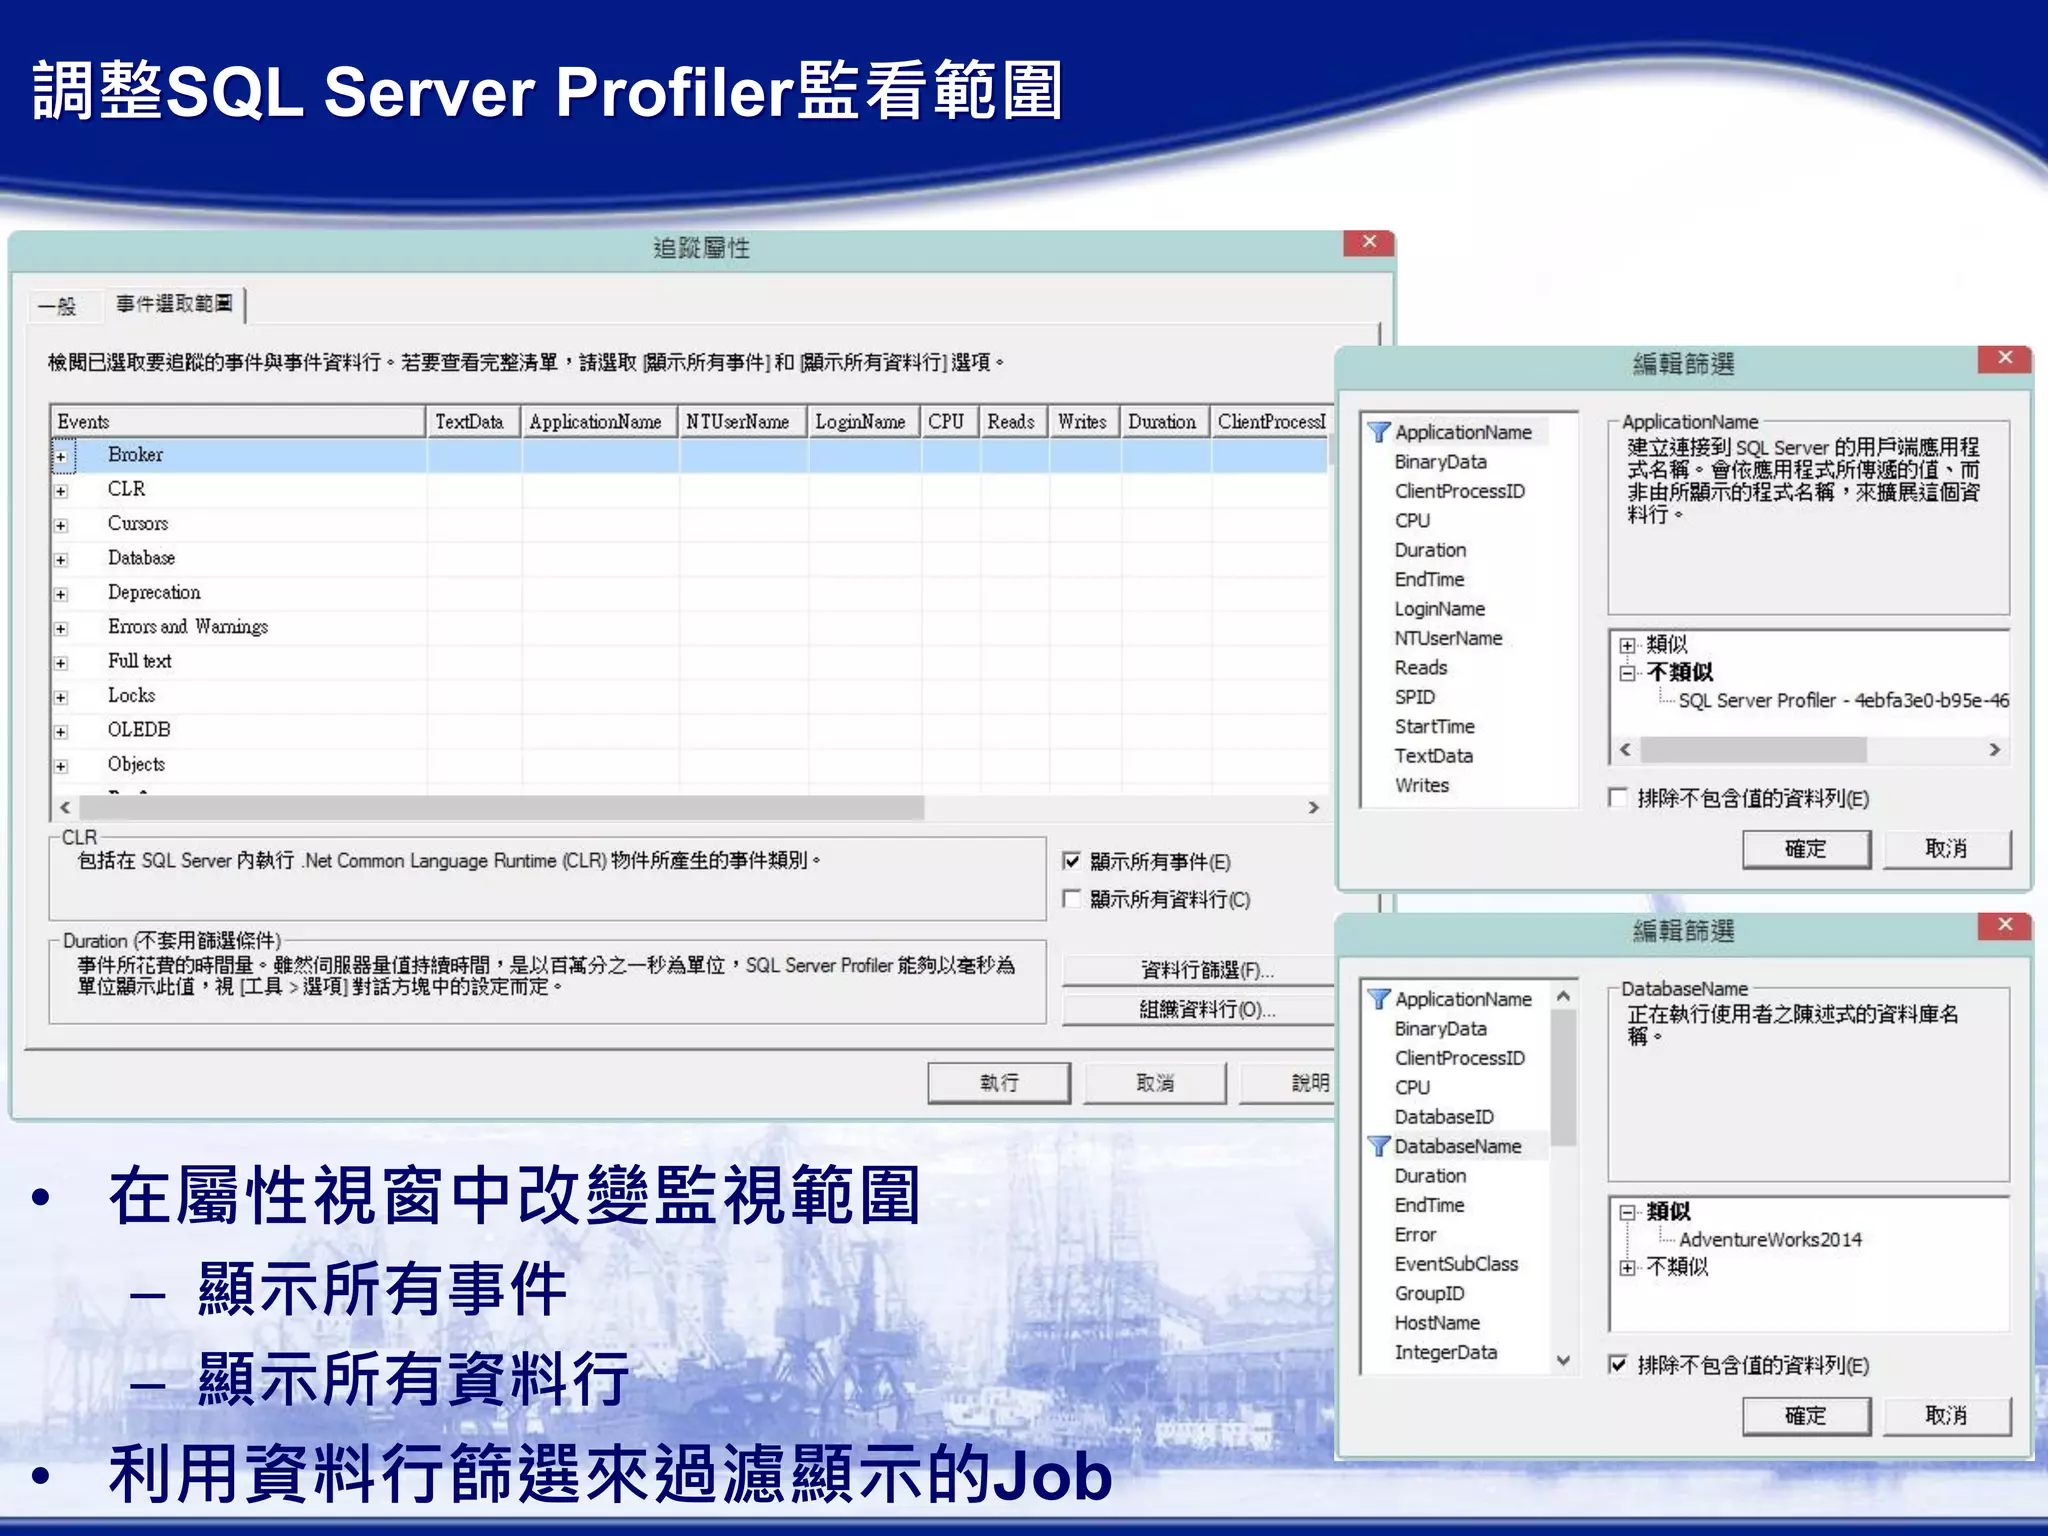
此文档讨论了 SQL Server 性能优化的各个方面,包括使用 SQL Profiler 和执行计划来监测和改进数据库性能。它介绍了如何使用 SQL Server Management Studio 监视 SQL Server 效能,包括处理器时间、等待工作和数据库 I/O。还强调了理解执行计划的重要性以及如何通过调整成本和索引使用来改善 SQL 语句的执行效率。
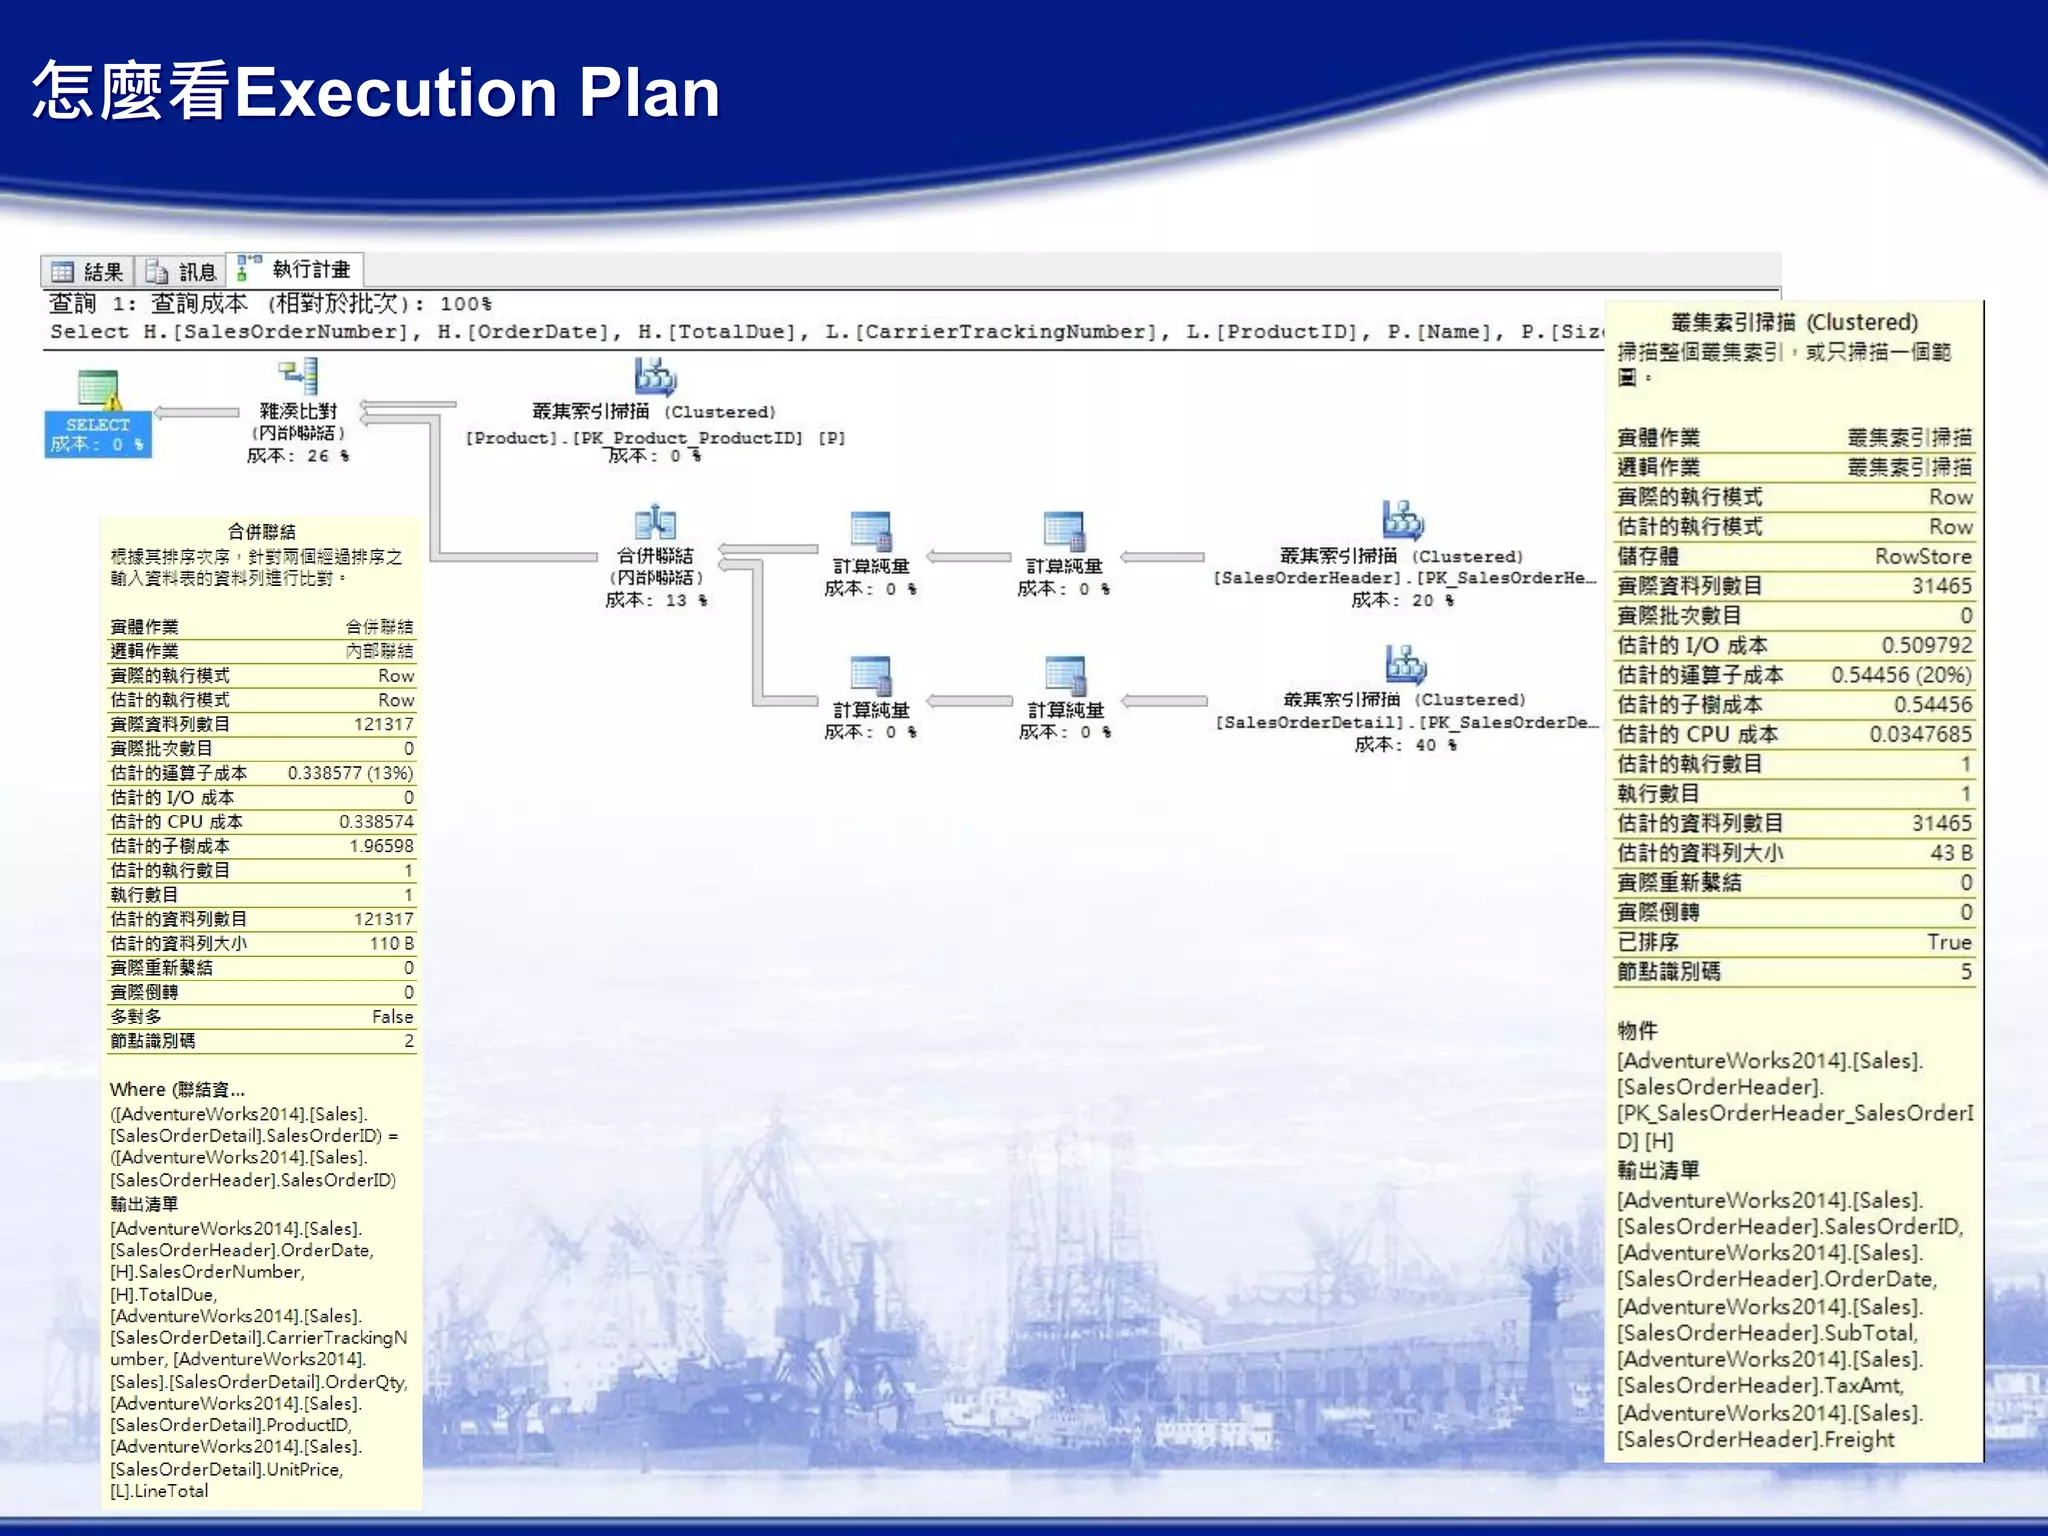
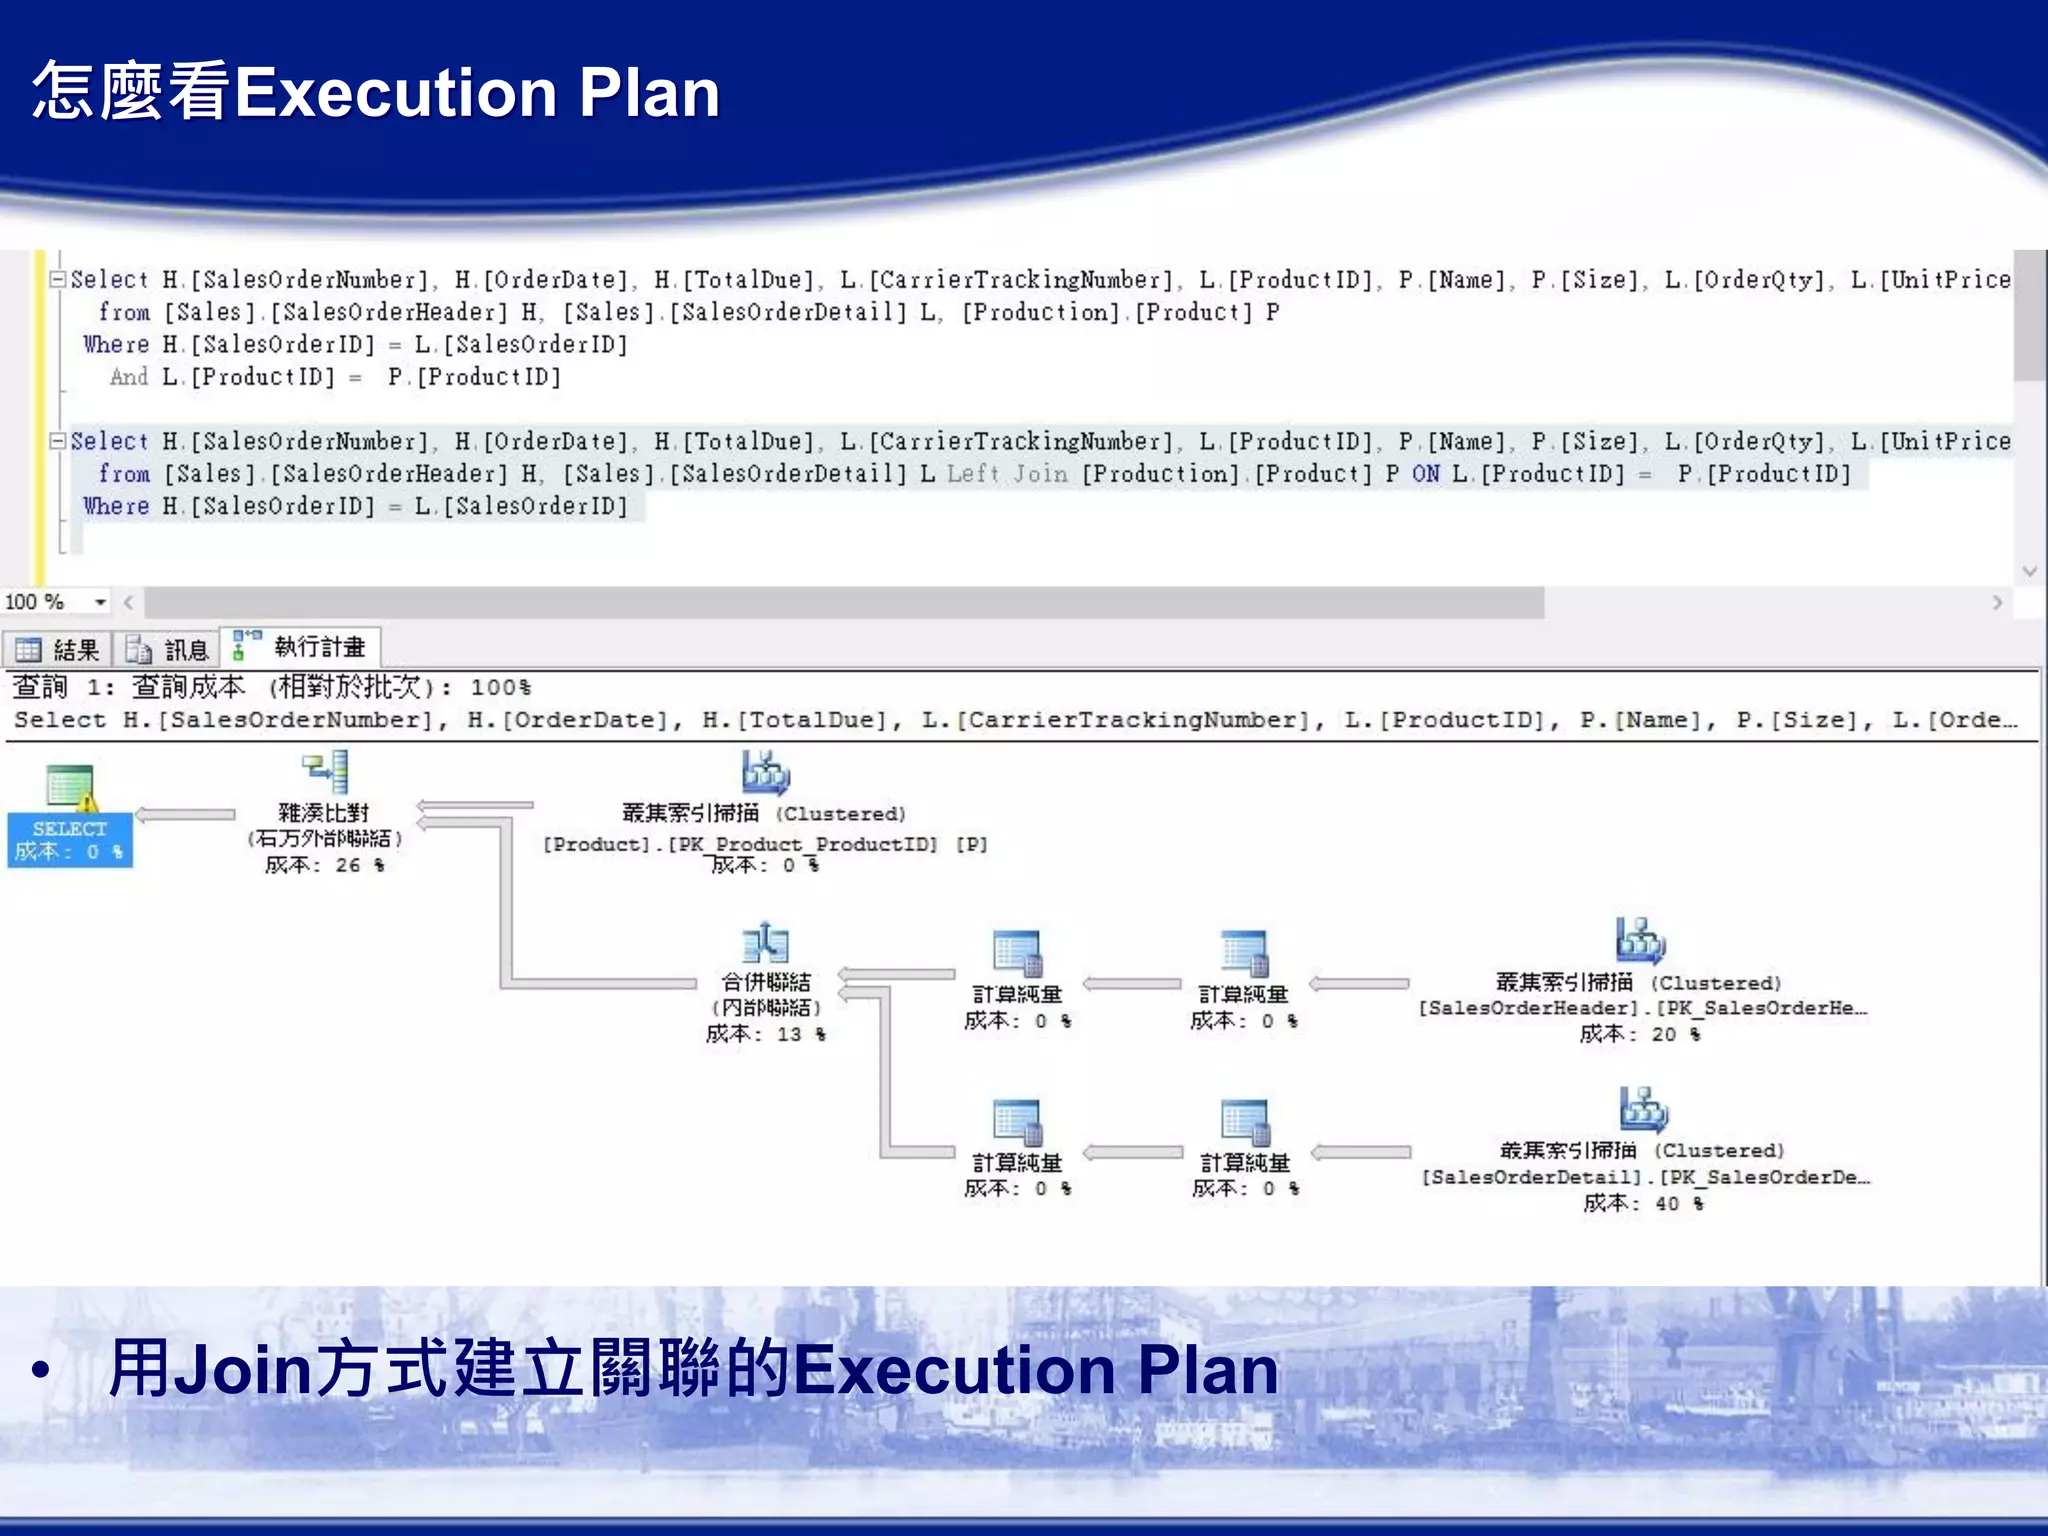
Execution (Query) Plan
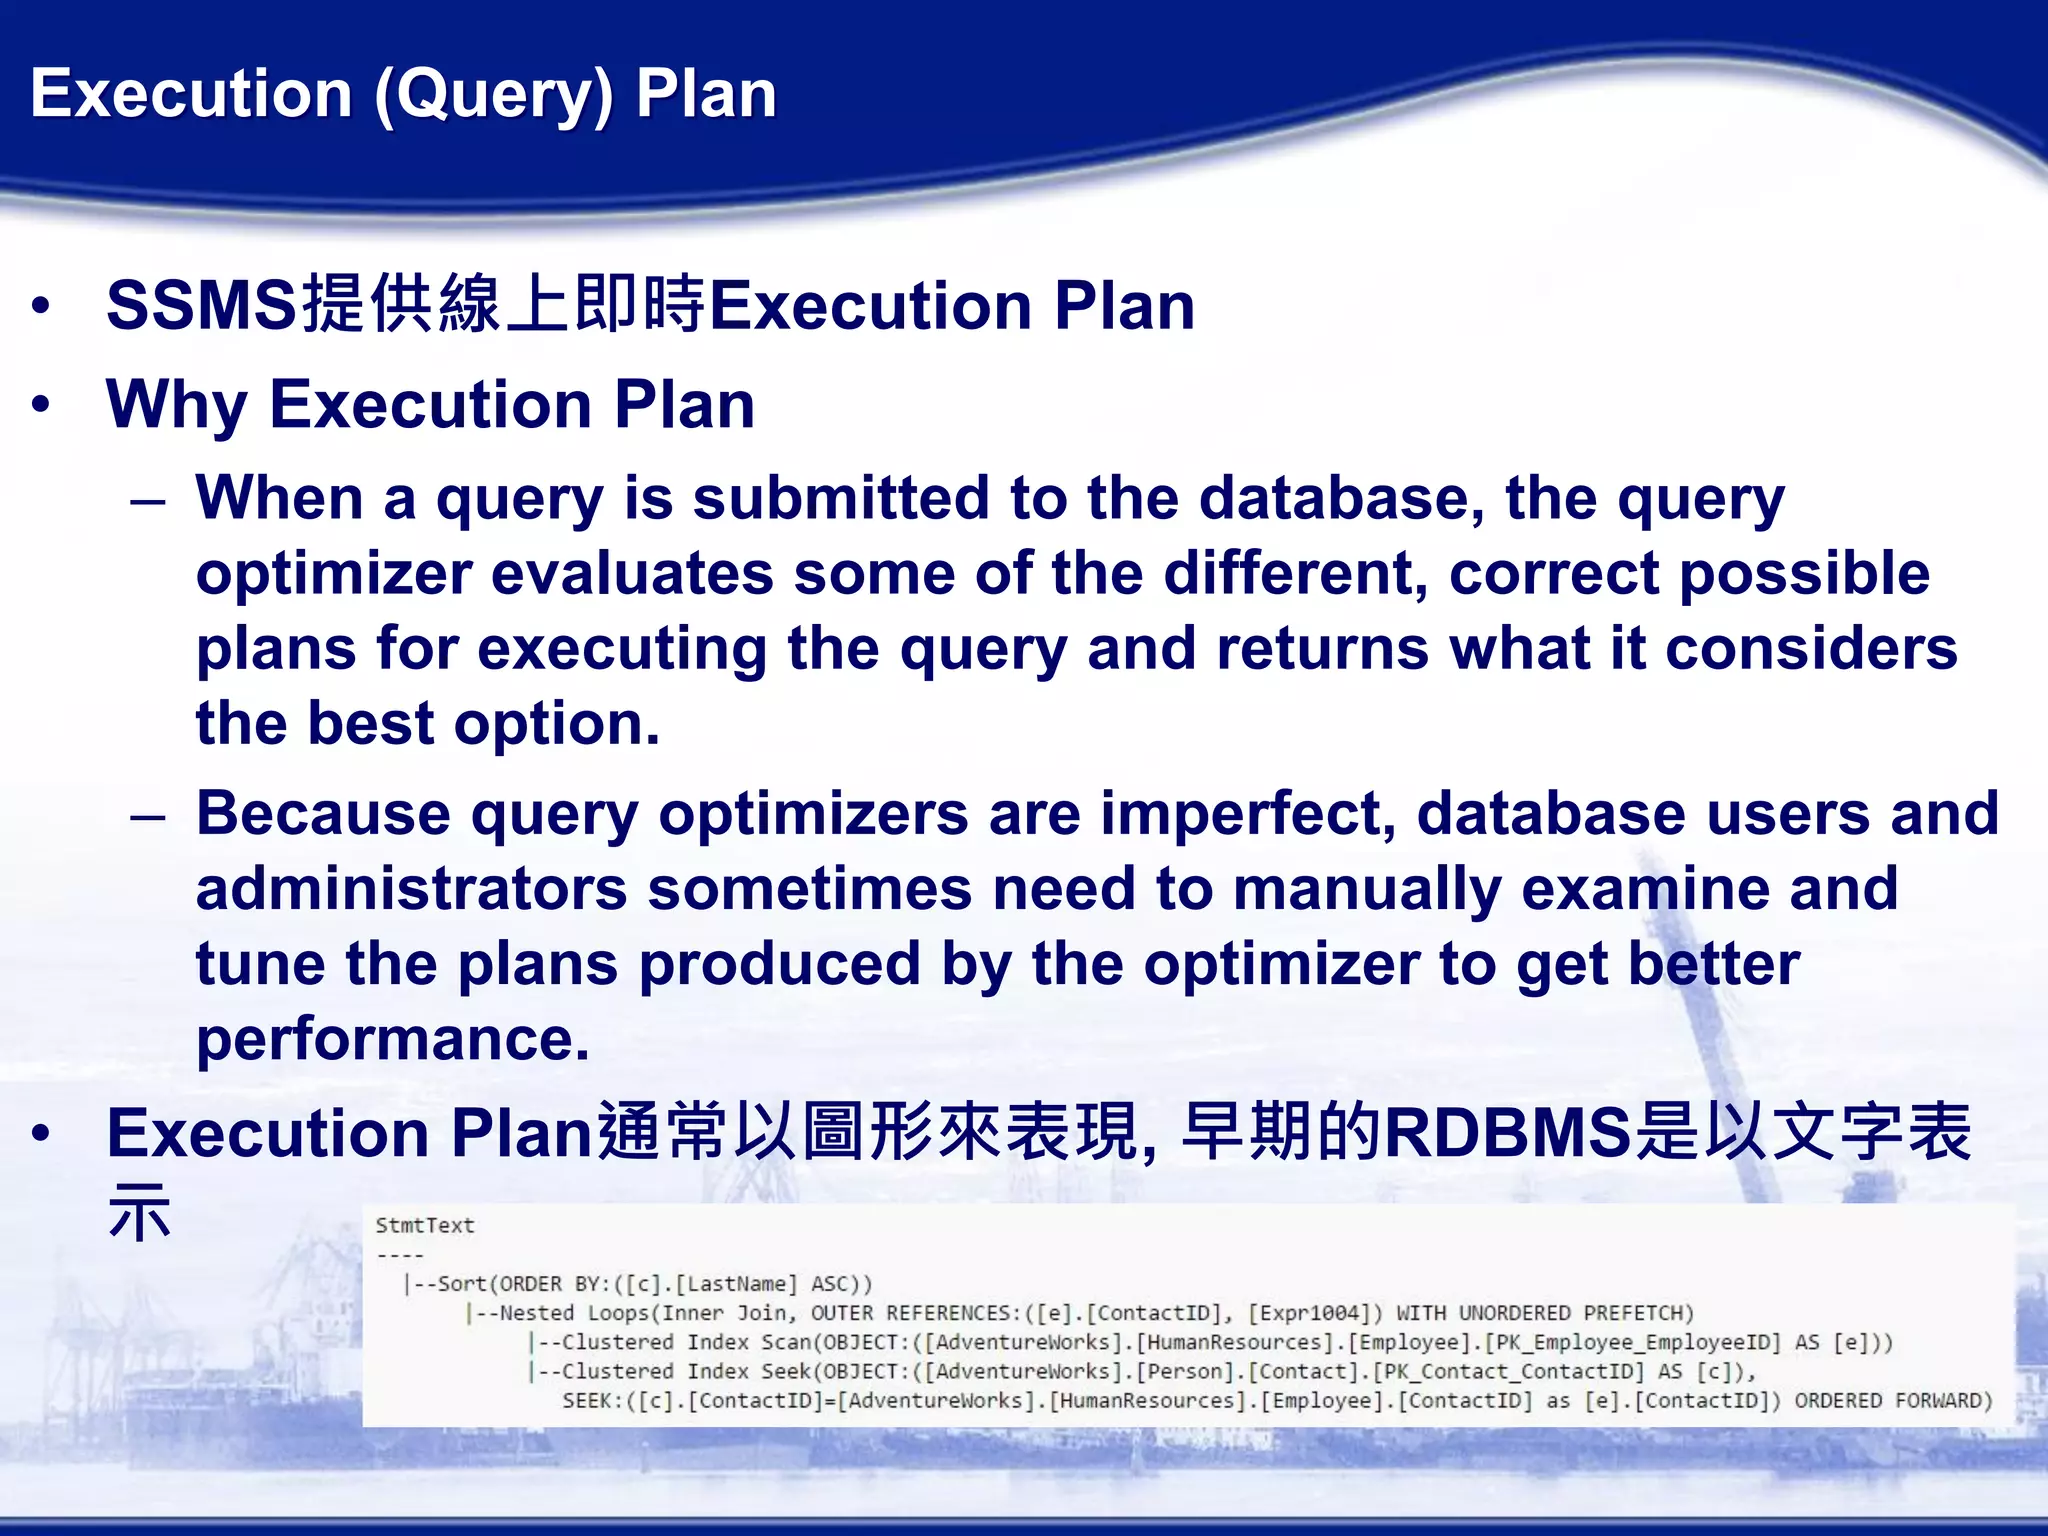
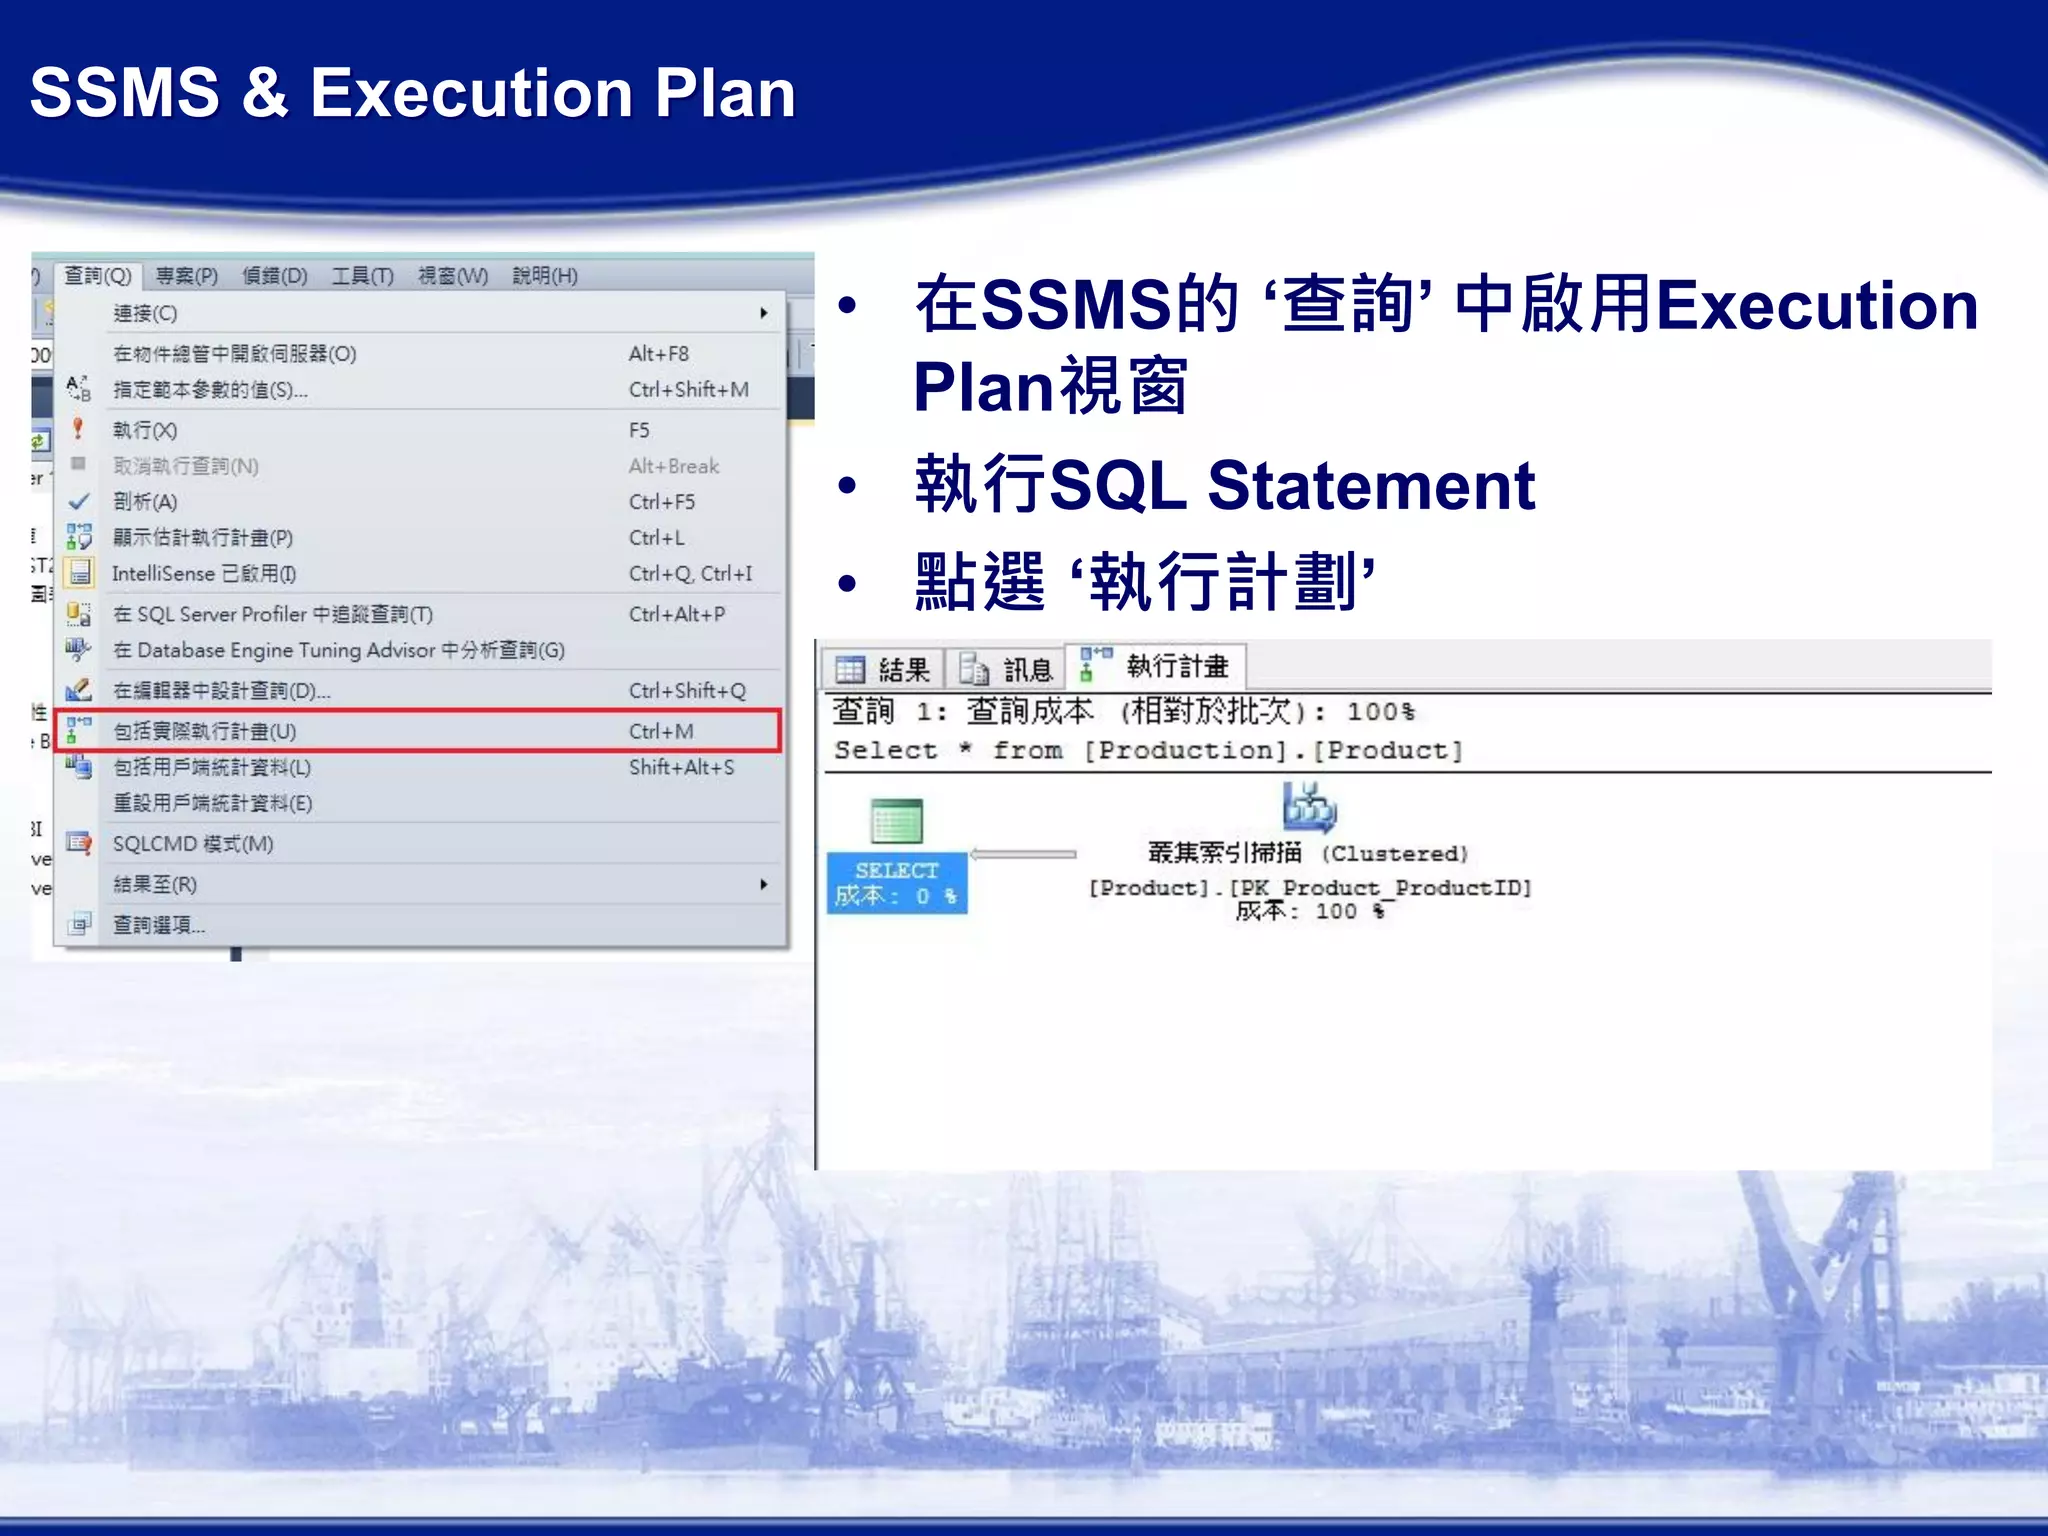
•SSMS提供線上即時Execution Plan
• Why Execution Plan
– When a query is submitted to the database, the query
optimizer evaluates some of the different, correct possible
plans for executing the query and returns what it considers
the best option.
– Because query optimizers are imperfect, database users and
administrators sometimes need to manually examine and
tune the plans produced by the optimizer to get better
performance.
• Execution Plan通常以圖形來表現, 早期的RDBMS是以文字表
示
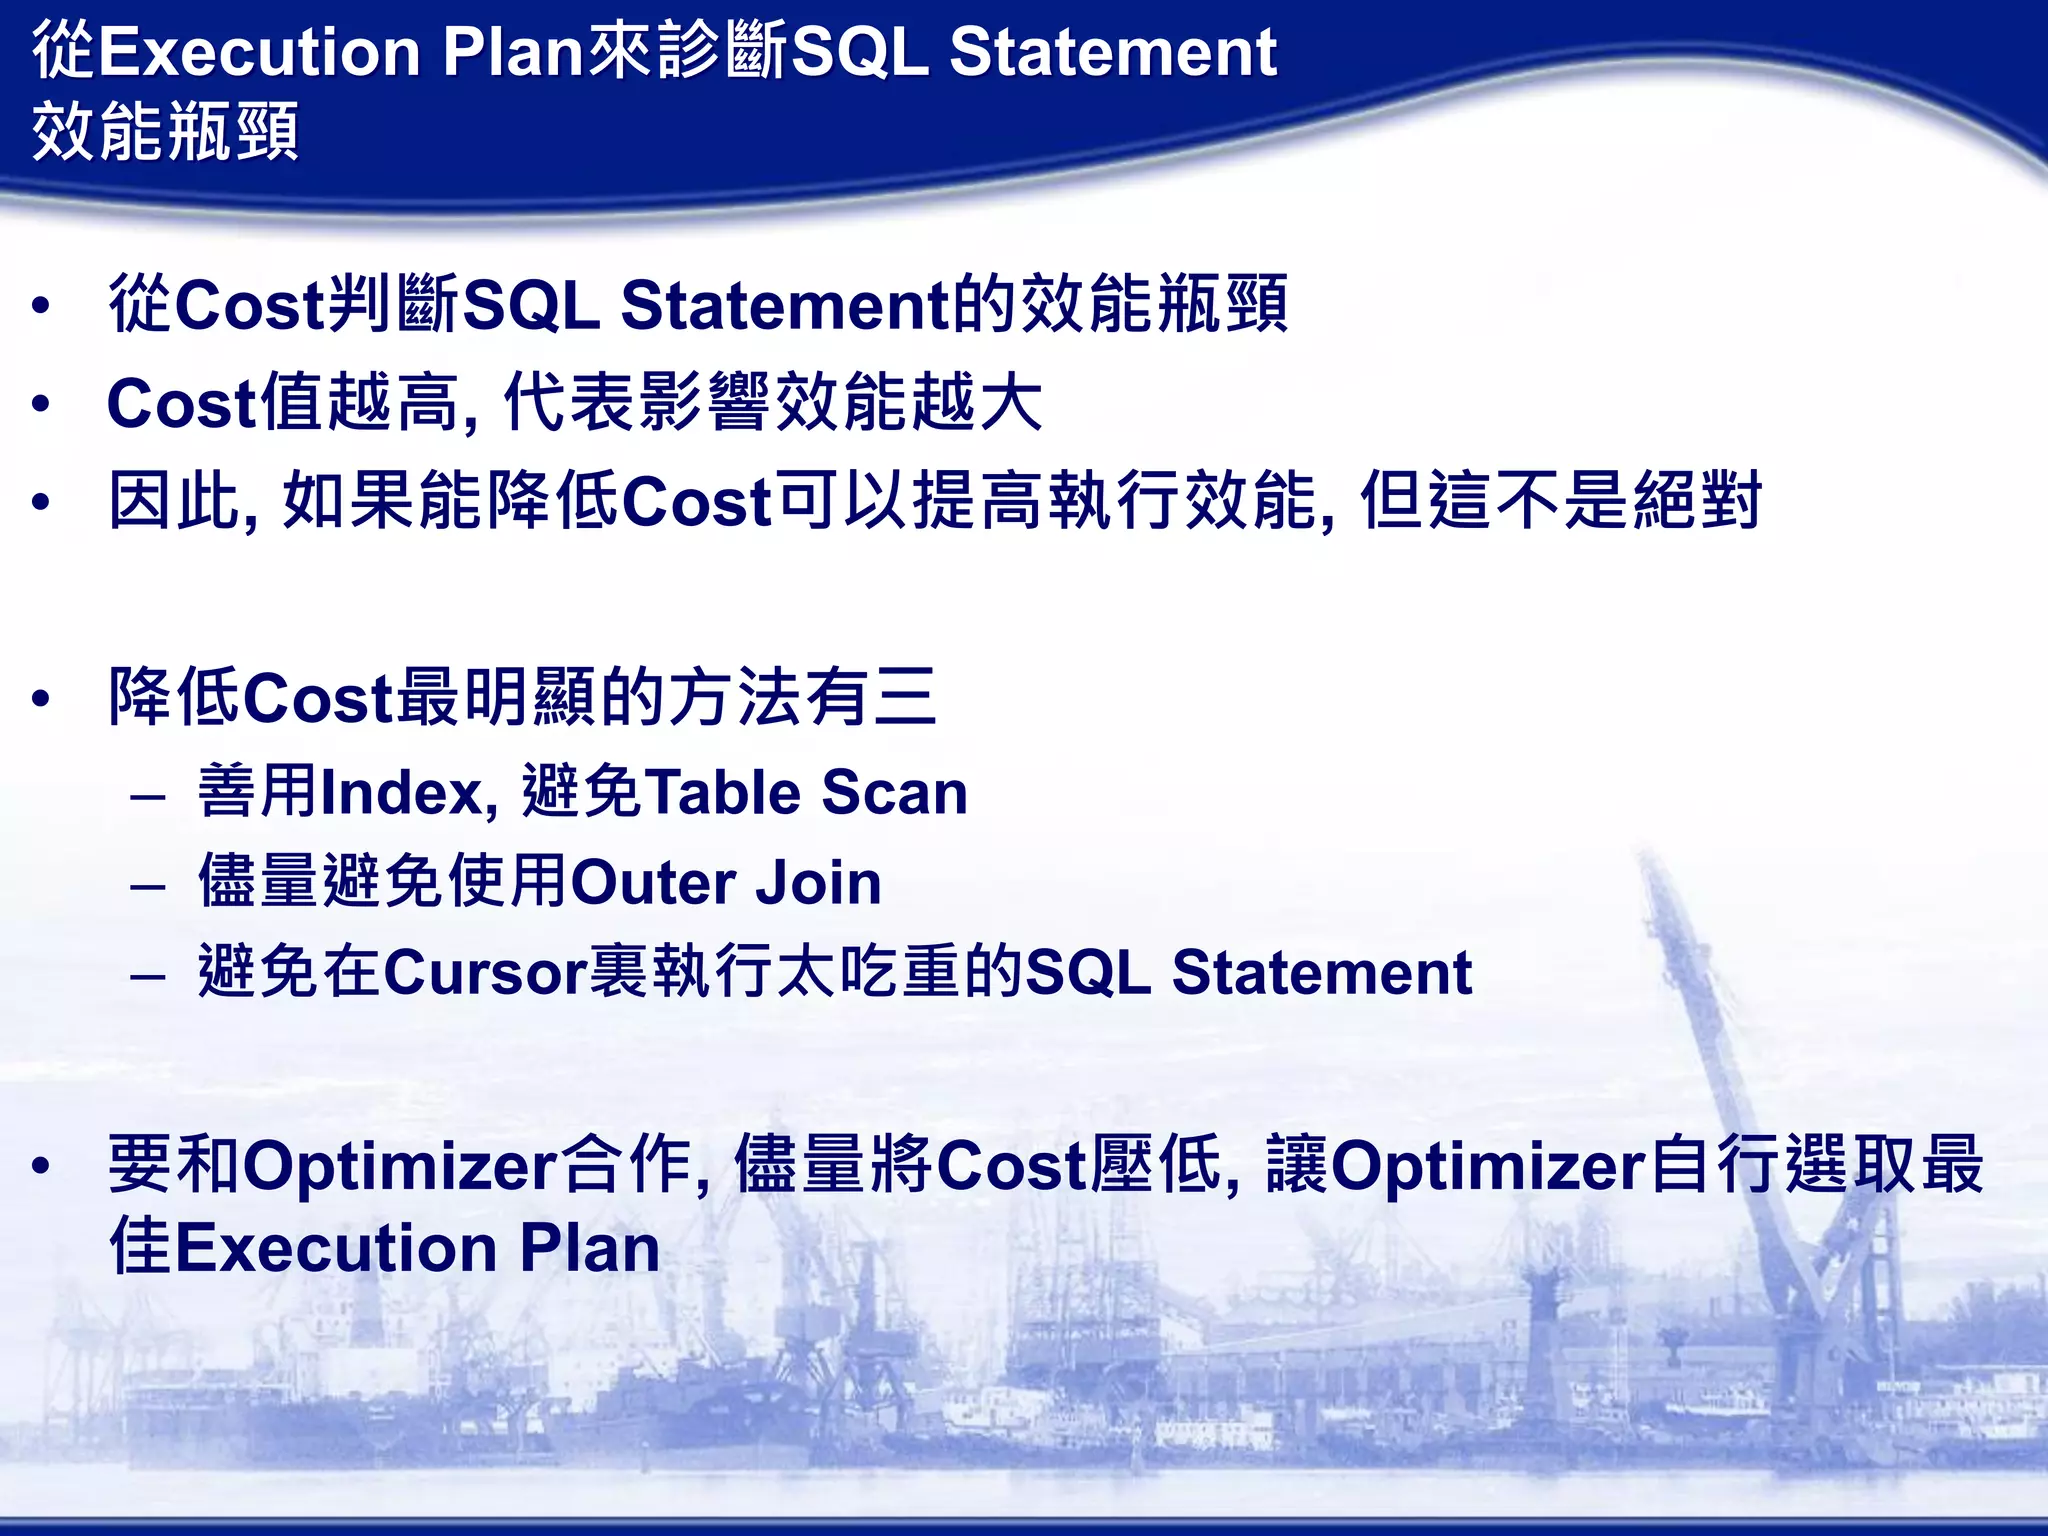
Cost-Based Optimizer
• 大多數RDBMS採用Cost-BasedOptimizer技術
• Cost有兩種: I/O Cost, CPU Cost
• ‘Cost’ is a weighted average of the costs derived from the
cost-based decision tree generated when the SQL
statement is bring processed.
• It is essentially an estimate of the run-time for a given
operation.
• ‘Cost’較低, 代表需要的硬體成本較低, 效能通常較好.
• 以前的伺服器硬體成本高昂, 在進行效能調校時, 常以 ‘Cost’較
低的Execution Plan為考量.
• 但現在的RDBMS系統, ‘Cost’不再是效能調校的基本參照, 因為
伺服器的效能還有很多空間可用時, 最佳Execution Plan不一定
是 ‘Cost’最低者.