Splunk | Charting Rules
•Download as XLS, PDF•
1 like•299 views

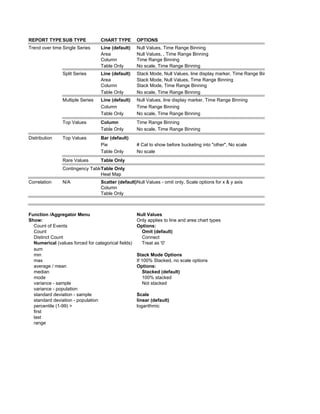
The document describes different report, chart, and options types for trend analysis. It lists report types like single series, split series, and multiple series analysis that can be displayed as line, area, column, or table charts. It also describes distribution reports that can be shown as bar, pie, or table charts. Additional options include handling null values, time range binning, stacking modes, and scaling.

More Related Content
More from Beth Goldman
More from Beth Goldman (20)
Splunk | Charting Rules
- 1. REPORT TYPE SUB TYPE CHART TYPE OPTIONS Trend over time Single Series Line (default) Null Values, Time Range Binning Area Null Values, , Time Range Binning Column Time Range Binning Table Only No scale, Time Range Binning Split Series Line (default) Stack Mode, Null Values, line display marker, Time Range Binning Area Stack Mode, Null Values, Time Range Binning Column Stack Mode, Time Range Binning Table Only No scale, Time Range Binning Multiple Series Line (default) Null Values, line display marker, Time Range Binning Column Time Range Binning Table Only No scale, Time Range Binning Top Values Column Time Range Binning (default) Table Only No scale, Time Range Binning Distribution Top Values Bar (default) Pie # Cat to show before bucketing into "other", No scale Table Only No scale Rare Values Table Only Contingency TableTable Only Heat Map Correlation N/A Scatter (default)Null Values - omit only, Scale options for x & y axis Column Table Only Function /Aggregator Menu Null Values Show: Only applies to line and area chart types Count of Events Options: Count Omit (default) Distinct Count Connect Numerical (values forced for categorical fields) Treat as '0' sum min Stack Mode Options max If 100% Stacked, no scale options average / mean Options: median Stacked (default) mode 100% stacked variance - sample Not stacked variance - population standard deviation - sample Scale standard deviation - population linear (default) percentile (1-99) > logarithmic first last range