You Will Haz Crazy Code!
Super-Charged Debugging for the New Developer
why are we here?
● Developers spend a *lot* of time debugging
code.
● You're a developer interested in pushing
your debugging skills beyond simple
breakpoints.
● As the projects you work on grow in size and
complexity, you will likely want some
additional tools at the ready for when
breakpoints prove totally, completely and in
all other ways wholly inadequate.
who's the geek up front?
● Software/web developer at Bridgepoint
Education, rocking primarily with ASP.NET
MVC 4, SQL Server 2008, C#, Java,
Javascript, Unity.
● jon_bachelor@me.com
● www.jonbachelor.com
● @DigiPug
● speakerrate.com/digipug
● slideshare.net/digipug
● (this will all be at the end too!)
he's doing it wrong
totally doing it right... but might be drunk
the good news
There are enough debugging tools, tips, tricks
and techniques to make this into a semester-
length course, rather than a 1 hour talk.
the bad news
There are enough debugging tools, tips, tricks
and techniques to make this into a semester-
length course, rather than a 1 hour talk.
meet the tip of the iceberg
● Breakpoints
● Tracepoints
● Homemade debug
snippets
● Conditional
breakpoints
● Breakpoint filters
● Fiddler
● AOP with
PostSharp
● MOQ
● 'FileWatcher'
● Intellitrace
● LINQPad
● Snoop
● Debug converters
● sqlcmd
● VS exception
settings
● so... much... more...
the mighty breakpoint
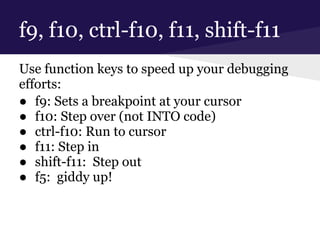
f9, f10, ctrl-f10, f11, shift-f11
Use function keys to speed up your debugging
efforts:
● f9: Sets a breakpoint at your cursor
● f10: Step over (not INTO code)
● ctrl-f10: Run to cursor
● f11: Step in
● shift-f11: Step out
● f5: giddy up!
hit it!
when hit... make me a tracepoint!
demo
super-charging your breakpoints:
tracepoints
hit count
conditional breakpoints
labeled breakpoints
tracepoints == cool;
● Allows you to get a ton of information about
your execution flow, arguments and/or
variables, etc, very quickly.
● Prevents trouble you may otherwise run into
with timing issues caused by using
breakpoints (like when debugging threading
problems).
murphy's tip
the "fun" issues always seem to happen in production...
where tracepoints are not an option.
NOW WHAT???
logging == super-cool;
● Tracepoints are really just a means to set up
really quick logging statements.
● Take the time to implement good logging... If
your logs don't capture a problem, they're
useless. If your logs capture so much
information that your app slows to a crawl,
they're worse than useless.
● Two popular tools to make logging easier:
○ PostSharp AOP
○ Log4Net
remote debugging
an extraordinarily powerful tool that so few take the
time to learn how to set up!
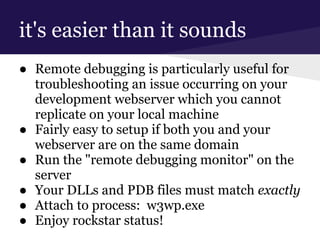
it's easier than it sounds
● Remote debugging is particularly useful for
troubleshooting an issue occurring on your
development webserver which you cannot
replicate on your local machine
● Fairly easy to setup if both you and your
webserver are on the same domain
● Run the "remote debugging monitor" on the
server
● Your DLLs and PDB files must match exactly
● Attach to process: w3wp.exe
● Enjoy rockstar status!
what about the data??
sometimes a crazy-funky problem you're facing is
being triggered by a bad state of your database
an ounce of prevention...
● At some point, your database will
presumably be in a known good state. Make
a backup at that time.
● Restore to that backup if things go wrong.
● Make backups of known bad states to
troubleshoot issues... Or play pranks on team
members.
ssms not installed... ruh-roh!
● sqlcmd to the rescue!
● Command line utility to run quick queries to
check on potential data issues.
● Also super useful for creating batch scripts to
run collections of SQL scripts.
databases can be complex!
● Use database diagrams in SSMS to get your
mind wrapped around a database, or even
just a portion of a database.
warning: small font ahead!
What follows is a list of resources to help you
dig into a bunch of the tools covered or
mentioned today...
I would suggest grabbing this deck from
slideshare.net/digipug, but do what ya gotta
do...
i'm hooked... i want more!
Visual Studio Debugging from MSDN (general info from Microsoft):
http://bit.ly/18LdVBk
PostSharp AOP (logging and TONS more):
http://www.postsharp.net/purchase
Snoop (WPF debug assistant):
http://snoopwpf.codeplex.com/
Fiddler (web debug assistant):
http://fiddler2.com/
WPF debug converter & more (techniques):
http://bit.ly/16deQqe
Favorite Documents Extension (keeping track of classes related to a particular issue or feature):
http://bit.ly/12VMRav
Agent Ransack (kick-butt search tool):
http://www.mythicsoft.com/agentransack
Remote Debugging (you'll be a star when you set this up!):
http://bit.ly/1ceBqlb
Using Labels in TFS:
http://bit.ly/17NkCOG
sqlcmd:
http://bit.ly/15ptd9U
thanks so much for coming!
● e: jon_bachelor@me.com
● t: @DigiPug
● w: www.jonbachelor.com
● speakerrate.com/digipug
● slideshare.net/digipug

Spaghetti gate

  • 1.
    You Will HazCrazy Code! Super-Charged Debugging for the New Developer
  • 2.
    why are wehere? ● Developers spend a *lot* of time debugging code. ● You're a developer interested in pushing your debugging skills beyond simple breakpoints. ● As the projects you work on grow in size and complexity, you will likely want some additional tools at the ready for when breakpoints prove totally, completely and in all other ways wholly inadequate.
  • 3.
    who's the geekup front? ● Software/web developer at Bridgepoint Education, rocking primarily with ASP.NET MVC 4, SQL Server 2008, C#, Java, Javascript, Unity. ● jon_bachelor@me.com ● www.jonbachelor.com ● @DigiPug ● speakerrate.com/digipug ● slideshare.net/digipug ● (this will all be at the end too!)
  • 4.
  • 5.
    totally doing itright... but might be drunk
  • 6.
    the good news Thereare enough debugging tools, tips, tricks and techniques to make this into a semester- length course, rather than a 1 hour talk.
  • 7.
    the bad news Thereare enough debugging tools, tips, tricks and techniques to make this into a semester- length course, rather than a 1 hour talk.
  • 8.
    meet the tipof the iceberg ● Breakpoints ● Tracepoints ● Homemade debug snippets ● Conditional breakpoints ● Breakpoint filters ● Fiddler ● AOP with PostSharp ● MOQ ● 'FileWatcher' ● Intellitrace ● LINQPad ● Snoop ● Debug converters ● sqlcmd ● VS exception settings ● so... much... more...
  • 9.
  • 10.
    f9, f10, ctrl-f10,f11, shift-f11 Use function keys to speed up your debugging efforts: ● f9: Sets a breakpoint at your cursor ● f10: Step over (not INTO code) ● ctrl-f10: Run to cursor ● f11: Step in ● shift-f11: Step out ● f5: giddy up!
  • 11.
  • 12.
    when hit... makeme a tracepoint!
  • 13.
    demo super-charging your breakpoints: tracepoints hitcount conditional breakpoints labeled breakpoints
  • 14.
    tracepoints == cool; ●Allows you to get a ton of information about your execution flow, arguments and/or variables, etc, very quickly. ● Prevents trouble you may otherwise run into with timing issues caused by using breakpoints (like when debugging threading problems).
  • 15.
    murphy's tip the "fun"issues always seem to happen in production... where tracepoints are not an option. NOW WHAT???
  • 16.
    logging == super-cool; ●Tracepoints are really just a means to set up really quick logging statements. ● Take the time to implement good logging... If your logs don't capture a problem, they're useless. If your logs capture so much information that your app slows to a crawl, they're worse than useless. ● Two popular tools to make logging easier: ○ PostSharp AOP ○ Log4Net
  • 17.
    remote debugging an extraordinarilypowerful tool that so few take the time to learn how to set up!
  • 18.
    it's easier thanit sounds ● Remote debugging is particularly useful for troubleshooting an issue occurring on your development webserver which you cannot replicate on your local machine ● Fairly easy to setup if both you and your webserver are on the same domain ● Run the "remote debugging monitor" on the server ● Your DLLs and PDB files must match exactly ● Attach to process: w3wp.exe ● Enjoy rockstar status!
  • 19.
    what about thedata?? sometimes a crazy-funky problem you're facing is being triggered by a bad state of your database
  • 20.
    an ounce ofprevention... ● At some point, your database will presumably be in a known good state. Make a backup at that time. ● Restore to that backup if things go wrong. ● Make backups of known bad states to troubleshoot issues... Or play pranks on team members.
  • 21.
    ssms not installed...ruh-roh! ● sqlcmd to the rescue! ● Command line utility to run quick queries to check on potential data issues. ● Also super useful for creating batch scripts to run collections of SQL scripts.
  • 22.
    databases can becomplex! ● Use database diagrams in SSMS to get your mind wrapped around a database, or even just a portion of a database.
  • 23.
    warning: small fontahead! What follows is a list of resources to help you dig into a bunch of the tools covered or mentioned today... I would suggest grabbing this deck from slideshare.net/digipug, but do what ya gotta do...
  • 24.
    i'm hooked... iwant more! Visual Studio Debugging from MSDN (general info from Microsoft): http://bit.ly/18LdVBk PostSharp AOP (logging and TONS more): http://www.postsharp.net/purchase Snoop (WPF debug assistant): http://snoopwpf.codeplex.com/ Fiddler (web debug assistant): http://fiddler2.com/ WPF debug converter & more (techniques): http://bit.ly/16deQqe Favorite Documents Extension (keeping track of classes related to a particular issue or feature): http://bit.ly/12VMRav Agent Ransack (kick-butt search tool): http://www.mythicsoft.com/agentransack Remote Debugging (you'll be a star when you set this up!): http://bit.ly/1ceBqlb Using Labels in TFS: http://bit.ly/17NkCOG sqlcmd: http://bit.ly/15ptd9U
  • 25.
    thanks so muchfor coming! ● e: jon_bachelor@me.com ● t: @DigiPug ● w: www.jonbachelor.com ● speakerrate.com/digipug ● slideshare.net/digipug