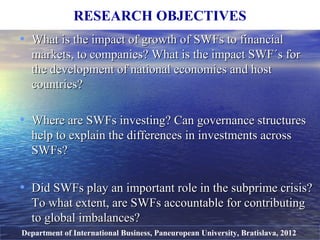
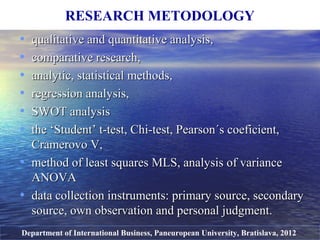
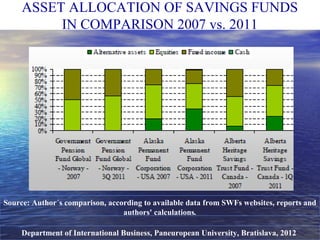
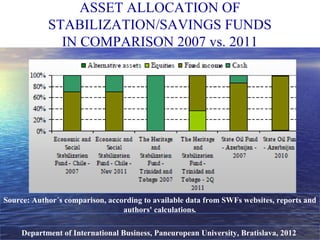
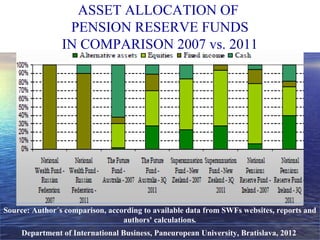
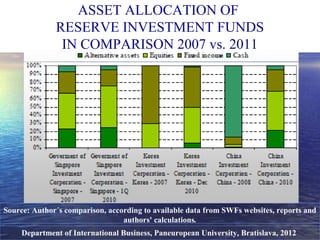
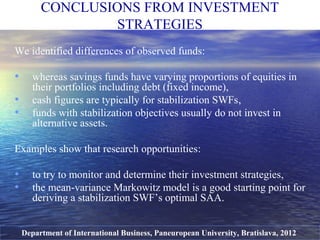
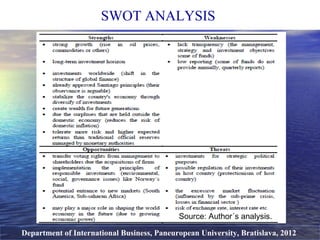
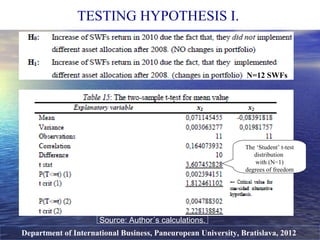
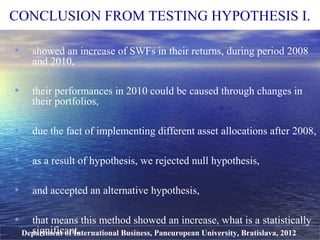
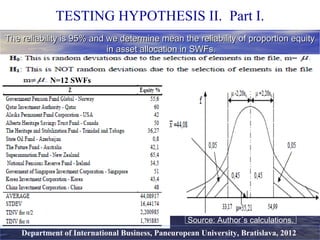
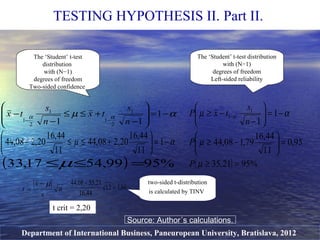
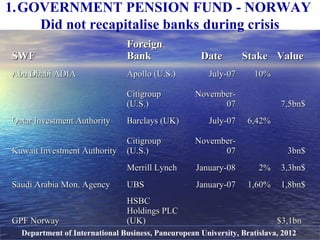
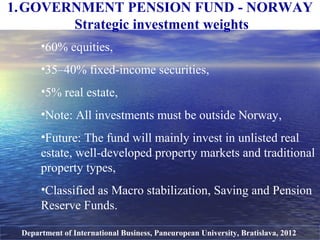
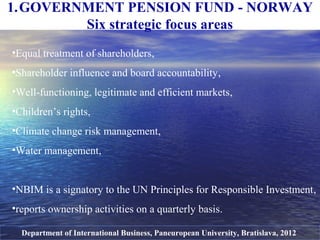
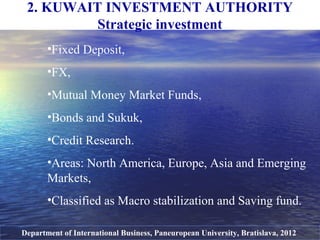
Sovereign Wealth FundsSovereign Wealth Funds
andand
their impact on international financetheir impact on international finance
ByBy
Antonia FICOVAAntonia FICOVA
Supervisor: Assoc. Prof. Juraj SipkoSupervisor: Assoc. Prof. Juraj Sipko
May 23, 2012May 23, 2012
Paneuropean University,
Department of International Business,
Bratislava
• Research ObjectivesResearch Objectives,,
• Research MethodologyResearch Methodology,,
• Literature Review,Literature Review,
• Asset Allocations,Asset Allocations,
• Swot Analysis,Swot Analysis,
• Hypotheses,Hypotheses,
• Conclusions.Conclusions.
OUTLINE
Department of International Business, Paneuropean University, Bratislava, 2012
• What is the impact of growth ofWhat is the impact of growth of SWFs to financialSWFs to financial
markets, to companies? What is the impact SWF´s formarkets, to companies? What is the impact SWF´s for
the development of national economies and hostthe development of national economies and host
countries?countries?
• Where are SWFs investing? Can governance structuresWhere are SWFs investing? Can governance structures
help to explain the differenceshelp to explain the differences in investments acrossin investments across
SWFs?SWFs?
• Did SWFs play an important role in the subprime crisis?Did SWFs play an important role in the subprime crisis?
To what extent, areTo what extent, are SWFs accountable for contributingSWFs accountable for contributing
to global imbalances?to global imbalances?
RESEARCH OBJECTIVES
Department of International Business, Paneuropean University, Bratislava, 2012
• qualitative and quantitative analysis,qualitative and quantitative analysis,
• comparative research,comparative research,
• analytic, statisticalanalytic, statistical methods,methods,
• regression analysis,regression analysis,
• SWOT analysisSWOT analysis
• tthe ‘Student’ t-test, Chi-test, Pearson´s coeficient,he ‘Student’ t-test, Chi-test, Pearson´s coeficient,
Cramerovo V,Cramerovo V,
• method of least squaresmethod of least squares MLS, analysis of varianceMLS, analysis of variance
ANOVAANOVA
• data collection instruments: primary source, secondarydata collection instruments: primary source, secondary
source, own observation and personal judgment.source, own observation and personal judgment.
RESEARCH METODOLOGY
Department of International Business, Paneuropean University, Bratislava, 2012
• MonkMonk ((20092009)) describes SWF´s asdescribes SWF´s as::
„„they are government-owned and controlled (directly orthey are government-owned and controlled (directly or
indirectly), have no outside beneficiaries or liabilitiesindirectly), have no outside beneficiaries or liabilities
and that invest their assets, either in the short or longand that invest their assets, either in the short or long
term, according to the interests and objectives of theterm, according to the interests and objectives of the
sovereign sponsorsovereign sponsor““
LITERATURE REVIEW
Department of International Business, Paneuropean University, Bratislava, 2012
• Balin, B. J.Balin, B. J. (2008(2008)) presentspresents why countries establish SWFwhy countries establish SWF
´s´s::
„„...... is that, when the country’s natural resources areis that, when the country’s natural resources are
exhausted, therefore, future generations can continue toexhausted, therefore, future generations can continue to
live prosperously using the earnings of their forefathers.live prosperously using the earnings of their forefathers.....
when a country is faced with a competitiveness crisis, itwhen a country is faced with a competitiveness crisis, it
can call on itscan call on its swfswf assets to reinvest in new sectors of theassets to reinvest in new sectors of the
economy that can revive the country’s competitiveeconomy that can revive the country’s competitive
advantagesadvantages““
LITERATURE REVIEW
Department of International Business, Paneuropean University, Bratislava, 2012
ASSET ALLOCATION OF SAVINGS FUNDS
IN COMPARISON 2007 vs. 2011
Department of International Business, Paneuropean University, Bratislava, 2012
Source: Author´s comparison, according to available data from SWFs websites, reports and
authors' calculations.
Department of International Business, Paneuropean University, Bratislava, 2012
ASSET ALLOCATION OF
STABILIZATION/SAVINGS FUNDS
IN COMPARISON 2007 vs. 2011
Source: Author´s comparison, according to available data from SWFs websites, reports and
authors' calculations.
Department of International Business, Paneuropean University, Bratislava, 2012
ASSET ALLOCATION OF
PENSION RESERVE FUNDS
IN COMPARISON 2007 vs. 2011
Source: Author´s comparison, according to available data from SWFs websites, reports and
authors' calculations.
Department of International Business, Paneuropean University, Bratislava, 2012
ASSET ALLOCATION OF
RESERVE INVESTMENT FUNDS
IN COMPARISON 2007 vs. 2011
Source: Author´s comparison, according to available data from SWFs websites, reports and
authors' calculations.
We identified differences of observed funds:
• whereas savings funds have varying proportions of equities in
their portfolios including debt (fixed income),
• cash figures are typically for stabilization SWFs,
• funds with stabilization objectives usually do not invest in
alternative assets.
Examples show that research opportunities:
• to try to monitor and determine their investment strategies,
• the mean-variance Markowitz model is a good starting point for
deriving a stabilization SWF’s optimal SAA.
CONCLUSIONS FROM INVESTMENT
STRATEGIES
Department of International Business, Paneuropean University, Bratislava, 2012
SWOT ANALYSIS
Department of International Business, Paneuropean University, Bratislava, 2012
Source: Author´s analysis.
TESTING HYPOTHESIS I.
Department of International Business, Paneuropean University, Bratislava, 2012
Source: Author´s calculations.
N=12 SWFs
The ‘Student’ t-test
distribution
with (N−1)
degrees of freedom
• showed an increase of SWFs in their returns, during period 2008
and 2010,
• their performances in 2010 could be caused through changes in
their portfolios,
• due the fact of implementing different asset allocations after 2008,
• as a result of hypothesis, we rejected null hypothesis,
• and accepted an alternative hypothesis,
• that means this method showed an increase, what is a statistically
significant.
CONCLUSION FROM TESTING HYPOTHESIS I.
Department of International Business, Paneuropean University, Bratislava, 2012
TESTING HYPOTHESIS II. Part I.
The reliability is 95% and we determine mean the reliability of proportion equityThe reliability is 95% and we determine mean the reliability of proportion equity
in asset allocation in SWFs.in asset allocation in SWFs.
Source: Author´s calculations.
N=12 SWFs
Department of International Business, Paneuropean University, Bratislava, 2012
TESTING HYPOTHESIS II. Part II.
Source: Author´s calculations.
αµ αα −=







−
+≤≤
−
−
−−
1
11
1
2
1
1
2
1 n
s
tx
n
s
tx
αµ −=





+≤≤− 1
11
44,16
20,208,44
11
44,16
20,208,44
( ) %9599,5417,33 =≤≤µ
The ‘Student’ t-test
distribution
with (N−1)
degrees of freedom
Two-sided confidence
( ) %9521,35
95,0
11
44,16
79,108,44
1
1
1
1
=≥
=





−≥
−=





−
−≥ −
µ
µ
αµ α
P
P
n
s
txP
The ‘Student’ t-test distribution
with (N−1)
degrees of freedom
Left-sided reliability
n
s
x
t
µ−
= 86,112
44,16
21,3508,44
=
−
=
t crit
= 2,20
t crit = 2,20
two-sided t-distribution
is calculated by TINV
By using Methods Student's t-distribution and TINV showed:
• that proportion of equity in asset allocations in 12 observed SWFs
supposed to be between 33,17 to 54,99 percent of total portfolios
at 95 percent probability,
• by using next hypothesis we may say that deviation is caused by
random selection of funds in observed file Z,
• therefore we accepted null hypothesis; 44,08=35,21;
• what is not statistically significant.
Department of International Business, Paneuropean University, Bratislava, 2012
CONCLUSION FROM TESTING HYPOTHESIS II.
Department of International Business, Paneuropean University, Bratislava, 2012
TESTING HYPOTHESIS III.
Source: Author´s calculations.
N=12 SWFs
Chinv test
(χ2; degree
of freedom =
1)
Pearson´s
coeficient
Cramer´s
V
• between the funds and export earnings from commodities is
statistical dependence,
• Chi-test showed, χ2>χ2crit, 255,65>3,84; that is statistical
dependence between earnings from sources of the funds and total
export of countries is statistical dependence,
• by using Pearson´s coeficient we determined that dependency is
0,210x4=0,84 for our table;
• by using Cramer´s V is 0,215,
• figures confirmed weak intensity of dependence.
Department of International Business, Paneuropean University, Bratislava, 2012
CONCLUSION FROM TESTING HYPOTHESIS III.
We examine whether the size of observed funds is closely related to size of investmentWe examine whether the size of observed funds is closely related to size of investment
during crisis, rate of growth of the countries, or both variables together. N=7 SWFsduring crisis, rate of growth of the countries, or both variables together. N=7 SWFs
Department of International Business, Paneuropean University, Bratislava, 2012
Source: Author´s calculations.
TESTING HYPOTHESIS IV.
• by using method MLS 12,04 percent changes of fund value are
attributed changes of growth rate,
• by using ANOVA and regression statistics we found that 18,96
percent of changes in value of fund may be caused by changing in
growth rate and their investments during crisis,
• coeficient of investments $bn means 2,91 percent impact on value
of funds,
• and GDP growth (annual %) has negative percentage of
contributions for change value of fund.
Department of International Business, Paneuropean University, Bratislava, 2012
CONCLUSION FROM TESTING HYPOTHESIS IV.
We examine what is the dependence of the value of observed funds on inflation rateWe examine what is the dependence of the value of observed funds on inflation rate
(quantitatively variables(quantitatively variables)) and year of established, price of crude oil (qualitativelyand year of established, price of crude oil (qualitatively
variablesvariables)). N=19. N=19
Department of International Business, Paneuropean University, Bratislava, 2012
TESTING HYPOTHESIS V.
Source: Author´s calculations.
By using regression statistics and ANOVA showed that 45,35 percent
of changes on value of observed funds may be caused by 6 variables:
• by inflation,
• number of years since the establishment (from 1953 to 2011),
• price of crude oil (current105,90$; future 130$, 150$),
• and 54,65 percent of changes on size of funds may be caused by
other variables.
• By example, seventh fund with current value 56,7($bn) suppose to
have 104,31 ($bn) due to 45,35 percent impact of variables on
funds, 54,65 percent impact may be from other variables.
Department of International Business, Paneuropean University, Bratislava, 2012
CONCLUSION FROM TESTING HYPOTHESIS V.
Do you see any strategic difference betweenDo you see any strategic difference between
the Sovereign Wealth Fund of Norwaythe Sovereign Wealth Fund of Norway
andand
Gulf Oil Countries?Gulf Oil Countries?
QUESTION
Department of International Business, Paneuropean University, Bratislava, 2012
1.GOVERNMENT PENSION FUND - NORWAY
Did not recapitalise banks during crisis
Department of International Business, Paneuropean University, Bratislava, 2012
SWFSWF
ForeignForeign
BankBank DateDate StakeStake ValueValue
Abu Dhabi ADIAAbu Dhabi ADIA Apollo (U.S.)Apollo (U.S.) July-07July-07 10%10%
CitigroupCitigroup
(U.S.)(U.S.)
November-November-
0707 7,5bn$7,5bn$
Qatar Investment AuthorityQatar Investment Authority Barclays (UK)Barclays (UK) July-07July-07 6,42%6,42%
Kuwait Investment AuthorityKuwait Investment Authority
CitigroupCitigroup
(U.S.)(U.S.)
November-November-
0707 3bn$3bn$
Merrill LynchMerrill Lynch January-08January-08 2%2% 3,3bn$3,3bn$
Saudi Arabia Mon. AgencySaudi Arabia Mon. Agency UBSUBS January-07January-07 1,60%1,60% 1,8bn$1,8bn$
GPF NorwayGPF Norway
HSBCHSBC
Holdings PLCHoldings PLC
(UK)(UK) $3,1bn$3,1bn
1.GOVERNMENT PENSION FUND - NORWAY
Strategic investment weights
Department of International Business, Paneuropean University, Bratislava, 2012
•60% equities,
•35–40% fixed-income securities,
•5% real estate,
•Note: All investments must be outside Norway,
•Future: The fund will mainly invest in unlisted real
estate, well-developed property markets and traditional
property types,
•Classified as Macro stabilization, Saving and Pension
Reserve Funds.
1.GOVERNMENT PENSION FUND - NORWAY
Six strategic focus areas
Department of International Business, Paneuropean University, Bratislava, 2012
•Equal treatment of shareholders,
•Shareholder influence and board accountability,
•Well-functioning, legitimate and efficient markets,
•Children’s rights,
•Climate change risk management,
•Water management,
•NBIM is a signatory to the UN Principles for Responsible Investment,
•reports ownership activities on a quarterly basis.
2. KUWAIT INVESTMENT AUTHORITY
Strategic investment
Department of International Business, Paneuropean University, Bratislava, 2012
•Fixed Deposit,
•FX,
•Mutual Money Market Funds,
•Bonds and Sukuk,
•Credit Research.
•Areas: North America, Europe, Asia and Emerging
Markets,
•Classified as Macro stabilization and Saving fund.
2. KUWAIT INVESTMENT AUTHORITY
Prohibits informations I.
Department of International Business, Paneuropean University, Bratislava, 2012
Law No. 47 of 1982 regarding the establishment of KIA has select
clauses:
i. Clause 5 requires KIA to present a detailed report to the Council
of Ministers on the Assets Under Management.
ii. Clause 8 prohibits generally the disclosure to the public of any
information related to KIA's work.
iii. Clause 9 states the penalties for unauthorized disclosure of
information to the public.
2. KUWAIT INVESTMENT AUTHORITY
Prohibits informations II.
Department of International Business, Paneuropean University, Bratislava, 2012
• makes annual closed door presentations on the full
details of all funds under its management,
•including its Strategic Asset Allocation,
• benchmarks and rates of return to the council of
ministers as well as to the national assembly.
3. DIFFERENCES OF INVESTMENTS BY
GEOGRAPHIES
Department of International Business, Paneuropean University, Bratislava, 2012
SWFSWF PercentagePercentage GeographiesGeographies
NorwayNorway 53,30%53,30% EuropeEurope
ADIAADIA 35-50%35-50% USAUSA
KIA /Kuwait/KIA /Kuwait/ 76-86%76-86% USA, EuropeUSA, Europe
QIA /Qatar/QIA /Qatar/ N/AN/A N/AN/A
LIA /Libya/LIA /Libya/ 70,70%70,70% EuropeEurope
Brunei /BIA/Brunei /BIA/ N/AN/A N/AN/A
MubadalaMubadala 33%33% UAEUAE
BahrainBahrain N/AN/A N/AN/A
Source: Author´s, according to data from fund´s websites
4. DIFFERENCES OF LINABURG – MADUELL
TRANSPARENCY INDEX
Department of International Business, Paneuropean University, Bratislava, 2012
5
10
1
Source: Author´s, according to data from SWF Institute, 1Q 2012
Antonia FICOVA
antonia.ficova@yahoo.com
May 23, 2012
Thank you for attention!
Sovereign Wealth Funds
and
their impact on international finance
Department of International Business, Paneuropean University, Bratislava,
SLOVAKIA, 2012

SWF_Diploma_thesis_2012

  • 1.
    Sovereign Wealth FundsSovereignWealth Funds andand their impact on international financetheir impact on international finance ByBy Antonia FICOVAAntonia FICOVA Supervisor: Assoc. Prof. Juraj SipkoSupervisor: Assoc. Prof. Juraj Sipko May 23, 2012May 23, 2012 Paneuropean University, Department of International Business, Bratislava
  • 2.
    • Research ObjectivesResearchObjectives,, • Research MethodologyResearch Methodology,, • Literature Review,Literature Review, • Asset Allocations,Asset Allocations, • Swot Analysis,Swot Analysis, • Hypotheses,Hypotheses, • Conclusions.Conclusions. OUTLINE Department of International Business, Paneuropean University, Bratislava, 2012
  • 3.
    • What isthe impact of growth ofWhat is the impact of growth of SWFs to financialSWFs to financial markets, to companies? What is the impact SWF´s formarkets, to companies? What is the impact SWF´s for the development of national economies and hostthe development of national economies and host countries?countries? • Where are SWFs investing? Can governance structuresWhere are SWFs investing? Can governance structures help to explain the differenceshelp to explain the differences in investments acrossin investments across SWFs?SWFs? • Did SWFs play an important role in the subprime crisis?Did SWFs play an important role in the subprime crisis? To what extent, areTo what extent, are SWFs accountable for contributingSWFs accountable for contributing to global imbalances?to global imbalances? RESEARCH OBJECTIVES Department of International Business, Paneuropean University, Bratislava, 2012
  • 4.
    • qualitative andquantitative analysis,qualitative and quantitative analysis, • comparative research,comparative research, • analytic, statisticalanalytic, statistical methods,methods, • regression analysis,regression analysis, • SWOT analysisSWOT analysis • tthe ‘Student’ t-test, Chi-test, Pearson´s coeficient,he ‘Student’ t-test, Chi-test, Pearson´s coeficient, Cramerovo V,Cramerovo V, • method of least squaresmethod of least squares MLS, analysis of varianceMLS, analysis of variance ANOVAANOVA • data collection instruments: primary source, secondarydata collection instruments: primary source, secondary source, own observation and personal judgment.source, own observation and personal judgment. RESEARCH METODOLOGY Department of International Business, Paneuropean University, Bratislava, 2012
  • 5.
    • MonkMonk ((20092009))describes SWF´s asdescribes SWF´s as:: „„they are government-owned and controlled (directly orthey are government-owned and controlled (directly or indirectly), have no outside beneficiaries or liabilitiesindirectly), have no outside beneficiaries or liabilities and that invest their assets, either in the short or longand that invest their assets, either in the short or long term, according to the interests and objectives of theterm, according to the interests and objectives of the sovereign sponsorsovereign sponsor““ LITERATURE REVIEW Department of International Business, Paneuropean University, Bratislava, 2012
  • 6.
    • Balin, B.J.Balin, B. J. (2008(2008)) presentspresents why countries establish SWFwhy countries establish SWF ´s´s:: „„...... is that, when the country’s natural resources areis that, when the country’s natural resources are exhausted, therefore, future generations can continue toexhausted, therefore, future generations can continue to live prosperously using the earnings of their forefathers.live prosperously using the earnings of their forefathers..... when a country is faced with a competitiveness crisis, itwhen a country is faced with a competitiveness crisis, it can call on itscan call on its swfswf assets to reinvest in new sectors of theassets to reinvest in new sectors of the economy that can revive the country’s competitiveeconomy that can revive the country’s competitive advantagesadvantages““ LITERATURE REVIEW Department of International Business, Paneuropean University, Bratislava, 2012
  • 7.
    ASSET ALLOCATION OFSAVINGS FUNDS IN COMPARISON 2007 vs. 2011 Department of International Business, Paneuropean University, Bratislava, 2012 Source: Author´s comparison, according to available data from SWFs websites, reports and authors' calculations.
  • 8.
    Department of InternationalBusiness, Paneuropean University, Bratislava, 2012 ASSET ALLOCATION OF STABILIZATION/SAVINGS FUNDS IN COMPARISON 2007 vs. 2011 Source: Author´s comparison, according to available data from SWFs websites, reports and authors' calculations.
  • 9.
    Department of InternationalBusiness, Paneuropean University, Bratislava, 2012 ASSET ALLOCATION OF PENSION RESERVE FUNDS IN COMPARISON 2007 vs. 2011 Source: Author´s comparison, according to available data from SWFs websites, reports and authors' calculations.
  • 10.
    Department of InternationalBusiness, Paneuropean University, Bratislava, 2012 ASSET ALLOCATION OF RESERVE INVESTMENT FUNDS IN COMPARISON 2007 vs. 2011 Source: Author´s comparison, according to available data from SWFs websites, reports and authors' calculations.
  • 11.
    We identified differencesof observed funds: • whereas savings funds have varying proportions of equities in their portfolios including debt (fixed income), • cash figures are typically for stabilization SWFs, • funds with stabilization objectives usually do not invest in alternative assets. Examples show that research opportunities: • to try to monitor and determine their investment strategies, • the mean-variance Markowitz model is a good starting point for deriving a stabilization SWF’s optimal SAA. CONCLUSIONS FROM INVESTMENT STRATEGIES Department of International Business, Paneuropean University, Bratislava, 2012
  • 12.
    SWOT ANALYSIS Department ofInternational Business, Paneuropean University, Bratislava, 2012 Source: Author´s analysis.
  • 13.
    TESTING HYPOTHESIS I. Departmentof International Business, Paneuropean University, Bratislava, 2012 Source: Author´s calculations. N=12 SWFs The ‘Student’ t-test distribution with (N−1) degrees of freedom
  • 14.
    • showed anincrease of SWFs in their returns, during period 2008 and 2010, • their performances in 2010 could be caused through changes in their portfolios, • due the fact of implementing different asset allocations after 2008, • as a result of hypothesis, we rejected null hypothesis, • and accepted an alternative hypothesis, • that means this method showed an increase, what is a statistically significant. CONCLUSION FROM TESTING HYPOTHESIS I. Department of International Business, Paneuropean University, Bratislava, 2012
  • 15.
    Department of InternationalBusiness, Paneuropean University, Bratislava, 2012 TESTING HYPOTHESIS II. Part I. The reliability is 95% and we determine mean the reliability of proportion equityThe reliability is 95% and we determine mean the reliability of proportion equity in asset allocation in SWFs.in asset allocation in SWFs. Source: Author´s calculations. N=12 SWFs
  • 16.
    Department of InternationalBusiness, Paneuropean University, Bratislava, 2012 TESTING HYPOTHESIS II. Part II. Source: Author´s calculations. αµ αα −=        − +≤≤ − − −− 1 11 1 2 1 1 2 1 n s tx n s tx αµ −=      +≤≤− 1 11 44,16 20,208,44 11 44,16 20,208,44 ( ) %9599,5417,33 =≤≤µ The ‘Student’ t-test distribution with (N−1) degrees of freedom Two-sided confidence ( ) %9521,35 95,0 11 44,16 79,108,44 1 1 1 1 =≥ =      −≥ −=      − −≥ − µ µ αµ α P P n s txP The ‘Student’ t-test distribution with (N−1) degrees of freedom Left-sided reliability n s x t µ− = 86,112 44,16 21,3508,44 = − = t crit = 2,20 t crit = 2,20 two-sided t-distribution is calculated by TINV
  • 17.
    By using MethodsStudent's t-distribution and TINV showed: • that proportion of equity in asset allocations in 12 observed SWFs supposed to be between 33,17 to 54,99 percent of total portfolios at 95 percent probability, • by using next hypothesis we may say that deviation is caused by random selection of funds in observed file Z, • therefore we accepted null hypothesis; 44,08=35,21; • what is not statistically significant. Department of International Business, Paneuropean University, Bratislava, 2012 CONCLUSION FROM TESTING HYPOTHESIS II.
  • 18.
    Department of InternationalBusiness, Paneuropean University, Bratislava, 2012 TESTING HYPOTHESIS III. Source: Author´s calculations. N=12 SWFs Chinv test (χ2; degree of freedom = 1) Pearson´s coeficient Cramer´s V
  • 19.
    • between thefunds and export earnings from commodities is statistical dependence, • Chi-test showed, χ2>χ2crit, 255,65>3,84; that is statistical dependence between earnings from sources of the funds and total export of countries is statistical dependence, • by using Pearson´s coeficient we determined that dependency is 0,210x4=0,84 for our table; • by using Cramer´s V is 0,215, • figures confirmed weak intensity of dependence. Department of International Business, Paneuropean University, Bratislava, 2012 CONCLUSION FROM TESTING HYPOTHESIS III.
  • 20.
    We examine whetherthe size of observed funds is closely related to size of investmentWe examine whether the size of observed funds is closely related to size of investment during crisis, rate of growth of the countries, or both variables together. N=7 SWFsduring crisis, rate of growth of the countries, or both variables together. N=7 SWFs Department of International Business, Paneuropean University, Bratislava, 2012 Source: Author´s calculations. TESTING HYPOTHESIS IV.
  • 21.
    • by usingmethod MLS 12,04 percent changes of fund value are attributed changes of growth rate, • by using ANOVA and regression statistics we found that 18,96 percent of changes in value of fund may be caused by changing in growth rate and their investments during crisis, • coeficient of investments $bn means 2,91 percent impact on value of funds, • and GDP growth (annual %) has negative percentage of contributions for change value of fund. Department of International Business, Paneuropean University, Bratislava, 2012 CONCLUSION FROM TESTING HYPOTHESIS IV.
  • 22.
    We examine whatis the dependence of the value of observed funds on inflation rateWe examine what is the dependence of the value of observed funds on inflation rate (quantitatively variables(quantitatively variables)) and year of established, price of crude oil (qualitativelyand year of established, price of crude oil (qualitatively variablesvariables)). N=19. N=19 Department of International Business, Paneuropean University, Bratislava, 2012 TESTING HYPOTHESIS V. Source: Author´s calculations.
  • 23.
    By using regressionstatistics and ANOVA showed that 45,35 percent of changes on value of observed funds may be caused by 6 variables: • by inflation, • number of years since the establishment (from 1953 to 2011), • price of crude oil (current105,90$; future 130$, 150$), • and 54,65 percent of changes on size of funds may be caused by other variables. • By example, seventh fund with current value 56,7($bn) suppose to have 104,31 ($bn) due to 45,35 percent impact of variables on funds, 54,65 percent impact may be from other variables. Department of International Business, Paneuropean University, Bratislava, 2012 CONCLUSION FROM TESTING HYPOTHESIS V.
  • 24.
    Do you seeany strategic difference betweenDo you see any strategic difference between the Sovereign Wealth Fund of Norwaythe Sovereign Wealth Fund of Norway andand Gulf Oil Countries?Gulf Oil Countries? QUESTION Department of International Business, Paneuropean University, Bratislava, 2012
  • 25.
    1.GOVERNMENT PENSION FUND- NORWAY Did not recapitalise banks during crisis Department of International Business, Paneuropean University, Bratislava, 2012 SWFSWF ForeignForeign BankBank DateDate StakeStake ValueValue Abu Dhabi ADIAAbu Dhabi ADIA Apollo (U.S.)Apollo (U.S.) July-07July-07 10%10% CitigroupCitigroup (U.S.)(U.S.) November-November- 0707 7,5bn$7,5bn$ Qatar Investment AuthorityQatar Investment Authority Barclays (UK)Barclays (UK) July-07July-07 6,42%6,42% Kuwait Investment AuthorityKuwait Investment Authority CitigroupCitigroup (U.S.)(U.S.) November-November- 0707 3bn$3bn$ Merrill LynchMerrill Lynch January-08January-08 2%2% 3,3bn$3,3bn$ Saudi Arabia Mon. AgencySaudi Arabia Mon. Agency UBSUBS January-07January-07 1,60%1,60% 1,8bn$1,8bn$ GPF NorwayGPF Norway HSBCHSBC Holdings PLCHoldings PLC (UK)(UK) $3,1bn$3,1bn
  • 26.
    1.GOVERNMENT PENSION FUND- NORWAY Strategic investment weights Department of International Business, Paneuropean University, Bratislava, 2012 •60% equities, •35–40% fixed-income securities, •5% real estate, •Note: All investments must be outside Norway, •Future: The fund will mainly invest in unlisted real estate, well-developed property markets and traditional property types, •Classified as Macro stabilization, Saving and Pension Reserve Funds.
  • 27.
    1.GOVERNMENT PENSION FUND- NORWAY Six strategic focus areas Department of International Business, Paneuropean University, Bratislava, 2012 •Equal treatment of shareholders, •Shareholder influence and board accountability, •Well-functioning, legitimate and efficient markets, •Children’s rights, •Climate change risk management, •Water management, •NBIM is a signatory to the UN Principles for Responsible Investment, •reports ownership activities on a quarterly basis.
  • 28.
    2. KUWAIT INVESTMENTAUTHORITY Strategic investment Department of International Business, Paneuropean University, Bratislava, 2012 •Fixed Deposit, •FX, •Mutual Money Market Funds, •Bonds and Sukuk, •Credit Research. •Areas: North America, Europe, Asia and Emerging Markets, •Classified as Macro stabilization and Saving fund.
  • 29.
    2. KUWAIT INVESTMENTAUTHORITY Prohibits informations I. Department of International Business, Paneuropean University, Bratislava, 2012 Law No. 47 of 1982 regarding the establishment of KIA has select clauses: i. Clause 5 requires KIA to present a detailed report to the Council of Ministers on the Assets Under Management. ii. Clause 8 prohibits generally the disclosure to the public of any information related to KIA's work. iii. Clause 9 states the penalties for unauthorized disclosure of information to the public.
  • 30.
    2. KUWAIT INVESTMENTAUTHORITY Prohibits informations II. Department of International Business, Paneuropean University, Bratislava, 2012 • makes annual closed door presentations on the full details of all funds under its management, •including its Strategic Asset Allocation, • benchmarks and rates of return to the council of ministers as well as to the national assembly.
  • 31.
    3. DIFFERENCES OFINVESTMENTS BY GEOGRAPHIES Department of International Business, Paneuropean University, Bratislava, 2012 SWFSWF PercentagePercentage GeographiesGeographies NorwayNorway 53,30%53,30% EuropeEurope ADIAADIA 35-50%35-50% USAUSA KIA /Kuwait/KIA /Kuwait/ 76-86%76-86% USA, EuropeUSA, Europe QIA /Qatar/QIA /Qatar/ N/AN/A N/AN/A LIA /Libya/LIA /Libya/ 70,70%70,70% EuropeEurope Brunei /BIA/Brunei /BIA/ N/AN/A N/AN/A MubadalaMubadala 33%33% UAEUAE BahrainBahrain N/AN/A N/AN/A Source: Author´s, according to data from fund´s websites
  • 32.
    4. DIFFERENCES OFLINABURG – MADUELL TRANSPARENCY INDEX Department of International Business, Paneuropean University, Bratislava, 2012 5 10 1 Source: Author´s, according to data from SWF Institute, 1Q 2012
  • 33.
    Antonia FICOVA antonia.ficova@yahoo.com May 23,2012 Thank you for attention! Sovereign Wealth Funds and their impact on international finance Department of International Business, Paneuropean University, Bratislava, SLOVAKIA, 2012