Download as PDF, PPTX
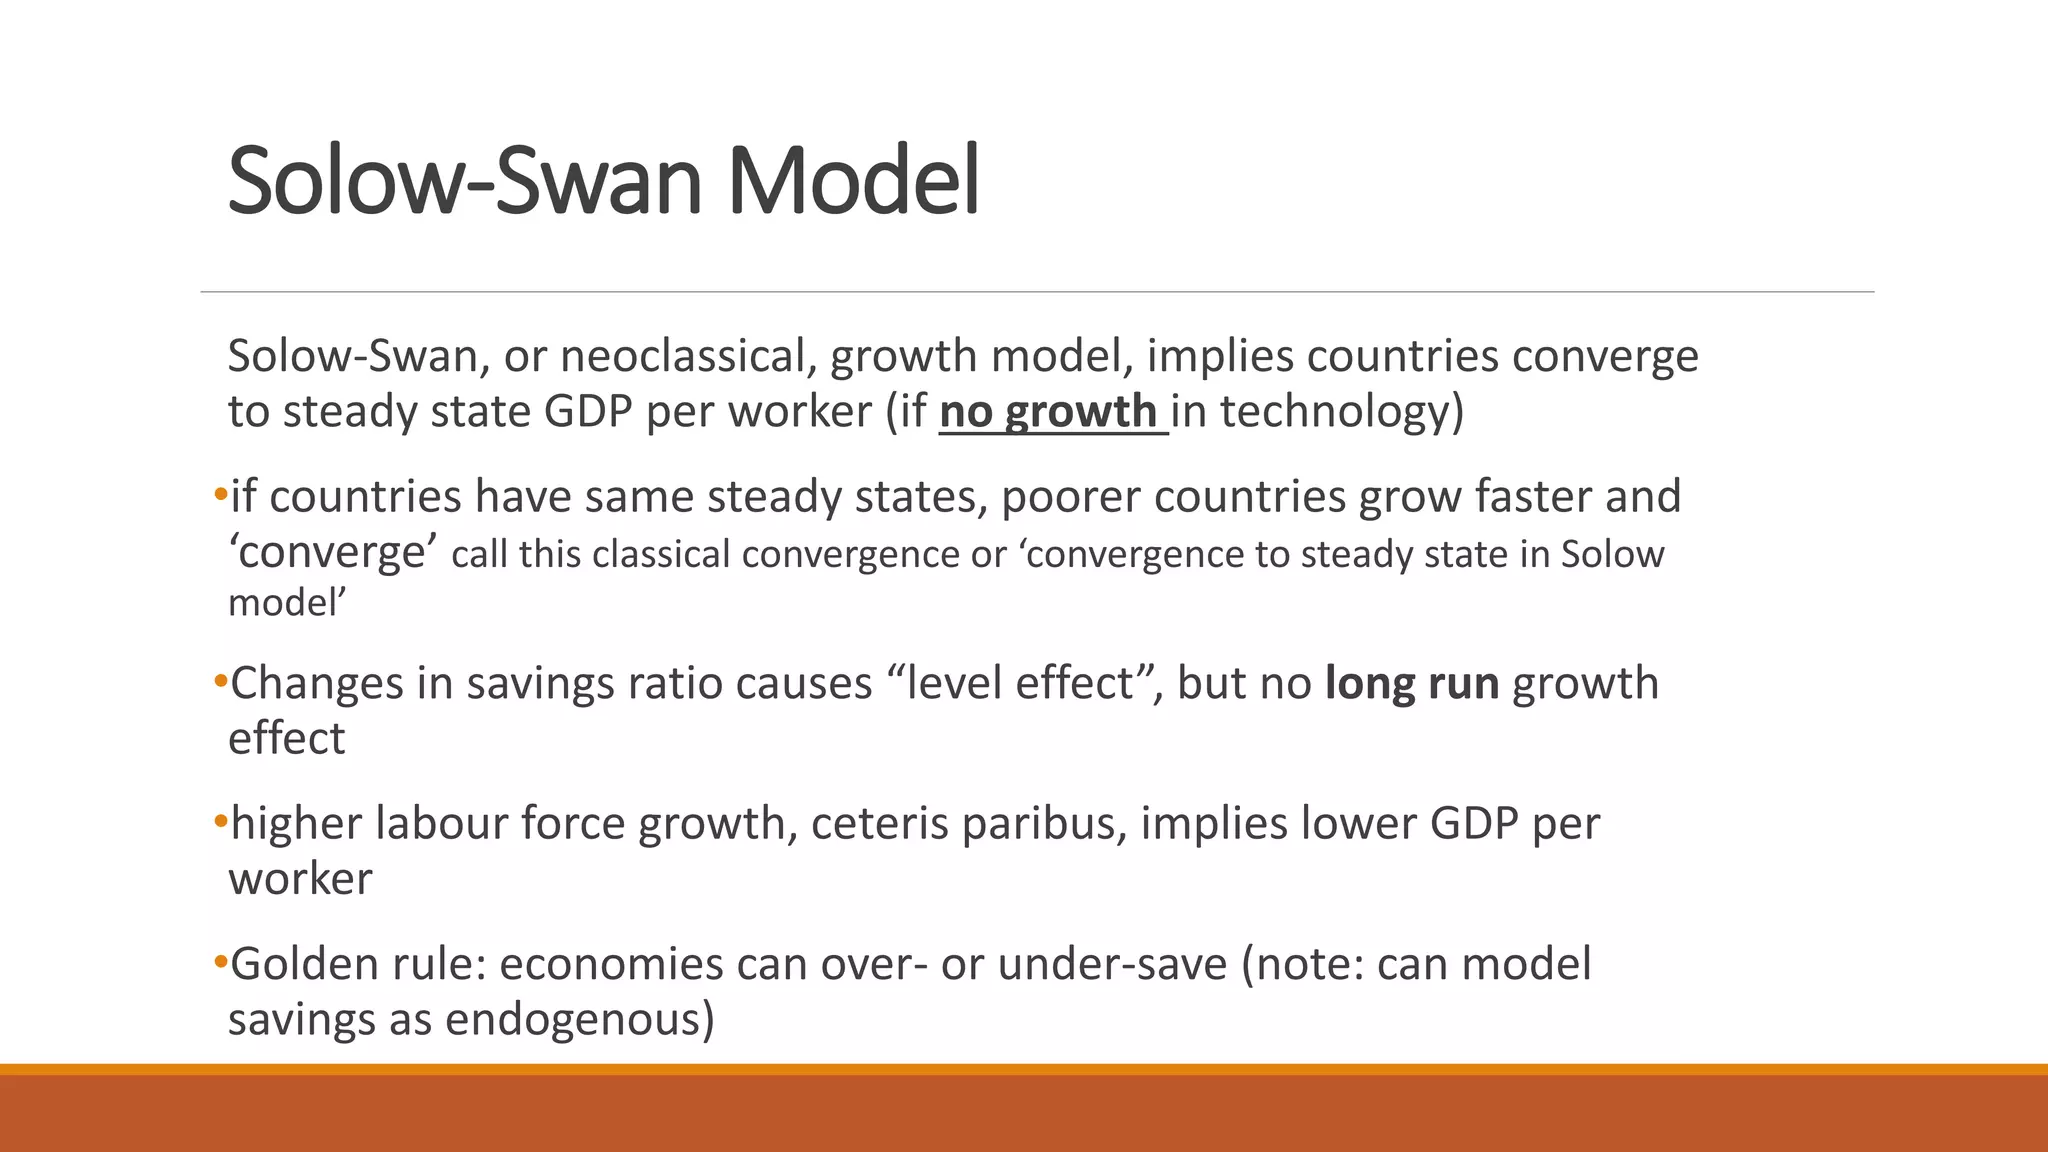


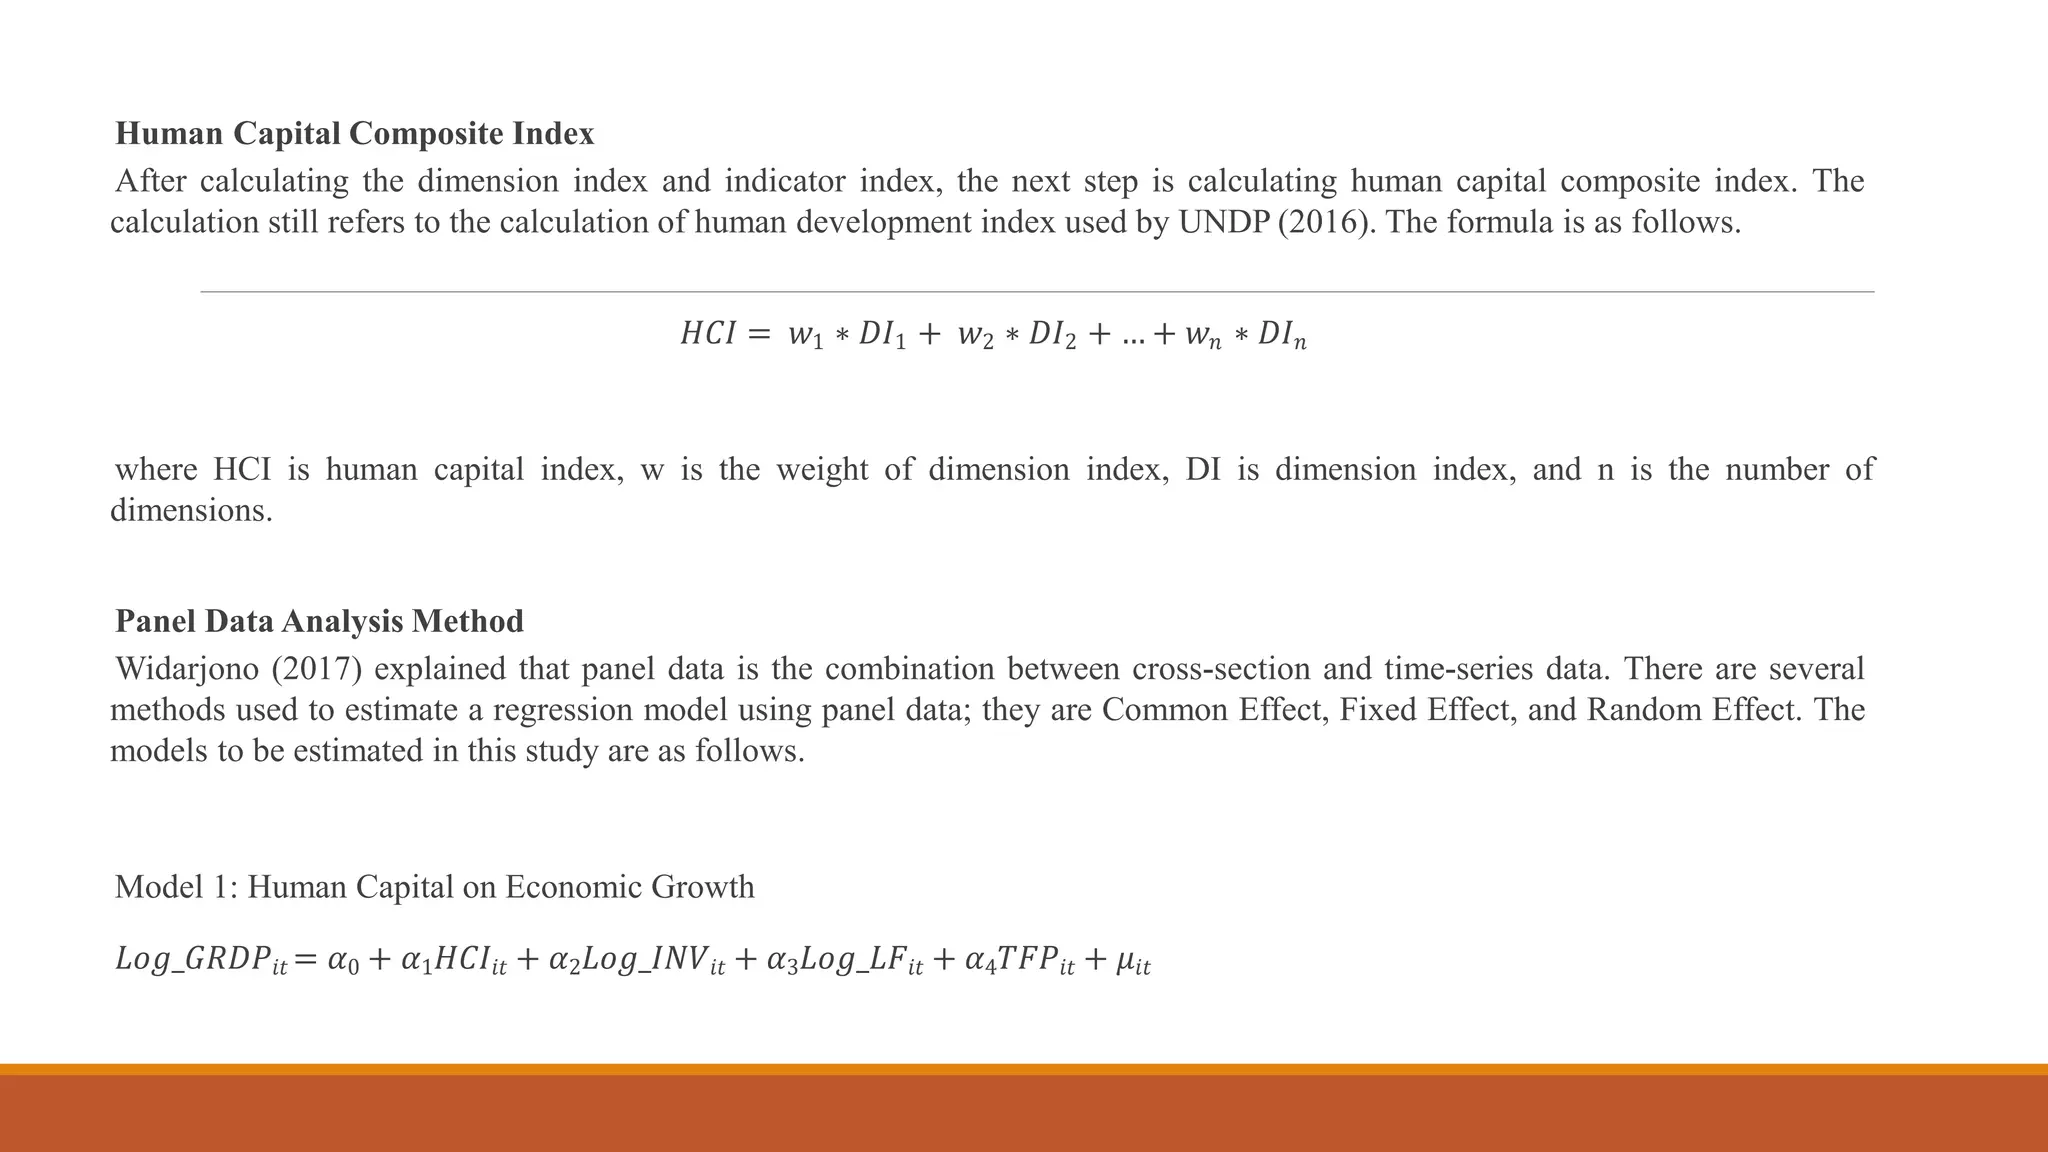


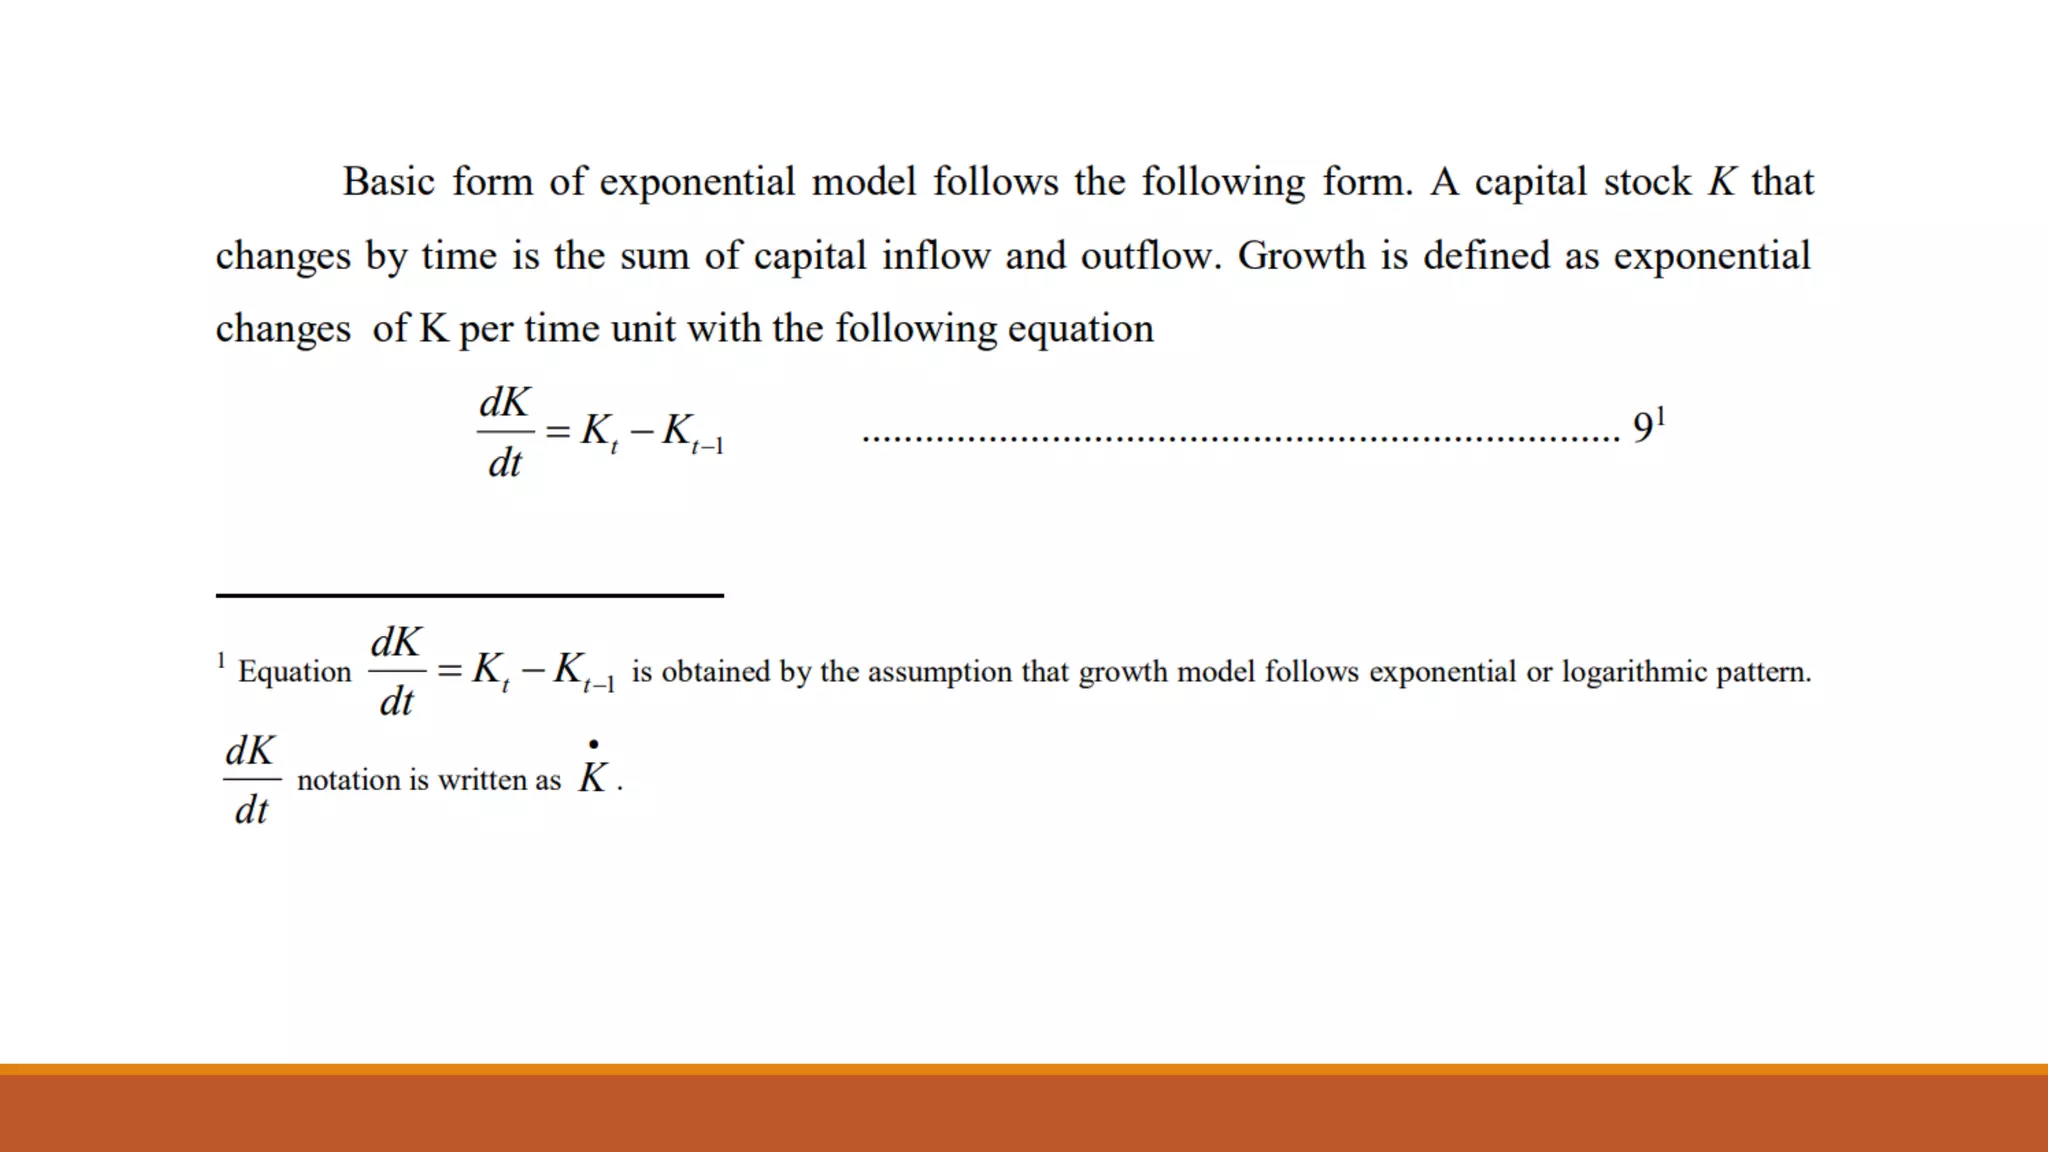


The document discusses the Solow-Swan model of economic growth and its application to Southeast Asian economies. It examines how factors like savings rates, population growth, and technology affect countries' ability to converge on a steady-state GDP. It then analyzes Indonesia's economic growth and development, noting its resilience during global downturns due to strong domestic demand. Statistical models are presented to study the relationship between human capital, economic growth, investment, labor force, and technology in Indonesia. Projections show Indonesia's GDP, consumption, investment and population are expected to significantly increase by 2035.


