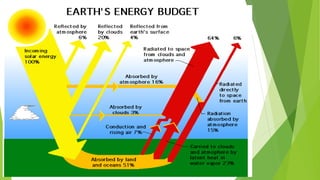
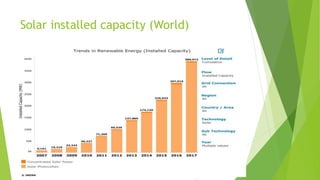
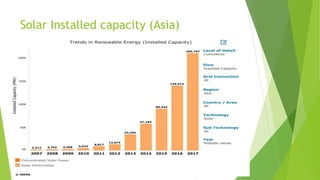
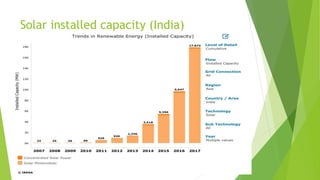
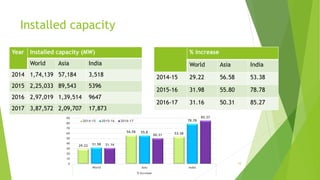
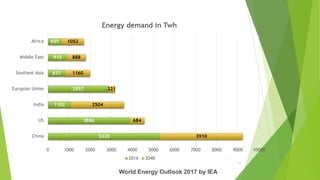
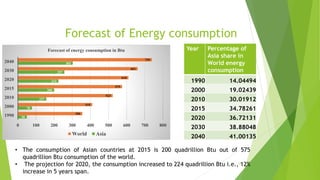
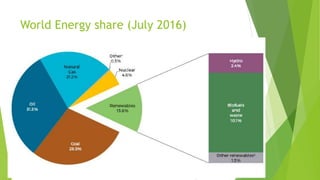
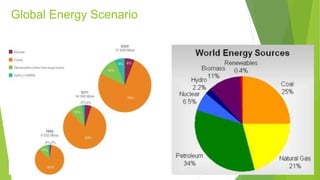
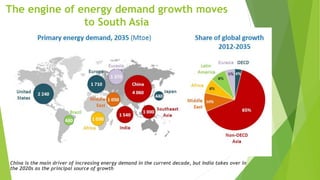
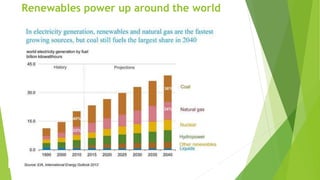
Introduction about solar energy
Dr. Challa Babu
ASCET, Gudur
Introduction about solar energy
 The sun radiating the light and heat energies to the earth atmosphere. The
average amount of energy available at the earth surface is 340 W/m2 .
 The radiated solar energy having the spectrum wavelength of 290 to
2500nm.
 This spectrum divided into 3 bands
1. Ultra-violet (UV) - 290nm to 380nm
2. visible light - 380nm to 780nm
3. Infra-Red (IR) light - 780nm to 2500nm
2
Solar spectrum
3
Solar spectrum for AM1.5G
Frequency and temperature of bands
4
Diameter: 1.39E9m(120 xgreater than earth)
Distancefrom earth =1.495E11 m(93 million miles)± 1.7%
Center:Density ≅100 xdensity of water andT>1E6KPoweredby
hydrogen fusion
Composedof layers. Theouter layer isthe photosphere
Effectiveblackbodytemperature of 5777 K
The SUN
Solar installed capacity (World)
7
Solar Installed capacity (Asia)
8
Solar installed capacity (India)
9
Installed capacity
Year Installed capacity (MW)
World Asia India
2014 1,74,139 57,184 3,518
2015 2,25,033 89,543 5396
2016 2,97,019 1,39,514 9647
2017 3,87,572 2,09,707 17,873
10
% increase
World Asia India
2014-15 29.22 56.58 53.38
2015-16 31.98 55.80 78.78
2016-17 31.16 50.31 85.27
29.22
56.58 53.38
31.98
55.8
78.78
31.16
50.31
85.27
0
10
20
30
40
50
60
70
80
90
World Asia India
% increase
2014-15 2015-16 2016-17
11
5320
3886
1102
2857
837
910
655
3910
684
2504
321
1160
888
1052
0 1000 2000 3000 4000 5000 6000 7000 8000 9000 10000
China
US
India
Europian Union
Southest Asia
Middle East
Africa
Energy demand in Twh
2016 2040
Forecast of Energy Demand
World Energy Outlook 2017 by IEA
Forecast of Energy consumption
12
50
78
157
200
224
257
303
356
410
523
575
610
661
739
0 100 200 300 400 500 600 700 800
1990
2000
2010
2015
2020
2030
2040
Forecast of energy consumption in Btu
World Asia
Year Percentage of
Asia share in
World energy
consumption
1990 14.04494
2000 19.02439
2010 30.01912
2015 34.78261
2020 36.72131
2030 38.88048
2040 41.00135
• The consumption of Asian countries at 2015 is 200 quadrillion Btu out of 575
quadrillion Btu consumption of the world.
• The projection for 2020, the consumption increased to 224 quadrillion Btu i.e., 12%
increase in 5 years span.
World Energy share (July 2016)
Global Energy Scenario
The engine of energy demand growth moves
to South Asia
China is the main driver of increasing energy demand in the current decade, but India takes over in
the 2020s as the principal source of growth
Renewables power up around the world
Why we are moving to solar?
 Abundant amount of solar energy availability
 Eco-friendly
 No Mechanical rotation
 Cost effective
 Easy to generate power, less time to erect
The statistics clearly conveys India emerging the solar power generation
in last five 5 years.

Solar Energy Introduction

  • 1.
    Introduction about solarenergy Dr. Challa Babu ASCET, Gudur
  • 2.
    Introduction about solarenergy  The sun radiating the light and heat energies to the earth atmosphere. The average amount of energy available at the earth surface is 340 W/m2 .  The radiated solar energy having the spectrum wavelength of 290 to 2500nm.  This spectrum divided into 3 bands 1. Ultra-violet (UV) - 290nm to 380nm 2. visible light - 380nm to 780nm 3. Infra-Red (IR) light - 780nm to 2500nm 2
  • 3.
  • 4.
  • 5.
    Diameter: 1.39E9m(120 xgreaterthan earth) Distancefrom earth =1.495E11 m(93 million miles)± 1.7% Center:Density ≅100 xdensity of water andT>1E6KPoweredby hydrogen fusion Composedof layers. Theouter layer isthe photosphere Effectiveblackbodytemperature of 5777 K The SUN
  • 7.
  • 8.
  • 9.
  • 10.
    Installed capacity Year Installedcapacity (MW) World Asia India 2014 1,74,139 57,184 3,518 2015 2,25,033 89,543 5396 2016 2,97,019 1,39,514 9647 2017 3,87,572 2,09,707 17,873 10 % increase World Asia India 2014-15 29.22 56.58 53.38 2015-16 31.98 55.80 78.78 2016-17 31.16 50.31 85.27 29.22 56.58 53.38 31.98 55.8 78.78 31.16 50.31 85.27 0 10 20 30 40 50 60 70 80 90 World Asia India % increase 2014-15 2015-16 2016-17
  • 11.
    11 5320 3886 1102 2857 837 910 655 3910 684 2504 321 1160 888 1052 0 1000 20003000 4000 5000 6000 7000 8000 9000 10000 China US India Europian Union Southest Asia Middle East Africa Energy demand in Twh 2016 2040 Forecast of Energy Demand World Energy Outlook 2017 by IEA
  • 12.
    Forecast of Energyconsumption 12 50 78 157 200 224 257 303 356 410 523 575 610 661 739 0 100 200 300 400 500 600 700 800 1990 2000 2010 2015 2020 2030 2040 Forecast of energy consumption in Btu World Asia Year Percentage of Asia share in World energy consumption 1990 14.04494 2000 19.02439 2010 30.01912 2015 34.78261 2020 36.72131 2030 38.88048 2040 41.00135 • The consumption of Asian countries at 2015 is 200 quadrillion Btu out of 575 quadrillion Btu consumption of the world. • The projection for 2020, the consumption increased to 224 quadrillion Btu i.e., 12% increase in 5 years span.
  • 13.
    World Energy share(July 2016)
  • 15.
  • 16.
    The engine ofenergy demand growth moves to South Asia China is the main driver of increasing energy demand in the current decade, but India takes over in the 2020s as the principal source of growth
  • 17.
    Renewables power uparound the world
  • 18.
    Why we aremoving to solar?  Abundant amount of solar energy availability  Eco-friendly  No Mechanical rotation  Cost effective  Easy to generate power, less time to erect The statistics clearly conveys India emerging the solar power generation in last five 5 years.

Editor's Notes

  • #13 This statics clearly conveys the future energy source is Solar in all Asian countries like India