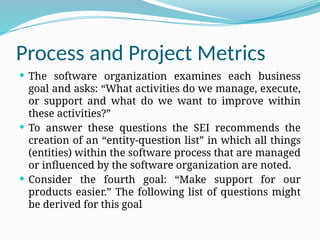
The document discusses software process and project metrics, which are quantitative tools to assess and improve software quality and productivity. It emphasizes the importance of measuring various attributes, deriving metrics for process improvement, and the role of management in utilizing these metrics effectively. Additionally, it categorizes metrics into different types, including size-oriented, function-oriented, and object-oriented, while highlighting the need for an organized approach to utilize these metrics responsibly.
![Process and Project Metrics
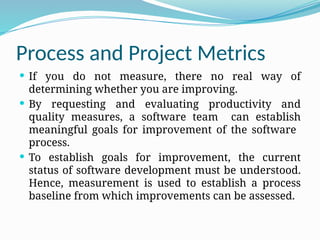
The reasons that we measure:
(1) To characterize in an effort to gain an understanding
“of processes, products, resources, and environments,
and to establish baselines for comparisons with future
assessments”;
(2) To evaluate “to determine status with respect to plans”;
(3) To predict by “gaining understandings of relationships
among processes and products and building models of
these relationships”;
(4) To improve by “identify[ing] roadblocks, root causes,
inefficiencies, and other opportunities for improving
product quality and process performance.”](https://image.slidesharecdn.com/spmunit2-241121152604-71308cf9/85/Software-Project-Management-Unit-2-chapters-4-320.jpg)
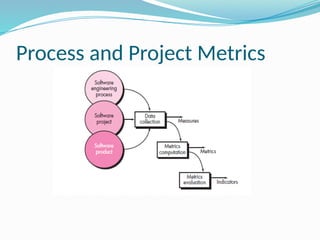
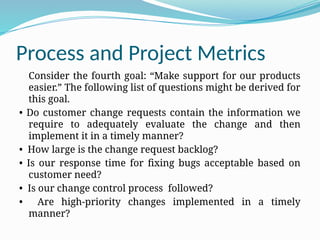
![Process and Project Metrics
Security is the probability (which can be estimated or
derived from empirical evidence) that the attack of a
specific type will be repelled.
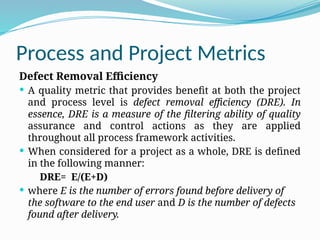
The integrity of a system can then be defined as:
Integrity = Ʃ [1 - (threat * (1 - security))]
For example, if threat (the probability that an attack
will occur) is 0.25 and security (the likelihood of
repelling an attack) is 0.95, the integrity of the system
is 0.99](https://image.slidesharecdn.com/spmunit2-241121152604-71308cf9/85/Software-Project-Management-Unit-2-chapters-49-320.jpg)