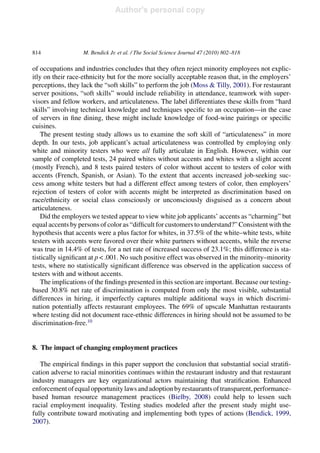
SlideShare a Scribd company logo
1 of 18
Download to read offline
This article appeared in a journal published by Elsevier. The attached
copy is furnished to the author for internal non-commercial research
and education use, including for instruction at the authors institution
and sharing with colleagues.
Other uses, including reproduction and distribution, or selling or
licensing copies, or posting to personal, institutional or third party
websites are prohibited.
In most cases authors are permitted to post their version of the
article (e.g. in Word or Tex form) to their personal website or
institutional repository. Authors requiring further information
regarding Elsevier’s archiving and manuscript policies are
encouraged to visit:
http://www.elsevier.com/copyright
Author's personal copy
The Social Science Journal 47 (2010) 802–818
Available online at www.sciencedirect.com
Employment discrimination in upscale restaurants:
Evidence from matched pair testing
Marc Bendick Jr.a,∗, Rekha Eanni Rodriguezb,1, Sarumathi Jayaramanc,d,2
a
Bendick and Egan Economic Consultants, Inc.,Washington, DC, USA
b
Restaurant Opportunities Center of New York, New York, NY, USA
c
Political Science Department, Brooklyn College, Brooklyn, NY, USA
d
Restaurant Opportunity Center-United, New York, NY, USA
Received 3 February 2009; received in revised form 11 March 2010; accepted 5 April 2010
Abstract
White and racial minorities with equal qualifications applied simultaneously for 43 waiter/waitress
jobs in New York City fine dining restaurants. Applicants of all demographic backgrounds were treated
with equal courtesy, but minorities were only 54% as likely as whites to receive a job offer. This
discrimination, either conscious or unconscious, was documented in 31% of restaurants tested. Post-
hiring differences appear even more widespread, with front of the house minority restaurant servers
averaging 12% lower earnings than their equally qualified white peers. Ensuring equal treatment in
hiring would expand minority access to good jobs in Manhattan fine dining by 3500 positions but not
make it universal.
© 2010 Western Social Science Association. Published by Elsevier Inc. All rights reserved.
Keywords: Employment; Discrimination; Race; Immigrants; Testing; Restaurant industry
∗
Corresponding author. Tel.: +1 202 686 0245; fax: +1 202 363 4429.
E-mail addresses: bendickegan@mindspring.com (M. Bendick Jr.), rekhaeanni@yahoo.com (R.E. Rodriguez),
saruj@brooklyn.cuny.edu, sarulove@yahoo.com (S. Jayaraman).
URLs: http://www.bendickegan.com (M. Bendick Jr.), http://www.rocny.org (R.E. Rodriguez),
http://www.brooklyn.cuny.edu (S. Jayaraman), http://www.rocunited.org (S. Jayaraman).
1
Tel.: +1 212 343 1771; fax: +1 212 343 7217.
2
Tel.: +1 718 951 5000x1754/212 243 6900; fax: +1 718 951 4833/212 243 6800.
0362-3319/$ – see front matter © 2010 Western Social Science Association. Published by Elsevier Inc. All rights reserved.
doi:10.1016/j.soscij.2010.04.001
Author's personal copy
M. Bendick Jr. et al. / The Social Science Journal 47 (2010) 802–818 803
1. Introduction
In the classic “Horatio Alger” model of American social mobility, persons outside the
employment mainstream take whatever low-paid, precarious jobs they can obtain with limited
qualifications and, while there, acquire skills, credentials and contacts enabling them to move to
stable, career positions providing a middle class standard of living (Alger, 2007; Gabriel, 2005;
Isaacs, Sawhill & Haskins, 2008; Iverson & Armstrong, 2006). For immigrants, that initial
employmentisoftenfoundintherestaurantindustry,which,with1.4millionimmigrantsamong
its 13 million employees nationwide, is the nation’s largest employer of workers born outside
the U.S. (NRA, 2006; NRA, 2009). Those immigrants’ fellow employees also include many
native-born individuals among the nation’s 7.7 million “working poor,” whose households
remain below the official U.S. poverty threshold despite being in the work force at least half
the year (U.S. Bureau of Labor Statistics, 2008).
When restaurant employees seek upward mobility within the industry itself, the experiences
of white workers and workers of color3
often differ sharply. While immigrants from France or
Ireland may soon “work their way up” to well-paid server, manager, or even owner positions
in fine dining restaurants, their counterparts from Haiti or Mexico may remain bussing tables
in those restaurants or serving customers in fast food outlets or small neighborhood establish-
ments. Career paths for native-born whites and native-born persons of color often similarly
diverge.
This paper measures the role of employer discrimination in those differences. We first
describe restaurant employment, the experiences of low-skill and immigrant workers in those
jobs, and the hypothesis of employment discrimination against persons of color. We then
empirically test that hypothesis using two methodologies: statistical analyses of Census data
and matched pair testing of restaurant hiring. Both analyses strongly confirm the hypothesis.
Our empirical findings are based on restaurants in the Manhattan borough of New York
City, where immigrants and persons of color constitute a particularly large proportion of the
local labor force and upscale restaurants are a particularly prominent part of the local econ-
omy. However, similar employment patterns are likely to prevail throughout the U.S.A. Using
other research techniques, similar patterns have been documented, for example, in San Diego
(Morales, 2005); Kingston, Ontario (Denstedt, 2008); Ohio (Slonaker, Wendt, & Baker, 2007);
and nation-wide restaurant chains (Feagin, Vera, & Batur, 2001, chapter 3).
2. Restaurant employment
In Manhattan, with 1.6 million residents and the majority of New York City’s 44 million visi-
tors annually, more than 7900 food service establishments employ more than 123,000 workers
(U.S. Census, 2006) in jobs which are growing at twice the rate of all employment (NRA,
2006). Reflecting this employment growth, high employee turnover, and limited employment
prerequisites, restaurants are a frequent first employer for many persons, both immigrants
and native-born, seeking initial entry into the American labor market. In fact, more than
one out of four American adults obtained their first work experience in a restaurant (NRA,
2009).
Author's personal copy
804 M. Bendick Jr. et al. / The Social Science Journal 47 (2010) 802–818
Table 1
Characteristics of Front of the House Manhattan Restaurant employees, 2000, by annual earnings.
Characteristic (a) (b) (c)
Earnings < $40,000
per year
Earnings > $40,000
per year
% Difference
A. Employment
Average hourly earnings $13.65 $28.22 106.7%***
Average work hours per week 37.6 44.7 18.9%***
Average weeks employed per year 43.6 49.7 14.0%***
B. Demographic characteristics
% Persons of color 59.0% 50.6% −14.2%***
% Female 40.2% 18.1% −55.0%***
% Not U.S. citizen 37.2% 23.9% −35.8%***
C. Qualifications
Years of working age (16+) 16.6 26.3 58.4%***
Has education beyond high school 51.4% 60.2% 17.1%***
Speaks English natively, very well, or well 42.8% 48.7% 13.9%***
Not currently a student 81.9% 94.1% 14.9%***
D. Job titles
First-level supervisors 5.4% 4.1% −24.1%***
Waiters/waitreses 62.0% 44.8% −27.7%***
Hosts/hostesses/maitre d’s 5.5% 26.5% 381.8%***
Bartenders 16.0% 19.6% 22.5%***
Bussers 11.1% 5.0% −55.0%***
Source: averages for 1125 persons employed at least 25 h per week in front of the house positions in Manhattan
restaurants, 2000 Census.
∗∗∗
p < .001.
Although restaurants offer large numbers of entry-level jobs, those positions typically pro-
vide low wages, few fringe benefits, little job security, and sometimes employee abuse ranging
from violations of wages and hours laws to racial or sexual harassment (Brennan Center, 2006;
Jayaraman, 2005; ROC-NY, 2005). For many students, actors, or persons between “career”
jobs, restaurants provide short-term income from work unrelated to their eventual careers, and
these disadvantages have only short-term consequences. But many other workers find transi-
tioning to better jobs in other industries difficult, especially for those with limited education,
personal contact networks, or command of English, or in whose native cultures restaurant
jobs are commonly viewed as a career. Among these workers, aspirations for middle class
employment tend to focus on better jobs in the restaurant industry itself.
These better jobs are limited in number, and competition is fierce. In 2000, only about 10%
of “front of the house”4
employees in Manhattan restaurants earned $40,000 or more per year.
In this paper, we use this figure – $40,000 in 2000, corresponding to about $50,000 in 2010
after adjusting for changes in the Consumer Price Index – as the minimum annual earnings
representing “middle class” employment in the high-cost New York City area.
InSectionAofTable1,datafromthe2000U.S.Censusdemonstratesthedivergenteconomic
circumstances of restaurant employees above and below this threshold. Those earning above
that figure had an average hourly wage of $28.22, more than double the $13.65 for those below
the cutoff, and worked an average of 18.9% more hours per week and 14.0% more weeks per
Author's personal copy
M. Bendick Jr. et al. / The Social Science Journal 47 (2010) 802–818 805
year. They were also more likely to receive employer-provided health insurance and pensions,
and enjoyed more occupational prestige. When well-compensated and poorly compensated
jobs persist side-by-side in the same industry with limited worker mobility between the two,
the pattern is sometimes labeled a “segmented” or “dual” labor market (Dickens & Lang, 1985;
Leontaridi, 1998).
The majority of eating establishments in Manhattan are fast food outlets, coffee shops,
delicatessens, and small neighborhood restaurants; 81.5% have fewer than 20 employees (U.S.
Census, 1997). In contrast, the majority of better-paid jobs are in “fine dining” restaurants with
upscale prices, high-income and expense-account customers, and reputations for celebrity
chefs and glamorous style. To create a sampling frame of employers for this study, we listed
all restaurants in Manhattan appearing on any of six widely recognized lists of top New York
City restaurants,5
and the resulting list encompassed 327 establishments.
3. Census evidence of employment discrimination
Casual observation of the dining rooms of Manhattan restaurants suggests that the more
“elite” the establishment, the fewer employees of color. The most dramatic differences are
observable among higher level staff, such as servers, bartenders, and supervisors, although it
sometimes encompasses serving assistants such as food runners and table bussers. Consistent
with such observations, 2000 Census data in Section B of Table 1 shows that front of the house
employees earning more than $40,000 per year in 2000 were 14.2% less likely to be persons of
color and 35.8% less likely to be U.S. citizens than their lesser-paid counterparts. They were
also 55.0% less likely to be female.
Do race, national origin, and gender discrimination underlie these disparities? Before con-
cluding so, we must take account of employee qualifications. Economists define discrimination
as valuation in the labor market of workers’ characteristics, such as race and gender, not related
to their on-the-job productivity (Arrow, 1998). Section C of Table 1 shows that front of the
house restaurant employees in Manhattan making more than $40,000 differ from their lower-
paid counterparts by offering 58.4% more work experience, 17.1% more education, and 13.9%
more English language skills—qualifications arguably related to employees’ ability to perform
theirjobs.Suchdifferencesneedtobecontrolledforbeforeascribingdifferencesinlabormarket
outcomes to employers’ discriminatory behavior.
We do so in Table 2 by applying multiple regression analysis to 2000 Census data on
Manhattan front of the house restaurant employees. According to Column (a) of Table 2, after
controlling for workers’ education, work experience, and command of English, the adverse
effect of being a person of color on annual earnings is $2895 (11.6% of the $24,910 average
annual earnings in this sample). The parallel adverse effect of not being a US citizen is $2405
(9.7%) and of being female is $5430 (21.8%).
Comparison of Columns (b) and (c) of Table 2 suggests that employers’ valuation of
employee qualifications is one important mechanism generating Column (a)’s overall $2895
reduction in annual earnings for race-ethnic minority employees. For example, white employ-
ees with education beyond high school earn an average of $4203 more than their counterparts
with less education, but among persons of color, the same additional education is associated
Author's personal copy
806 M. Bendick Jr. et al. / The Social Science Journal 47 (2010) 802–818
Table 2
Effect of employee characteristics on annual earnings of Front of the House Manhattan Restaurant employees, 2000,
by race-ethnicity.
Characteristic (a) (b) (c) (d)
All employees White
non-Hispanic
employees
Employees of
color
% Difference
between Col. (b)
and Col. (c)
A. Qualifications
Has education beyond
high school
$3200**
$4203*
$3031*
27.9%
Years of working age
(16+)
$962***
$1153***
$885***
23.2%
Currently a student −$619 $1165 −$1693 245.3%
Speaks English
natively, very well, or
well
$5341***
$5936 $5820***
2.0%
B. Demographic characteristics
Is non-white −$2895***
– – –
Is female −$5430***
−$4508**
−$5795***
−28.5%
Is not a US citizen −$2405 −$690 −$2782*
−303.2%
Source: multiple regression analysis of 1125 persons employed at least 25 h per week in front of the house positions
in Manhattan restaurants, 2000 Census. In addition to the variables reported in the table, the regression model
included years of working age squared and an intercept. For Column (a), adjusted r-squared = .18, F = 32.2.
∗
p < .05
∗∗
p < .01
∗∗∗
p < .001.
with an earnings increase of only $3031, 27.9% less. Similarly, for whites, an additional year
of working age (a proxy for work experience) is associated with $1153 higher annual earnings,
but for a person of color, only $885 per year, 23.2% less. Being female reduces annual earnings
$4508 for whites but $5795 for persons of color, 28.5% more; and being a non-citizen reduces
earnings by $690 for whites but $2782 for persons of color, 30.3% more.
Occupational segregation, defined as differing rates of representation of race-ethnic groups
in different job titles, is one important mechanism generating these race-ethnic earnings dif-
ferences. According to 2000 Census data covering Manhattan restaurants of all types, 80.1%
of food runners were persons of color, in contrast to 62.3% of waiter/waitresses and 50.9% of
supervisors.
However, the data in Section D of Table 1 suggest that occupational segregation only explains
part of earnings differences among racial-ethnic groups. There, we observe that persons holding
job titles such as waiter or supervisors may earn either above or below $40,000 per year,
implying that, among persons holding the same job title, the type of establishment in which a
person works also affects earnings. This pattern, in turn, suggests that a particularly likely venue
in which to observe racial employment discrimination is upscale, fine dining establishments,
where earnings – especially via tips6
– are typically highest. If the majority of better-paid
restaurant positions are in fine dining establishments, exclusion of immigrants and persons of
color from this sub-sector would deprive them of their most likely opportunity for living-wage
employment in the industry.
Author's personal copy
M. Bendick Jr. et al. / The Social Science Journal 47 (2010) 802–818 807
This reasoning for focusing on the fine dining sub-sector of the restaurant industry is rein-
forced by historic patterns in which white, male waiters have long been employed in these
establishments as one aspect of product differentiation justifying high prices (Bailey, 1982).
This discrimination assumes that restaurant customers are willing to pay more to be served by
non-minority men (Becker, 1971). Consistent with that assumption, Lynn et al. (2008) reports
that, after holding service quality constant, African American waitpersons’ tips averaged 18%
less than comparable white servers.
4. Paired-comparison testing
The most direct way to test the hypothesis of employer discrimination is to observe those
employers making employment decisions when they are not aware of being observed. However,
in making such observations we still need to control for differences in employee qualifications.
A research technique that allows to do so is matched pair testing (Bendick, 1999, 2007).
Matched pair testing is a systematic research procedure creating quasi-experiments in which
to observe employers’ candid responses to employees’ personal characteristics. In this proce-
dure, pairs of research assistants (“testers”) apply simultaneously for the same actual job
vacancy. Within each tester pair, employee characteristics likely to be related to employee
productivity are controlled by selecting, training, and credentialing testers to appear equally
qualified for the positions they seek. Simultaneously, personal characteristics unrelated to job
performance are experimentally manipulated by pairing testers who differ in one personal
characteristic, such as race. If testers within a pair experience substantially different responses
to their job-seeking efforts, few assumptions and little analysis are required to interpret that
difference as the employer’s reaction to that characteristic.
Since 1990, several dozen well-documented testing studies have been completed for a range
of locations (e.g., Boston, Chicago, Milwaukee, New York, San Francisco, Washington, nation-
wide), occupations (e.g., sales workers, office/clerical employees, management trainees), and
demographic groups (e.g., African Americans or Hispanics paired with whites, holders of
“green card” work permits paired with native-born U.S. citizens, women paired with men,
or 57 year olds paired with 32 year olds). In testing studies examining all stages of the hir-
ing process and pairing race-ethnic minorities with whites, the proportion of tests in which
minority job seekers were treated substantially less favorably than their equally qualified white
testing partners has typically averaged between 20% and 25% (Bendick, 1999, 2007). Thus,
the consensus in this research is that significant discrimination against race-ethnic minorities
continues to operate throughout the US labor market.
Such findings provide the principal ethical justification for matched pair testing. Testing
studies involve employers without their informed consent and induce them to use staff time to
process a job application which will not result in a hire. However, in typical testing situations,
that use of resources is very modest, since most applicants are rejected quickly. Employers are
not asked to deal with situations that are unusual for them; in fact, human resource management
professionals widely believe that at least one-third of non-tester job applicants fabricate some
aspects of their resumes (HR, 2001). And when testing results are released without identifying
the employers tested, individual hiring decision-makers and their companies are protected
Author's personal copy
808 M. Bendick Jr. et al. / The Social Science Journal 47 (2010) 802–818
from adverse consequences. Balanced against these small costs is the over-riding importance
of addressing the social scourge of discrimination. The U.S. Supreme Court, the U.S. Equal
Employment Opportunity Commission, and university human subjects review panels have all
endorsed testing’s role in these efforts (Bendick & Nunes, in press; Riach & Rich, 2004; Boggs,
Sellers & Bendick, 1993).
5. Our testing methods
Some of the testing studies described in the previous section included restaurant jobs as part
of their sample but not in sufficient numbers to be analyzed separately. Prior to the present
research, only one study focused specifically on restaurants. Neumark (1996) found that female
testers had a 40% lower probability than equally qualified males of being offered server jobs
in high-price Philadelphia restaurants.
ApplyingthepairedtestingmethodstoupscaleManhattanrestaurants,werecruited37testers
from among restaurant employees and college students in the New York area, all eligible to
work in the U.S. as citizens or holders of “green card” work permits. We formed two-person
teams consisting of persons of the same gender and similar age, appearance and manner. The
two members of each team differed from each other in race-ethnicity (a white paired with a
Black, Hispanic, Asian, or Middle Eastern tester), accent (a person with no accent paired with
a person with a slight accent), or both.
Prior to conducting tests, testers received training lasting at least eight hours. They were
coached on effective job application techniques, appropriate interview dress, and standard
answers to questions typically asked in server job interviews. They practiced completing
job applications, being interviewed, and objectively recording their job-seeking experiences.
Resumes were developed for each tester ascribing to the members of each tester team equivalent
education (e.g., 2 years of college in institutions of similar reputation), restaurant experience
(e.g., 4 years as a server or service assistant in similar restaurants), other work history, and
eligibility to work in the U.S. (all resumes showed the testers as U.S. citizens). Team member’s
similarity in behavior and answers to questions were enhanced by training teams together and
having them observe each others’ practice interviews.
Between January 2006 and June 2007, testers completed 138 tests on restaurants from the
sampling frame of 327 described in footnote 5. One-third these tests responded to an adver-
tisement for serving staff posted on www.craigslist.com, and the others were selected using
random numbers from the remaining restaurants on the list. A test was considered complete if
both testers made sufficient contact with the employer to reveal their race-ethnicity and express
their desire to be hired. No employer appeared to suspect that any tester was not a bona fide
job applicant.
Testers alternated which member of the team contacted the employer first, with an average of
37 minbetweenthem.Whenatester’sapplicationprocessincludedaninterview,morethan90%
of the interviews were held during the applicant’s initial trip to the restaurant. Immediately after
completing an interaction with an employer and without speaking with their testing partner,
testers recorded their experiences on a structured questionnaire. All phases of testers’ activities
were closely supervised by an attorney with restaurant work experience.
Author's personal copy
M. Bendick Jr. et al. / The Social Science Journal 47 (2010) 802–818 809
Table 3
Outcomes experienced by testers applying for waiter/waitress positions in upscale Manhattan restaurants, by
race/ethnicity.
Outcome (a) (b) (c) (d) (e) (f)
White testers Testers of color White testers–testers
of color
Number % Number % Number %
A. Among 43 tests
(1) Tester was granted a job interview 35 81.4% 26 60.5% 9 20.9%*
B. Among 35 interviews for whites and 26 interviews for people of color
(2) Interview ended with no indication
about a job offer
18 51.4% 16 61.5% 2 −10.1%
(3) Interviewed ended with strong
implication a job would be offered
6 17.1% 5 19.2% 1 −2.1%
(4) Interview ended with a job offer or offer
was received later
11 31.4% 5 19.2% 6 12.2%
(5) % Difference (Whites–people of color)
from pre-interview + interview stages a
30.8% **
Source: 43 paired-comparison hiring tests in upscale Manhattan restaurants, 2006–2007.
a
Column (f) in Row (1) + .814 × Column (f) in row (4), because interviews occurred in 81.4% of tests.
∗
p < .05.
∗∗
p < .01.
6. Testing estimates of discrimination
Using this method, we completed 43 tests which directly examined the hypothesis of race-
ethnic discrimination in hiring. In these tests, the testing pair consisted of a white with a person
of color, and at least one tester received some positive response such as an interview—an
outcome suggesting that the employer had a vacancy to fill and that the employer found the
testers plausible job candidates.
One summary statistic for test outcomes is the “net rate of discrimination,” defined as the
proportion of tests in which the white tester achieved a favorable employment outcome (e.g.,
a job interview) minus the proportion of tests in which the minority tester achieved that out-
come. This subtraction takes account of random circumstances which may affect employment
outcomes, such as that only a single job is vacant so that even non-discriminating employers
could only hire one applicant. It also takes account of possible “reverse discrimination,” in
which employers favor persons of color over whites.
Table 3 divides the outcome of job applications into two broad categories: whether testers
were granted an interview and whether testers who were interviewed received a job offer.
According to the row (1) of table, in 43 tests, 81.4% of white testers were granted an interview,
compared to 60.5% for testers of color, for a net rate of discrimination at that stage of 20.9%.
According to row (4), among testers who were interviewed, 31.4% of white testers received a
job offer, compared to 19.2% of testers of color, for a net rate of discrimination at that stage of
12.2%. Row (5) of the table combines these rates, weighting the former at 100% (because all
completed tests allowed observation of outcomes at that stage) and the latter at 81.4% (because
interviews occurred in only 81.4% of tests). The sum of the two adverse effects, reported in
Author's personal copy
810 M. Bendick Jr. et al. / The Social Science Journal 47 (2010) 802–818
row (5) as 30.8%, is therefore the overall net rate of discrimination adverse to testers of color.
Since each employer was tested only once, this result can equivalently be stated as: testers
of color experienced discrimination in seeking waiter/waitress employment from 30.8% of
upscale Manhattan restaurants.
Another important summary measure of the prevalence of discrimination divides the number
of minority testers achieving an employment outcome by the number of their equally qualified
white testing partners achieving similar success. According to Table 3, in 43 completed tests,
6 testers of color and 11 white testers and received job offers, a ratio of 54.5%. That is, testers
of color were only 54.5% as likely as equally qualified white testers to achieve that outcome.7
The following examples illustrate test outcomes scored as outcomes in which the white
tester was favored:
• Not allowed to apply. At 2 pm on a weekday, an African American man with no accent
visited a well-established Midtown seafood restaurant seeking employment as a waiter.
A restaurant employee told him that there were no current vacancies and refused to take
his resume. Thirty minutes later, a white American man with no accent spoke to the same
restaurant employee. The employee stated that there were no current openings but that
she would retain his resume and call if anything opened up. Three months later, the tester
received a call and was offered a waiter position.
• Not allowed to interview: On a weekday afternoon, a white woman with a slight French
accent entered a fashionable “three star” restaurant seeking employment. After she com-
pleted a job application, a manager took her into a private room for a 20 min interview.
Checking that he was not being observed, the manager corrected spelling errors on her
application and suggested ways to rephrase her answers to interview questions. He asked
no questions about her work experience or restaurant service skills. He stated that she
would be hearing from them in a few days, and she subsequently received a call offering
a server position. One hour later, a Korean American woman with no accent entered the
same establishment seeking work. After completing an application showing education
and work experience equal to that of the previous tester, she handed the form to the
bartender, who said that he would give it to the manager. She was never contacted.
• Notofferedaposition:Onaweekdayafternoon,awhitewomanwithnoaccentarrivedatan
“atmospheric” Midtown restaurant in response to a Craigslist advertisement for waitstaff.
Twominuteslater,aHaitianAmericanwomanwithnoaccentarrivedforthesamepurpose.
They were interviewed by different assistant managers. The second woman’s interview
was held in a busy location and lasted five minutes. She was told that she would be
contacted if the restaurant was interested, but she never heard further. The first woman’s
interview, in a private location, lasted 20 min. The interviewer read her resume carefully,
asked questions about her experience, and requested her to come for training the following
week.
• Qualifications questioned: Answering a Craigslist advertisement, a white woman with no
accent applied at an upscale Italian restaurant. When she first walked in, the host looked
her over slowly, making her feel she already had the job. She was promptly sent to an
assistant manager, who, during an 18 min interview, called her resume impressive, said
that she presented herself well and that she’d “fit right in,” and offered her specific work
Author's personal copy
M. Bendick Jr. et al. / The Social Science Journal 47 (2010) 802–818 811
shifts. He emphasized that she would have opportunities to advance into management and
that the restaurant would pay part of her health insurance. At the end of the interview, he
said that if she would provide a reference, she could start training that day. Meanwhile, a
Chinese American woman with no accent, who had arrived half an hour before the white
woman, was sent away with an interview appointment for the following day. During that
interview, which lasted nine minutes, the same manager who had interviewed the white
woman denied ever hearing of the restaurants on her resume and questioned whether she
had worked in elegant establishments. He concluded by saying that he would call her
after consulting with other managers, but he never did.
In these examples, race/ethnicity is clearly the trigger for the discriminatory treatment our
testers of color encountered. Therefore, the most direct interpretation is that the source of
the discrimination is employers’ reaction to the testers’ race/ethnicity per se. For example,
in their “statistical discrimination” model, economists hypothesize that employers discrimi-
nate by erroneously using the average productivity of their race/ethnic group as a measure
of individual applicants’ likely on-the-job productivity (Ehrenberg & Smith, 2008, chapter
12). Similarly, social psychologists hypothesize that employers discriminate when stereotypes
about applicants’ race/ethnic group distort the employers’ assessments of applicants’ individual
qualifications (Bendick & Nunes, in press).
However, other interpretations suggest more complex relationships between applicants’
race/ethnicity and employers’ adverse reactions. For instance, Bourdieu (1984) emphasizes
that restaurants are a venue in which many aspects of class distinctions and “taste” are worked
out. In that circumstance, restaurant employers might reject job applicants of color not because
the employer expects their job performance to be inferior but because their race/ethnicity
would be inconsistent with an atmosphere of upper-class exclusivity the restaurant offers its
customers. Another interpretation emphasizes efforts by white male employees to maintain
“social closure” – that is, to preserve their “in-group” privilege and social comfort – against any
“out-groups” seeking their scarce, well-paid jobs (Bendick & Nunes, in press; Murray, 1988).
In that circumstance, our minority testers’ race/ethnicity might cause them to be rejected not
because of their race/ethnicity per se but because of the mismatch between these characteristics
and those of the dominant in-group.
The testing results presented in this article were not structured to differentiate rigorously
among these alternative interpretations.8
However, the next section provides some insights by
examining the interactions between testers and the employers who interviewed them.
7. Micro-inequities in treatment of applicants
Does the 31% net rate of hiring discrimination mean that the remaining 69% of upscale
Manhattan restaurants are discrimination-free? Theoretical reasoning and empirical evidence
do not support that interpretation. Employers who hire both whites and persons of color may
still treat them differently after hiring. For example, white restaurant servers might be offered
more work shifts per week, shifts or tables where “big tippers” are prevalent, or opportunities
to advance to supervisory or management positions. Such differences often reflect employers’
Author's personal copy
812 M. Bendick Jr. et al. / The Social Science Journal 47 (2010) 802–818
stereotypical assumptions, conscious or unconscious, that, although both whites and persons
of color may be minimally qualified for waiter/waitress positions, whites are more competent
(Fiske & Lee, 2008; Greenwald & Krieger, 2006). These assumptions may in turn generate
constant “micro-inequities” in daily work life that cumulatively generate substantially differ-
ent earnings, work environments, and career paths for employees of different demographic
backgrounds (Valian, 1999).
Suggestions of race-ethnic differences in post-hiring treatment are provided by the earn-
ing differences and occupational segregation documented in Census data in Section 3 above.
However, these data do not compare treatment of different types of employees by the same
employer, the comparison presented in Table 4.
Focusing first on employers’ stereotypical assumptions about employees’ competence, the
first two rows of Section C of Table 4 report that employers interviewing testers often accepted
white testers’ claims of work experience and food service skills without question while probing
or challenging equivalent credentials presented by testers of color. The next three rows of
Section C report that interviewers also tended to describe the available job more favorably to
white testers, offer them better work days or shifts than testers of color, or otherwise promise
better jobs.
Table 4 also demonstrates that such differences in employment outcome generally co-existed
with no differences in the politeness with white testers and testers of color were treated during
the hiring process. As two job seekers among dozens or even hundreds of applicants screened by
sought-after employers, our testers were sometimes treated impersonally or abruptly. However,
testers of color were not treated worse than their white testing partners. Most employers today
are aware that race-ethnic discrimination is illegal, as well as generally socially unacceptable.
Consistent with findings from testing studies in a range of industries and occupations (Bendick,
1999, 2007), our restaurant testers essentially never encountered blatant discrimination or
disrespect, racial-ethnic epithets, or even explicit acknowledgement of their race-ethnicity.9
Section A of Table 4 presents six measures of the politeness with which testers were treated,
and among them there is no consistent pattern of more favorable treatment for white testers
than their minority testing partners.
This equality of treatment in Section A of the table contrasts sharply with Section C’s
seven measures of employment outcomes, on which minority testers consistently experienced
less success than their white partners. It also contrasts with the 11 indicators in Section B
which measure the apparent seriousness with which testers’ applications were treated prior
to decisions about their application. According to Section B, white testers were not only
more likely to be interviewed than their minority testing partners but to receive longer, more
focused, and more informative interviews. The combination of equal politeness and unequal
seriousness suggests that some employers may seek to appear non-discriminatory by “going
through the motions” of interviewing race-ethnic minority applicants. It may also suggest that,
reflecting unconscious stereotypes, interviewers may make up their minds early in an interview
in favor of white candidates or against minority ones (Fiske & Lee, 2008). By influencing the
length and depth of the interviews themselves, those early predispositions become self-fulfilling
prophecies.
For workers born outside the U.S., a particularly salient issue involves employers’ willing-
ness to hire workers speaking English with an accent. Research on U.S. employers in a range
Author's personal copy
M. Bendick Jr. et al. / The Social Science Journal 47 (2010) 802–818 813
Table 4
Treatment of testers applying for waiter/waitress positions in upscale Manhattan restaurants, by race/ethnicity.
Measure White testers Testers of
color
% Difference
(“−” means
Whites
favored)
A. How politely was applicant treated?
Average minutes waiting to be interviewed 8.2 10.3 −25.6%
Employer friendliness during initial contact (scale of
+2 = very friendly, −2 = very unfriendly)
0.2 0.1 −2.6%
Employer friendliness during job interview (scale of
+2 = very friendly to −2 = very unfriendly)
0.7 0.7 1.2%
Interviewer introduced self to applicant 60.7% 70.0% 15.3%
Interviewer shook applicant’s hand 85.7% 74.2% −13.4%
Interviewer used applicant’s name 42.9% 55.8% 30.1%
% of 6 measures on which whites were favored 50.0%
Average % difference 0.8%
B. How Seriously was Applicant Considered?
Applicant was granted an interview 81.4% 60.5% −25.7%
Interview was conducted by a manager, not a subordinate 100.0% 100.0% 0.0%
Interview was held in quiet place without interruptions 82.1% 77.4% −5.7%
Average length of interview (min) 11.1 9.2 −17.1%
Interviewer looked carefully at applicant’s resume 39.3% 32.3% −17.8%
Interviewer provided substantial information about job duties 40.7% 16.7% −59.0%
Interviewer provided substantial information about potential
earnings
44.0% 29.0% −34.1%
Interviewer volunteered key information without being asked 74.1% 59.3% −20.0%
% of interview devoted to job requirements and applicant
qualifications
97.0% 83.3% −14.1%
Interviewer suggested additional vacancies for the applicant
to consider
10.7% 12.5% 16.8%
At end of interview, interviewer volunteered information on
next steps
81.2% 62.9% −22.5%
% of 11 measures on which whites favored 72.7%***
Average % difference −18.1%
C. What are Likely Employment Outcomes?
Applicant’s work experience was accepted without probing 40.7% 20.7% −49.1%
Applicant’s food/wine/table service knowledge was accepted
without probing
75.9% 66.6% −12.3%
Job was described more favorably to this applicant than to
testing partner
27.8% 11.1% −60.1%
Days or shifts discussed were better than those for testing
partner
44.0% 0.0% −100.0%
Where both applicants received offers, this applicant’s offer
was better
25.0% 0.0% −100.0%
Interviewee was offered a job or signaled an offer would be
forthcoming
48.6% 38.5% −20.8%
Interview closed with friendly, positive, or “welcome
aboard” comments
67.9% 48.4% −28.7%
% of 7 measures on which white were favored 100.0%***
Average % difference −53.0%
Source: 43 hiring tests in upscale Manhattan restaurants, 2006–2007.
∗∗∗
In a sign test, different from .5 at < .01.
Author's personal copy
814 M. Bendick Jr. et al. / The Social Science Journal 47 (2010) 802–818
of occupations and industries concludes that they often reject minority employees not explic-
itly on their race-ethnicity but for the more socially acceptable reason that, in the employers’
perceptions, they lack the “soft skills” to perform the job (Moss & Tilly, 2001). For restaurant
server positions, “soft skills” would include reliability in attendance, teamwork with super-
visors and fellow workers, and articulateness. The label differentiates these skills from “hard
skills” involving technical knowledge and techniques specific to an occupation—in the case
of servers in fine dining, these might include knowledge of food-wine pairings or specific
cuisines.
The present testing study allows us to examine the soft skill of “articulateness” in more
depth. In our tests, job applicant’s actual articulateness was controlled by employing only
white and minority testers who were all fully articulate in English. However, within our
sample of completed tests, 24 paired whites without accents and whites with a slight accent
(mostly French), and 8 tests paired testers of color without accent to testers of color with
accents (French, Spanish, or Asian). To the extent that accents increased job-seeking suc-
cess among white testers but had a different effect among testers of color, then employers’
rejection of testers of color with accents might be interpreted as discrimination based on
race/ethnicity or social class consciously or unconsciously disguised as a concern about
articulateness.
Did the employers we tested appear to view white job applicants’ accents as “charming” but
equal accents by persons of color as “difficult for customers to understand?” Consistent with the
hypothesis that accents were a plus factor for whites, in 37.5% of the white–white tests, white
testers with accents were favored over their white partners without accents, while the reverse
was true in 14.4% of tests, for a net rate of increased success of 23.1%; this difference is sta-
tistically significant at p < .001. No such positive effect was observed in the minority–minority
tests, where no statistically significant difference was observed in the application success of
testers with and without accents.
The implications of the findings presented in this section are important. Because our testing-
based 30.8% net rate of discrimination is computed from only the most visible, substantial
differences in hiring, it imperfectly captures multiple additional ways in which discrimi-
nation potentially affects restaurant employees. The 69% of upscale Manhattan restaurants
where testing did not document race-ethnic differences in hiring should not be assumed to be
discrimination-free.10
8. The impact of changing employment practices
The empirical findings in this paper support the conclusion that substantial social stratifi-
cation adverse to racial minorities continues within the restaurant industry and that restaurant
industry managers are key organizational actors maintaining that stratification. Enhanced
enforcementofequalopportunitylawsandadoptionbyrestaurantsoftransparent,performance-
based human resource management practices (Bielby, 2008) could help to lessen such
racial employment inequality. Testing studies modeled after the present study might use-
fully contribute toward motivating and implementing both types of actions (Bendick, 1999,
2007).
Author's personal copy
M. Bendick Jr. et al. / The Social Science Journal 47 (2010) 802–818 815
Table 5
Quality of Front of the House Jobs Manhattan Restaurants held by persons of color, 2007, by type of restaurant and
work role.
(a) (b) (c) (d)
Indicator of job quality Server and
Supervisor
Positions in
Fine Dining
Restaurants
Other Front of
the House
Positions in
Fine Dining
Restaurants
Front of the
House
Positions in
Fast Food and
Casual Dining
Restaurants
(1) I earn > $31,000/year. 70.7% 33.3%***
14.3%***
(2) I feel free from the risk of getting hurt. 81.8% 84.9% 88.4%
(3) My job requires me to learn new skills. 67.2% 58.5% 56.3%*
(4) I do not experience abuse or discrimination. 66.7% 66.0% 70.9%
(5) I get health insurance. 41.5% 58.0%*
33.2%
(6) I am paid time and a half over 40 h/week. 25.5% 36.8% 18.9%
(7) I get a paid break after 4 work hours. 18.2% 28.3% 34.8%**
(8) I get paid vacation days. 18.2% 30.2% 15.4%
(9) I have some say in workplace decisions. 15.4% 21.2% 15.5%
(10) I get paid sick days. 12.1% 15.1% 8.2%
Source: authors’ tabulation from survey of 426 employees of New York City restaurants, 2007 (Jayaraman et al.,
2009).
∗
p < .05 for difference from column (b).
∗∗
p < .01 for difference from column (b).
∗∗∗
p < .001 for difference from column (b).
The most direct beneficiaries of reduced discrimination in upscale Manhattan restaurants
would be those workers of color who would be hired there. Our sampling frame of fine din-
ing establishments in Manhattan encompassed 327 establishments. Assuming that each of
these establishments employs an average of 35 workers in front of the house positions paying
$50,000 or more in 2010, there are 11,500 such positions in the Manhattan fine dining industry.
Assuming than 30.1% of these jobs have been closed to persons of color, the potential effect of
eliminating that hiring discrimination would be 3500 more persons of color employed there.
Although such an increase would be substantial, it should be kept in perspective. As noted
in Section 2, more than 123,000 persons work in the Manhattan restaurant industry, among
whom 68.7% – 84,500 workers – are persons of color (U.S. Census 2000). Opening 3500
well-paid positions in fine dining restaurants would directly improve employment for 4.1% of
those 84,500. For the remaining 95.9% of Manhattan restaurant workers or color, as well as
their white counterparts, the principal path to “middle class” employment would be improved
compensation and working conditions in their current positions.
How good are those current positions? Table 5 presents data from a 2007 survey of restaurant
workers of color in New York City restaurants (Jayaraman et al., 2009). The table compares
positions as servers and supervisors in fine dining establishments – approximately the jobs
examined in our matched pair tests – to “lower ranked” front of the house positions in fine
dining establishments (e.g., table bussers and food runners), as well as all front of the house
workers in “casual dining” or “fast food” restaurants. Consistent with findings earlier in this
paper, the first row of the table reports that supervisors and servers in fine dining establishments
have significantly higher earnings than the other two groups of workers. However, according to
Author's personal copy
816 M. Bendick Jr. et al. / The Social Science Journal 47 (2010) 802–818
Column (b) of the table, fewer than half of supervisor and servers in fine dining establishments
receive health insurance, overtime pay, work breaks, vacation days, sick pay, or substantial
voice in workplace decisions. Indeed, according to columns (c) and (d) of the table, on such
measures of job quality, supervisor and server positions in fine dining are not consistently
superior to front of the house jobs in casual dining or fast food establishments, or to “lower
ranked” positions (such as table bussers) in fine dining.
The point here is that middle class employment requires not just equal opportunity but
equal opportunity – that is, not only access to jobs but jobs of good quality. The positions
for which we documented race-ethnic discrimination in hiring – server position in fine dining
establishments—are certainly preferable to other positions in the industry but not consistently
high quality as measured by a number of indicators. Upgrading working conditions across
the board in the restaurant industry may be as important as expanding equal employment
opportunity in improving the work lives of Manhattan’s – and the nation’s – restaurant workers.
Notes
3. Throughout this paper, “white” is shorthand for the 2000 Census category of white
non-Hispanics, and “persons of color” refer to the Census categories of African Ameri-
cans/Blacks,Hispanics/Latinos,Asians,AmericanIndians,NativeHawaiiansandPacific
Islanders, and mixed races.
4. A restaurant’s “front of the house” is the dining area, where waiters/waitresses,
host/hostesses, bartenders, cocktail servers, table bussers, food runners, and their super-
visors work. “Back of the house” (kitchen) employment is not examined in this study,
but it is in ROC-NY (2005).
5. Our sampling frame consisted of establishments in any of 25 well-known “mini-empires”
of high-reputation restaurants; in Restaurants and Institutions’ top 100 restaurants by
sales or 75 top multi-concept operators; in Zagat (2006)’s “Most Popular” or “Top 50”
for service, décor, or food; in Zagat (2006) and participating in New York Restaurant
Week 2006; or in Platt (2005) or Platt (2006).
6. In auditing the earnings of restaurant employees, the Internal Revenue Service assumes
that tips total 8% of restaurant revenues (IRS, 1990). Thus, if restaurants employ similar
numbers of employees per customer, higher-priced meals translate directly into greater
tip income for servers.
7. In 2000 Census data, among persons of color employed as waitstaff in Manhattan restau-
rants, 5.4% earned at least $40,000, while among their white peers, the corresponding
proportion was 7.7%. Dividing 5.4 × 7.7 yields a rate of achieving this favorable employ-
ment outcome 70.0% as high for persons of color as for whites. By being roughly
consistent with 54.5%, 70.0% confirms the reasonableness of the testing-based esti-
mate. The difference between 70.0% and 54.5% suggests lower turnover among workers
of color who succeed on obtaining such well-paid positions than among their white
co-workers.
8. Bendick and Nunes (in press) describes matched pair testing studies designed to tests
these alternative hypotheses.
Author's personal copy
M. Bendick Jr. et al. / The Social Science Journal 47 (2010) 802–818 817
9. However, non-testing evidence reminds us that blatant racism still occurs in some restau-
rants; see, for example, Adamson (2000), Feagin and Sykes (1994), and Watkins (1997).
10. Because our study never paired male and female testers, it does not directly address
gender discrimination. However, the Census data in Section 3, as well as other studies
cited throughout this paper, suggest that this form of discrimination is also prevalent in
upscale restaurants.
Acknowledgement
The authors gratefully acknowledge financial support from the Ford Foundation and insight-
ful comments by an anonymous Social Science Journal referee.
References
Adamson, J. (2000). The Denny’s story, how a company in crisis resurrected its good name. John Wiley.
Alger, H., Jr. (2007). Ragged Dick. W.W. Norton.
Arrow, K. (1998). What has economics to say about racial discrimination? Journal of Economic Perspectives, 12,
91–100.
Bailey, T. (1982). Immigrant and native-born workers in the restaurant industry. Columbia University Conservation
of Human Resources.
Becker, G. (1971). The economics of discrimination. University of Chicago Press.
Bielby, W. (2008). Promoting racial diversity at work, Challenges and solutions. In A. Brief (Ed.), Diversity at work
(pp. 53–88). Cambridge University Press.
Bendick, M., Jr. (1999). Adding testing to the nation’s portfolio of information on employment discrimination.
In M. Fix, & M. Turner (Eds.), A national report card on discrimination in America: The role of testing (pp.
47–86). The Urban Institute Press.
Bendick, M., Jr. (2007). Situation testing for employment discrimination in the United States of America. Horizons
Strategiques, 5, 17–39.
Bendick, Jr., M., & Nunes, A. (in press). Developing the research basis for controlling bias in hiring. Journal of
Social Issues.
Boggs, R., Sellers, J., & Bendick, M., Jr. (1993). Use of testing in civil rights enforcement. In M. Fix, & R. Struyk
(Eds.), Clear and convincing evidence, Measurement of discrimination in America (pp. 345–376). The Urban
Institute Press.
Bourdieu, P. (1984). Distinction, A social critique of the judgment of taste. Cambridge: Harvard University Press.
Brennan Center. (2006). Unregulated work in the restaurant Industry in New York City. In Unregulated work in the
global city. Brennan Center for Justice, New York University School of Law.
Denstedt, M. (2008). Precariousness on the menu, Restaurant work and labour mobility within the low-wage service
industry in Kingston, Ontario. M.A. Thesis, Queens University.
Dickens, W., & Lang, K. (1985). A test of the dual labor market theory. American Economic Review, 75, 792–805.
Ehrenberg, R., & Smith, R. (2008). Modern labor economics. Addison-Wesley.
Feagin, J., Vera, H., & Batur, P. (2001). White racism. Routledge.
Feagin, J., & Sykes, M. (1994). Living with racism, The black middle class experience. Beacon Press.
Fiske, S., & Lee, T. (2008). Stereotypes and prejudice create workplace discrimination. In A. Brief (Ed.), Diversity
at work (pp. 13–52). Cambridge University Press.
Gabriel, P. (2005). A longitudinal examination of earnings inequality and mobility among young, full-time workers
in the United States. The Social Science Journal, 42, 603–607.
Greenwald, A., & Krieger, L. (2006). Implicit bias, Scientific foundations. California Law Review, 94, 945–967.
Author's personal copy
818 M. Bendick Jr. et al. / The Social Science Journal 47 (2010) 802–818
HR. (2001). Verify executive resumes early in the process. HR Magazine, (November), 14.
Isaacs, J., Sawhill, I., & Haskins, R. (2008). Getting a head or losing ground, Economic mobility in America. The
Brookings Institution.
Iverson, R., & Armstrong, A. (2006). Jobs aren’t enough, Toward a new economic mobility for low-income families.
Temple University Press.
IRS. (1990). Tip income study, Research publication 1530. U.S. Internal Revenue Service Washington Research
Division.
Jayaraman, S. (2005). ROCing” the industry: Organizing restaurant workers in New York. In S. Jayaraman, & E.
Ness (Eds.), The new urban immigrant workforce, Innovative models for labor organizing. M.E. Sharpe, pp.
112–142
Jayamaran, S., Romero-Alston, L., Dropkin, J., Siby, S., & Markowitz, S. (2009). Dangerous dining, Health and
safety in the New York City Restaurant industry. Restaurant Opportunity Center of New York.
Leontaridi, M. (1998). Segmented Labour markets, Theory and evidence. Journal of Economic Surveys, 12, 63–101.
Lynn, M., Struman, M., Ganley, C., Adams, E., Douglas, M., & McNeal, J. (2008). Consumer racial discrimination
in tipping: A replication and extension. Journal of Applied Social Psychology, 38, 1045–1060.
Morales, R. (2005). Contending tradeoffs, IRCA, immigrants, and the Southern California restaurant industry.
Review of Policy Research, 11, 143–151.
Moss, P., & Tilly, C. (2001). Tales employers tell, Race, skills and hiring in America. Russell Sage Foundation.
Murray, R. (1988). Social closure, The theory of monopolization and exclusion. Oxford University Press.
NRA. (2006). State of the restaurant industry workforce: An overview. National Restaurant Association.
NRA. (2009). Restaurant industry pocket factbook. National Restaurant Association.
Neumark, D. (1996). Sex discrimination in restaurant hiring: An audit study. Quarterly Journal of Economics, 113,
915–941.
Platt, A. (2006). The Platt 101, New York’s best restaurants. New York Magazine, (January 9).
Platt, A. (2005). here to eat 2005. New York Magazine, (May 21).
Riach, P., & Rich, J. (2004). Deceptive field experiments of discrimination: Are they ethical? Kyklos, 57, 457–470.
ROC-NY. (2005). Behind kitchen doors, Pervasive inequality in New York City’s thriving restaurant industry.
Restaurant Opportunities Center of New York.
Slonaker, W., Wendt, A., & Baker, B. (2007). Employment discrimination in the restaurant industry. Cornell Hotel
and Restaurant Administration Quarterly, 48, 46–58.
U.S. Bureau of Labor Statistics (2008). A profile of the working poor, 2006. Report 1006. Bureau of Labor Statistics,
U.S. Department of Labor.
USCB. (2000). Census 2000 EEO data tool. New York County, NY: Census Bureau., at http://www.census.gov/cgi-
bin/broker
USCB. (2006). County business patterns. New York County, NY: Census Bureau., at http://factfinder.census.gov
Valian, V. (1999). Why so slow? The progress of women. MIT Press.
Watkins, S. (1997). The black O, Racism and redemption in an American corporation. University of Georgia Press.
Zagat. (2006). New York City restaurants. Zagat.

More Related Content

Viewers also liked

Pc doctor for windows
Pc doctor for windowsPc doctor for windows
Pc doctor for windowsAmeer Net
 
Proyecto Final Nuevas Técnicas Publicitarias
Proyecto Final Nuevas Técnicas Publicitarias Proyecto Final Nuevas Técnicas Publicitarias
Proyecto Final Nuevas Técnicas Publicitarias juligriffindor
 
Ingenieria de requisitos moises
Ingenieria de requisitos moisesIngenieria de requisitos moises
Ingenieria de requisitos moisesMoisés Rodríguez
 
R Tirado - Resume NO PII
R Tirado - Resume NO PIIR Tirado - Resume NO PII
R Tirado - Resume NO PIIRuth Tirado
 

Viewers also liked (8)

Redaccion de-textos
Redaccion de-textosRedaccion de-textos
Redaccion de-textos
 
Pc doctor for windows
Pc doctor for windowsPc doctor for windows
Pc doctor for windows
 
Ennea 9 essentials brochure 26 April 16
Ennea 9 essentials brochure 26 April 16Ennea 9 essentials brochure 26 April 16
Ennea 9 essentials brochure 26 April 16
 
Proyecto Final Nuevas Técnicas Publicitarias
Proyecto Final Nuevas Técnicas Publicitarias Proyecto Final Nuevas Técnicas Publicitarias
Proyecto Final Nuevas Técnicas Publicitarias
 
sukhvinder Singh54
sukhvinder Singh54sukhvinder Singh54
sukhvinder Singh54
 
Maher aboud C.V
Maher aboud C.VMaher aboud C.V
Maher aboud C.V
 
Ingenieria de requisitos moises
Ingenieria de requisitos moisesIngenieria de requisitos moises
Ingenieria de requisitos moises
 
R Tirado - Resume NO PII
R Tirado - Resume NO PIIR Tirado - Resume NO PII
R Tirado - Resume NO PII
 

Similar to SOCSCI821

Anthropology Research Paper. Cultural Anthropolo
Anthropology Research Paper. Cultural AnthropoloAnthropology Research Paper. Cultural Anthropolo
Anthropology Research Paper. Cultural AnthropoloKimberly Harris
 
El Centro CollegeENVR 1401 OnlineWhat Trophic Level Are YouOb.docx
El Centro CollegeENVR 1401 OnlineWhat Trophic Level Are YouOb.docxEl Centro CollegeENVR 1401 OnlineWhat Trophic Level Are YouOb.docx
El Centro CollegeENVR 1401 OnlineWhat Trophic Level Are YouOb.docxgreg1eden90113
 
Darden Essays.pdfDarden Essays
Darden Essays.pdfDarden EssaysDarden Essays.pdfDarden Essays
Darden Essays.pdfDarden Essaysiyldyzadf
 
My Favorite Movie Essay Example. Online assignment writing service.
My Favorite Movie Essay Example. Online assignment writing service.My Favorite Movie Essay Example. Online assignment writing service.
My Favorite Movie Essay Example. Online assignment writing service.Crystal Hall
 
Running Head RESEARCH TOPIC .docx
Running Head RESEARCH TOPIC                                      .docxRunning Head RESEARCH TOPIC                                      .docx
Running Head RESEARCH TOPIC .docxtodd521
 
RESEARCH ARTICLEPerceived discrimination in medical settin.docx
RESEARCH ARTICLEPerceived discrimination in medical settin.docxRESEARCH ARTICLEPerceived discrimination in medical settin.docx
RESEARCH ARTICLEPerceived discrimination in medical settin.docxrgladys1
 
[Last Name] 1[Your Name][Instructor Name][Course Number].docx
[Last Name] 1[Your Name][Instructor Name][Course Number].docx[Last Name] 1[Your Name][Instructor Name][Course Number].docx
[Last Name] 1[Your Name][Instructor Name][Course Number].docxAASTHA76
 
Essay On Demographics And Data Collection Methodology
Essay On Demographics And Data Collection MethodologyEssay On Demographics And Data Collection Methodology
Essay On Demographics And Data Collection MethodologyHeidi Owens
 
Remarkable Report Essay Thatsnotus
Remarkable Report Essay ThatsnotusRemarkable Report Essay Thatsnotus
Remarkable Report Essay ThatsnotusElaine Ake
 
Essay On Promoting Awareness On Road Safety
Essay On Promoting Awareness On Road SafetyEssay On Promoting Awareness On Road Safety
Essay On Promoting Awareness On Road SafetyChristy Williams
 
1) Minimum 10 full pages (No word count per page)- Follow the 3 x
1) Minimum 10 full pages (No word count per page)- Follow the 3 x 1) Minimum 10 full pages (No word count per page)- Follow the 3 x
1) Minimum 10 full pages (No word count per page)- Follow the 3 x AbbyWhyte974
 
1) Minimum 10 full pages (No word count per page)- Follow the 3 x
1) Minimum 10 full pages (No word count per page)- Follow the 3 x 1) Minimum 10 full pages (No word count per page)- Follow the 3 x
1) Minimum 10 full pages (No word count per page)- Follow the 3 x MartineMccracken314
 
Position Paper on Family Definition and RoleOver the past seve.docx
Position Paper on Family  Definition and RoleOver the past seve.docxPosition Paper on Family  Definition and RoleOver the past seve.docx
Position Paper on Family Definition and RoleOver the past seve.docxharrisonhoward80223
 
Nuclear Technology Essay
Nuclear Technology EssayNuclear Technology Essay
Nuclear Technology EssayAlly Gonzales
 
Premium Vector Trace The Names Of Solar System Pla
Premium Vector Trace The Names Of Solar System PlaPremium Vector Trace The Names Of Solar System Pla
Premium Vector Trace The Names Of Solar System PlaLori Head
 
Climate Change Essay Topics. 005 Essay Example Climate Change Thatsnotus
Climate Change Essay Topics. 005 Essay Example Climate Change  ThatsnotusClimate Change Essay Topics. 005 Essay Example Climate Change  Thatsnotus
Climate Change Essay Topics. 005 Essay Example Climate Change ThatsnotusOlga Valentin
 
Essay On Life Is Beautiful Movie. Online assignment writing service.
Essay On Life Is Beautiful Movie. Online assignment writing service.Essay On Life Is Beautiful Movie. Online assignment writing service.
Essay On Life Is Beautiful Movie. Online assignment writing service.Jade Morris
 
ABM_ApEc_AIRs_LM_Q2_W3-4_M2_MaryAnnD.Cacayuran.MFBB.pdf
ABM_ApEc_AIRs_LM_Q2_W3-4_M2_MaryAnnD.Cacayuran.MFBB.pdfABM_ApEc_AIRs_LM_Q2_W3-4_M2_MaryAnnD.Cacayuran.MFBB.pdf
ABM_ApEc_AIRs_LM_Q2_W3-4_M2_MaryAnnD.Cacayuran.MFBB.pdfmollyadelle31
 
ECON  303  Intermediate  Microeconomics  II  P.docx
ECON  303  Intermediate  Microeconomics  II  P.docxECON  303  Intermediate  Microeconomics  II  P.docx
ECON  303  Intermediate  Microeconomics  II  P.docxjack60216
 

Similar to SOCSCI821 (20)

Anthropology Research Paper. Cultural Anthropolo
Anthropology Research Paper. Cultural AnthropoloAnthropology Research Paper. Cultural Anthropolo
Anthropology Research Paper. Cultural Anthropolo
 
El Centro CollegeENVR 1401 OnlineWhat Trophic Level Are YouOb.docx
El Centro CollegeENVR 1401 OnlineWhat Trophic Level Are YouOb.docxEl Centro CollegeENVR 1401 OnlineWhat Trophic Level Are YouOb.docx
El Centro CollegeENVR 1401 OnlineWhat Trophic Level Are YouOb.docx
 
Darden Essays.pdfDarden Essays
Darden Essays.pdfDarden EssaysDarden Essays.pdfDarden Essays
Darden Essays.pdfDarden Essays
 
My Favorite Movie Essay Example. Online assignment writing service.
My Favorite Movie Essay Example. Online assignment writing service.My Favorite Movie Essay Example. Online assignment writing service.
My Favorite Movie Essay Example. Online assignment writing service.
 
Running Head RESEARCH TOPIC .docx
Running Head RESEARCH TOPIC                                      .docxRunning Head RESEARCH TOPIC                                      .docx
Running Head RESEARCH TOPIC .docx
 
RESEARCH ARTICLEPerceived discrimination in medical settin.docx
RESEARCH ARTICLEPerceived discrimination in medical settin.docxRESEARCH ARTICLEPerceived discrimination in medical settin.docx
RESEARCH ARTICLEPerceived discrimination in medical settin.docx
 
[Last Name] 1[Your Name][Instructor Name][Course Number].docx
[Last Name] 1[Your Name][Instructor Name][Course Number].docx[Last Name] 1[Your Name][Instructor Name][Course Number].docx
[Last Name] 1[Your Name][Instructor Name][Course Number].docx
 
Essay On Demographics And Data Collection Methodology
Essay On Demographics And Data Collection MethodologyEssay On Demographics And Data Collection Methodology
Essay On Demographics And Data Collection Methodology
 
Remarkable Report Essay Thatsnotus
Remarkable Report Essay ThatsnotusRemarkable Report Essay Thatsnotus
Remarkable Report Essay Thatsnotus
 
Essay On Promoting Awareness On Road Safety
Essay On Promoting Awareness On Road SafetyEssay On Promoting Awareness On Road Safety
Essay On Promoting Awareness On Road Safety
 
1) Minimum 10 full pages (No word count per page)- Follow the 3 x
1) Minimum 10 full pages (No word count per page)- Follow the 3 x 1) Minimum 10 full pages (No word count per page)- Follow the 3 x
1) Minimum 10 full pages (No word count per page)- Follow the 3 x
 
1) Minimum 10 full pages (No word count per page)- Follow the 3 x
1) Minimum 10 full pages (No word count per page)- Follow the 3 x 1) Minimum 10 full pages (No word count per page)- Follow the 3 x
1) Minimum 10 full pages (No word count per page)- Follow the 3 x
 
Position Paper on Family Definition and RoleOver the past seve.docx
Position Paper on Family  Definition and RoleOver the past seve.docxPosition Paper on Family  Definition and RoleOver the past seve.docx
Position Paper on Family Definition and RoleOver the past seve.docx
 
Nuclear Technology Essay
Nuclear Technology EssayNuclear Technology Essay
Nuclear Technology Essay
 
Premium Vector Trace The Names Of Solar System Pla
Premium Vector Trace The Names Of Solar System PlaPremium Vector Trace The Names Of Solar System Pla
Premium Vector Trace The Names Of Solar System Pla
 
Climate Change Essay Topics. 005 Essay Example Climate Change Thatsnotus
Climate Change Essay Topics. 005 Essay Example Climate Change  ThatsnotusClimate Change Essay Topics. 005 Essay Example Climate Change  Thatsnotus
Climate Change Essay Topics. 005 Essay Example Climate Change Thatsnotus
 
Colors pop up night epk
Colors pop up night epkColors pop up night epk
Colors pop up night epk
 
Essay On Life Is Beautiful Movie. Online assignment writing service.
Essay On Life Is Beautiful Movie. Online assignment writing service.Essay On Life Is Beautiful Movie. Online assignment writing service.
Essay On Life Is Beautiful Movie. Online assignment writing service.
 
ABM_ApEc_AIRs_LM_Q2_W3-4_M2_MaryAnnD.Cacayuran.MFBB.pdf
ABM_ApEc_AIRs_LM_Q2_W3-4_M2_MaryAnnD.Cacayuran.MFBB.pdfABM_ApEc_AIRs_LM_Q2_W3-4_M2_MaryAnnD.Cacayuran.MFBB.pdf
ABM_ApEc_AIRs_LM_Q2_W3-4_M2_MaryAnnD.Cacayuran.MFBB.pdf
 
ECON  303  Intermediate  Microeconomics  II  P.docx
ECON  303  Intermediate  Microeconomics  II  P.docxECON  303  Intermediate  Microeconomics  II  P.docx
ECON  303  Intermediate  Microeconomics  II  P.docx
 

SOCSCI821

  • 1. This article appeared in a journal published by Elsevier. The attached copy is furnished to the author for internal non-commercial research and education use, including for instruction at the authors institution and sharing with colleagues. Other uses, including reproduction and distribution, or selling or licensing copies, or posting to personal, institutional or third party websites are prohibited. In most cases authors are permitted to post their version of the article (e.g. in Word or Tex form) to their personal website or institutional repository. Authors requiring further information regarding Elsevier’s archiving and manuscript policies are encouraged to visit: http://www.elsevier.com/copyright
  • 2. Author's personal copy The Social Science Journal 47 (2010) 802–818 Available online at www.sciencedirect.com Employment discrimination in upscale restaurants: Evidence from matched pair testing Marc Bendick Jr.a,∗, Rekha Eanni Rodriguezb,1, Sarumathi Jayaramanc,d,2 a Bendick and Egan Economic Consultants, Inc.,Washington, DC, USA b Restaurant Opportunities Center of New York, New York, NY, USA c Political Science Department, Brooklyn College, Brooklyn, NY, USA d Restaurant Opportunity Center-United, New York, NY, USA Received 3 February 2009; received in revised form 11 March 2010; accepted 5 April 2010 Abstract White and racial minorities with equal qualifications applied simultaneously for 43 waiter/waitress jobs in New York City fine dining restaurants. Applicants of all demographic backgrounds were treated with equal courtesy, but minorities were only 54% as likely as whites to receive a job offer. This discrimination, either conscious or unconscious, was documented in 31% of restaurants tested. Post- hiring differences appear even more widespread, with front of the house minority restaurant servers averaging 12% lower earnings than their equally qualified white peers. Ensuring equal treatment in hiring would expand minority access to good jobs in Manhattan fine dining by 3500 positions but not make it universal. © 2010 Western Social Science Association. Published by Elsevier Inc. All rights reserved. Keywords: Employment; Discrimination; Race; Immigrants; Testing; Restaurant industry ∗ Corresponding author. Tel.: +1 202 686 0245; fax: +1 202 363 4429. E-mail addresses: bendickegan@mindspring.com (M. Bendick Jr.), rekhaeanni@yahoo.com (R.E. Rodriguez), saruj@brooklyn.cuny.edu, sarulove@yahoo.com (S. Jayaraman). URLs: http://www.bendickegan.com (M. Bendick Jr.), http://www.rocny.org (R.E. Rodriguez), http://www.brooklyn.cuny.edu (S. Jayaraman), http://www.rocunited.org (S. Jayaraman). 1 Tel.: +1 212 343 1771; fax: +1 212 343 7217. 2 Tel.: +1 718 951 5000x1754/212 243 6900; fax: +1 718 951 4833/212 243 6800. 0362-3319/$ – see front matter © 2010 Western Social Science Association. Published by Elsevier Inc. All rights reserved. doi:10.1016/j.soscij.2010.04.001
  • 3. Author's personal copy M. Bendick Jr. et al. / The Social Science Journal 47 (2010) 802–818 803 1. Introduction In the classic “Horatio Alger” model of American social mobility, persons outside the employment mainstream take whatever low-paid, precarious jobs they can obtain with limited qualifications and, while there, acquire skills, credentials and contacts enabling them to move to stable, career positions providing a middle class standard of living (Alger, 2007; Gabriel, 2005; Isaacs, Sawhill & Haskins, 2008; Iverson & Armstrong, 2006). For immigrants, that initial employmentisoftenfoundintherestaurantindustry,which,with1.4millionimmigrantsamong its 13 million employees nationwide, is the nation’s largest employer of workers born outside the U.S. (NRA, 2006; NRA, 2009). Those immigrants’ fellow employees also include many native-born individuals among the nation’s 7.7 million “working poor,” whose households remain below the official U.S. poverty threshold despite being in the work force at least half the year (U.S. Bureau of Labor Statistics, 2008). When restaurant employees seek upward mobility within the industry itself, the experiences of white workers and workers of color3 often differ sharply. While immigrants from France or Ireland may soon “work their way up” to well-paid server, manager, or even owner positions in fine dining restaurants, their counterparts from Haiti or Mexico may remain bussing tables in those restaurants or serving customers in fast food outlets or small neighborhood establish- ments. Career paths for native-born whites and native-born persons of color often similarly diverge. This paper measures the role of employer discrimination in those differences. We first describe restaurant employment, the experiences of low-skill and immigrant workers in those jobs, and the hypothesis of employment discrimination against persons of color. We then empirically test that hypothesis using two methodologies: statistical analyses of Census data and matched pair testing of restaurant hiring. Both analyses strongly confirm the hypothesis. Our empirical findings are based on restaurants in the Manhattan borough of New York City, where immigrants and persons of color constitute a particularly large proportion of the local labor force and upscale restaurants are a particularly prominent part of the local econ- omy. However, similar employment patterns are likely to prevail throughout the U.S.A. Using other research techniques, similar patterns have been documented, for example, in San Diego (Morales, 2005); Kingston, Ontario (Denstedt, 2008); Ohio (Slonaker, Wendt, & Baker, 2007); and nation-wide restaurant chains (Feagin, Vera, & Batur, 2001, chapter 3). 2. Restaurant employment In Manhattan, with 1.6 million residents and the majority of New York City’s 44 million visi- tors annually, more than 7900 food service establishments employ more than 123,000 workers (U.S. Census, 2006) in jobs which are growing at twice the rate of all employment (NRA, 2006). Reflecting this employment growth, high employee turnover, and limited employment prerequisites, restaurants are a frequent first employer for many persons, both immigrants and native-born, seeking initial entry into the American labor market. In fact, more than one out of four American adults obtained their first work experience in a restaurant (NRA, 2009).
  • 4. Author's personal copy 804 M. Bendick Jr. et al. / The Social Science Journal 47 (2010) 802–818 Table 1 Characteristics of Front of the House Manhattan Restaurant employees, 2000, by annual earnings. Characteristic (a) (b) (c) Earnings < $40,000 per year Earnings > $40,000 per year % Difference A. Employment Average hourly earnings $13.65 $28.22 106.7%*** Average work hours per week 37.6 44.7 18.9%*** Average weeks employed per year 43.6 49.7 14.0%*** B. Demographic characteristics % Persons of color 59.0% 50.6% −14.2%*** % Female 40.2% 18.1% −55.0%*** % Not U.S. citizen 37.2% 23.9% −35.8%*** C. Qualifications Years of working age (16+) 16.6 26.3 58.4%*** Has education beyond high school 51.4% 60.2% 17.1%*** Speaks English natively, very well, or well 42.8% 48.7% 13.9%*** Not currently a student 81.9% 94.1% 14.9%*** D. Job titles First-level supervisors 5.4% 4.1% −24.1%*** Waiters/waitreses 62.0% 44.8% −27.7%*** Hosts/hostesses/maitre d’s 5.5% 26.5% 381.8%*** Bartenders 16.0% 19.6% 22.5%*** Bussers 11.1% 5.0% −55.0%*** Source: averages for 1125 persons employed at least 25 h per week in front of the house positions in Manhattan restaurants, 2000 Census. ∗∗∗ p < .001. Although restaurants offer large numbers of entry-level jobs, those positions typically pro- vide low wages, few fringe benefits, little job security, and sometimes employee abuse ranging from violations of wages and hours laws to racial or sexual harassment (Brennan Center, 2006; Jayaraman, 2005; ROC-NY, 2005). For many students, actors, or persons between “career” jobs, restaurants provide short-term income from work unrelated to their eventual careers, and these disadvantages have only short-term consequences. But many other workers find transi- tioning to better jobs in other industries difficult, especially for those with limited education, personal contact networks, or command of English, or in whose native cultures restaurant jobs are commonly viewed as a career. Among these workers, aspirations for middle class employment tend to focus on better jobs in the restaurant industry itself. These better jobs are limited in number, and competition is fierce. In 2000, only about 10% of “front of the house”4 employees in Manhattan restaurants earned $40,000 or more per year. In this paper, we use this figure – $40,000 in 2000, corresponding to about $50,000 in 2010 after adjusting for changes in the Consumer Price Index – as the minimum annual earnings representing “middle class” employment in the high-cost New York City area. InSectionAofTable1,datafromthe2000U.S.Censusdemonstratesthedivergenteconomic circumstances of restaurant employees above and below this threshold. Those earning above that figure had an average hourly wage of $28.22, more than double the $13.65 for those below the cutoff, and worked an average of 18.9% more hours per week and 14.0% more weeks per
  • 5. Author's personal copy M. Bendick Jr. et al. / The Social Science Journal 47 (2010) 802–818 805 year. They were also more likely to receive employer-provided health insurance and pensions, and enjoyed more occupational prestige. When well-compensated and poorly compensated jobs persist side-by-side in the same industry with limited worker mobility between the two, the pattern is sometimes labeled a “segmented” or “dual” labor market (Dickens & Lang, 1985; Leontaridi, 1998). The majority of eating establishments in Manhattan are fast food outlets, coffee shops, delicatessens, and small neighborhood restaurants; 81.5% have fewer than 20 employees (U.S. Census, 1997). In contrast, the majority of better-paid jobs are in “fine dining” restaurants with upscale prices, high-income and expense-account customers, and reputations for celebrity chefs and glamorous style. To create a sampling frame of employers for this study, we listed all restaurants in Manhattan appearing on any of six widely recognized lists of top New York City restaurants,5 and the resulting list encompassed 327 establishments. 3. Census evidence of employment discrimination Casual observation of the dining rooms of Manhattan restaurants suggests that the more “elite” the establishment, the fewer employees of color. The most dramatic differences are observable among higher level staff, such as servers, bartenders, and supervisors, although it sometimes encompasses serving assistants such as food runners and table bussers. Consistent with such observations, 2000 Census data in Section B of Table 1 shows that front of the house employees earning more than $40,000 per year in 2000 were 14.2% less likely to be persons of color and 35.8% less likely to be U.S. citizens than their lesser-paid counterparts. They were also 55.0% less likely to be female. Do race, national origin, and gender discrimination underlie these disparities? Before con- cluding so, we must take account of employee qualifications. Economists define discrimination as valuation in the labor market of workers’ characteristics, such as race and gender, not related to their on-the-job productivity (Arrow, 1998). Section C of Table 1 shows that front of the house restaurant employees in Manhattan making more than $40,000 differ from their lower- paid counterparts by offering 58.4% more work experience, 17.1% more education, and 13.9% more English language skills—qualifications arguably related to employees’ ability to perform theirjobs.Suchdifferencesneedtobecontrolledforbeforeascribingdifferencesinlabormarket outcomes to employers’ discriminatory behavior. We do so in Table 2 by applying multiple regression analysis to 2000 Census data on Manhattan front of the house restaurant employees. According to Column (a) of Table 2, after controlling for workers’ education, work experience, and command of English, the adverse effect of being a person of color on annual earnings is $2895 (11.6% of the $24,910 average annual earnings in this sample). The parallel adverse effect of not being a US citizen is $2405 (9.7%) and of being female is $5430 (21.8%). Comparison of Columns (b) and (c) of Table 2 suggests that employers’ valuation of employee qualifications is one important mechanism generating Column (a)’s overall $2895 reduction in annual earnings for race-ethnic minority employees. For example, white employ- ees with education beyond high school earn an average of $4203 more than their counterparts with less education, but among persons of color, the same additional education is associated
  • 6. Author's personal copy 806 M. Bendick Jr. et al. / The Social Science Journal 47 (2010) 802–818 Table 2 Effect of employee characteristics on annual earnings of Front of the House Manhattan Restaurant employees, 2000, by race-ethnicity. Characteristic (a) (b) (c) (d) All employees White non-Hispanic employees Employees of color % Difference between Col. (b) and Col. (c) A. Qualifications Has education beyond high school $3200** $4203* $3031* 27.9% Years of working age (16+) $962*** $1153*** $885*** 23.2% Currently a student −$619 $1165 −$1693 245.3% Speaks English natively, very well, or well $5341*** $5936 $5820*** 2.0% B. Demographic characteristics Is non-white −$2895*** – – – Is female −$5430*** −$4508** −$5795*** −28.5% Is not a US citizen −$2405 −$690 −$2782* −303.2% Source: multiple regression analysis of 1125 persons employed at least 25 h per week in front of the house positions in Manhattan restaurants, 2000 Census. In addition to the variables reported in the table, the regression model included years of working age squared and an intercept. For Column (a), adjusted r-squared = .18, F = 32.2. ∗ p < .05 ∗∗ p < .01 ∗∗∗ p < .001. with an earnings increase of only $3031, 27.9% less. Similarly, for whites, an additional year of working age (a proxy for work experience) is associated with $1153 higher annual earnings, but for a person of color, only $885 per year, 23.2% less. Being female reduces annual earnings $4508 for whites but $5795 for persons of color, 28.5% more; and being a non-citizen reduces earnings by $690 for whites but $2782 for persons of color, 30.3% more. Occupational segregation, defined as differing rates of representation of race-ethnic groups in different job titles, is one important mechanism generating these race-ethnic earnings dif- ferences. According to 2000 Census data covering Manhattan restaurants of all types, 80.1% of food runners were persons of color, in contrast to 62.3% of waiter/waitresses and 50.9% of supervisors. However, the data in Section D of Table 1 suggest that occupational segregation only explains part of earnings differences among racial-ethnic groups. There, we observe that persons holding job titles such as waiter or supervisors may earn either above or below $40,000 per year, implying that, among persons holding the same job title, the type of establishment in which a person works also affects earnings. This pattern, in turn, suggests that a particularly likely venue in which to observe racial employment discrimination is upscale, fine dining establishments, where earnings – especially via tips6 – are typically highest. If the majority of better-paid restaurant positions are in fine dining establishments, exclusion of immigrants and persons of color from this sub-sector would deprive them of their most likely opportunity for living-wage employment in the industry.
  • 7. Author's personal copy M. Bendick Jr. et al. / The Social Science Journal 47 (2010) 802–818 807 This reasoning for focusing on the fine dining sub-sector of the restaurant industry is rein- forced by historic patterns in which white, male waiters have long been employed in these establishments as one aspect of product differentiation justifying high prices (Bailey, 1982). This discrimination assumes that restaurant customers are willing to pay more to be served by non-minority men (Becker, 1971). Consistent with that assumption, Lynn et al. (2008) reports that, after holding service quality constant, African American waitpersons’ tips averaged 18% less than comparable white servers. 4. Paired-comparison testing The most direct way to test the hypothesis of employer discrimination is to observe those employers making employment decisions when they are not aware of being observed. However, in making such observations we still need to control for differences in employee qualifications. A research technique that allows to do so is matched pair testing (Bendick, 1999, 2007). Matched pair testing is a systematic research procedure creating quasi-experiments in which to observe employers’ candid responses to employees’ personal characteristics. In this proce- dure, pairs of research assistants (“testers”) apply simultaneously for the same actual job vacancy. Within each tester pair, employee characteristics likely to be related to employee productivity are controlled by selecting, training, and credentialing testers to appear equally qualified for the positions they seek. Simultaneously, personal characteristics unrelated to job performance are experimentally manipulated by pairing testers who differ in one personal characteristic, such as race. If testers within a pair experience substantially different responses to their job-seeking efforts, few assumptions and little analysis are required to interpret that difference as the employer’s reaction to that characteristic. Since 1990, several dozen well-documented testing studies have been completed for a range of locations (e.g., Boston, Chicago, Milwaukee, New York, San Francisco, Washington, nation- wide), occupations (e.g., sales workers, office/clerical employees, management trainees), and demographic groups (e.g., African Americans or Hispanics paired with whites, holders of “green card” work permits paired with native-born U.S. citizens, women paired with men, or 57 year olds paired with 32 year olds). In testing studies examining all stages of the hir- ing process and pairing race-ethnic minorities with whites, the proportion of tests in which minority job seekers were treated substantially less favorably than their equally qualified white testing partners has typically averaged between 20% and 25% (Bendick, 1999, 2007). Thus, the consensus in this research is that significant discrimination against race-ethnic minorities continues to operate throughout the US labor market. Such findings provide the principal ethical justification for matched pair testing. Testing studies involve employers without their informed consent and induce them to use staff time to process a job application which will not result in a hire. However, in typical testing situations, that use of resources is very modest, since most applicants are rejected quickly. Employers are not asked to deal with situations that are unusual for them; in fact, human resource management professionals widely believe that at least one-third of non-tester job applicants fabricate some aspects of their resumes (HR, 2001). And when testing results are released without identifying the employers tested, individual hiring decision-makers and their companies are protected
  • 8. Author's personal copy 808 M. Bendick Jr. et al. / The Social Science Journal 47 (2010) 802–818 from adverse consequences. Balanced against these small costs is the over-riding importance of addressing the social scourge of discrimination. The U.S. Supreme Court, the U.S. Equal Employment Opportunity Commission, and university human subjects review panels have all endorsed testing’s role in these efforts (Bendick & Nunes, in press; Riach & Rich, 2004; Boggs, Sellers & Bendick, 1993). 5. Our testing methods Some of the testing studies described in the previous section included restaurant jobs as part of their sample but not in sufficient numbers to be analyzed separately. Prior to the present research, only one study focused specifically on restaurants. Neumark (1996) found that female testers had a 40% lower probability than equally qualified males of being offered server jobs in high-price Philadelphia restaurants. ApplyingthepairedtestingmethodstoupscaleManhattanrestaurants,werecruited37testers from among restaurant employees and college students in the New York area, all eligible to work in the U.S. as citizens or holders of “green card” work permits. We formed two-person teams consisting of persons of the same gender and similar age, appearance and manner. The two members of each team differed from each other in race-ethnicity (a white paired with a Black, Hispanic, Asian, or Middle Eastern tester), accent (a person with no accent paired with a person with a slight accent), or both. Prior to conducting tests, testers received training lasting at least eight hours. They were coached on effective job application techniques, appropriate interview dress, and standard answers to questions typically asked in server job interviews. They practiced completing job applications, being interviewed, and objectively recording their job-seeking experiences. Resumes were developed for each tester ascribing to the members of each tester team equivalent education (e.g., 2 years of college in institutions of similar reputation), restaurant experience (e.g., 4 years as a server or service assistant in similar restaurants), other work history, and eligibility to work in the U.S. (all resumes showed the testers as U.S. citizens). Team member’s similarity in behavior and answers to questions were enhanced by training teams together and having them observe each others’ practice interviews. Between January 2006 and June 2007, testers completed 138 tests on restaurants from the sampling frame of 327 described in footnote 5. One-third these tests responded to an adver- tisement for serving staff posted on www.craigslist.com, and the others were selected using random numbers from the remaining restaurants on the list. A test was considered complete if both testers made sufficient contact with the employer to reveal their race-ethnicity and express their desire to be hired. No employer appeared to suspect that any tester was not a bona fide job applicant. Testers alternated which member of the team contacted the employer first, with an average of 37 minbetweenthem.Whenatester’sapplicationprocessincludedaninterview,morethan90% of the interviews were held during the applicant’s initial trip to the restaurant. Immediately after completing an interaction with an employer and without speaking with their testing partner, testers recorded their experiences on a structured questionnaire. All phases of testers’ activities were closely supervised by an attorney with restaurant work experience.
  • 9. Author's personal copy M. Bendick Jr. et al. / The Social Science Journal 47 (2010) 802–818 809 Table 3 Outcomes experienced by testers applying for waiter/waitress positions in upscale Manhattan restaurants, by race/ethnicity. Outcome (a) (b) (c) (d) (e) (f) White testers Testers of color White testers–testers of color Number % Number % Number % A. Among 43 tests (1) Tester was granted a job interview 35 81.4% 26 60.5% 9 20.9%* B. Among 35 interviews for whites and 26 interviews for people of color (2) Interview ended with no indication about a job offer 18 51.4% 16 61.5% 2 −10.1% (3) Interviewed ended with strong implication a job would be offered 6 17.1% 5 19.2% 1 −2.1% (4) Interview ended with a job offer or offer was received later 11 31.4% 5 19.2% 6 12.2% (5) % Difference (Whites–people of color) from pre-interview + interview stages a 30.8% ** Source: 43 paired-comparison hiring tests in upscale Manhattan restaurants, 2006–2007. a Column (f) in Row (1) + .814 × Column (f) in row (4), because interviews occurred in 81.4% of tests. ∗ p < .05. ∗∗ p < .01. 6. Testing estimates of discrimination Using this method, we completed 43 tests which directly examined the hypothesis of race- ethnic discrimination in hiring. In these tests, the testing pair consisted of a white with a person of color, and at least one tester received some positive response such as an interview—an outcome suggesting that the employer had a vacancy to fill and that the employer found the testers plausible job candidates. One summary statistic for test outcomes is the “net rate of discrimination,” defined as the proportion of tests in which the white tester achieved a favorable employment outcome (e.g., a job interview) minus the proportion of tests in which the minority tester achieved that out- come. This subtraction takes account of random circumstances which may affect employment outcomes, such as that only a single job is vacant so that even non-discriminating employers could only hire one applicant. It also takes account of possible “reverse discrimination,” in which employers favor persons of color over whites. Table 3 divides the outcome of job applications into two broad categories: whether testers were granted an interview and whether testers who were interviewed received a job offer. According to the row (1) of table, in 43 tests, 81.4% of white testers were granted an interview, compared to 60.5% for testers of color, for a net rate of discrimination at that stage of 20.9%. According to row (4), among testers who were interviewed, 31.4% of white testers received a job offer, compared to 19.2% of testers of color, for a net rate of discrimination at that stage of 12.2%. Row (5) of the table combines these rates, weighting the former at 100% (because all completed tests allowed observation of outcomes at that stage) and the latter at 81.4% (because interviews occurred in only 81.4% of tests). The sum of the two adverse effects, reported in
  • 10. Author's personal copy 810 M. Bendick Jr. et al. / The Social Science Journal 47 (2010) 802–818 row (5) as 30.8%, is therefore the overall net rate of discrimination adverse to testers of color. Since each employer was tested only once, this result can equivalently be stated as: testers of color experienced discrimination in seeking waiter/waitress employment from 30.8% of upscale Manhattan restaurants. Another important summary measure of the prevalence of discrimination divides the number of minority testers achieving an employment outcome by the number of their equally qualified white testing partners achieving similar success. According to Table 3, in 43 completed tests, 6 testers of color and 11 white testers and received job offers, a ratio of 54.5%. That is, testers of color were only 54.5% as likely as equally qualified white testers to achieve that outcome.7 The following examples illustrate test outcomes scored as outcomes in which the white tester was favored: • Not allowed to apply. At 2 pm on a weekday, an African American man with no accent visited a well-established Midtown seafood restaurant seeking employment as a waiter. A restaurant employee told him that there were no current vacancies and refused to take his resume. Thirty minutes later, a white American man with no accent spoke to the same restaurant employee. The employee stated that there were no current openings but that she would retain his resume and call if anything opened up. Three months later, the tester received a call and was offered a waiter position. • Not allowed to interview: On a weekday afternoon, a white woman with a slight French accent entered a fashionable “three star” restaurant seeking employment. After she com- pleted a job application, a manager took her into a private room for a 20 min interview. Checking that he was not being observed, the manager corrected spelling errors on her application and suggested ways to rephrase her answers to interview questions. He asked no questions about her work experience or restaurant service skills. He stated that she would be hearing from them in a few days, and she subsequently received a call offering a server position. One hour later, a Korean American woman with no accent entered the same establishment seeking work. After completing an application showing education and work experience equal to that of the previous tester, she handed the form to the bartender, who said that he would give it to the manager. She was never contacted. • Notofferedaposition:Onaweekdayafternoon,awhitewomanwithnoaccentarrivedatan “atmospheric” Midtown restaurant in response to a Craigslist advertisement for waitstaff. Twominuteslater,aHaitianAmericanwomanwithnoaccentarrivedforthesamepurpose. They were interviewed by different assistant managers. The second woman’s interview was held in a busy location and lasted five minutes. She was told that she would be contacted if the restaurant was interested, but she never heard further. The first woman’s interview, in a private location, lasted 20 min. The interviewer read her resume carefully, asked questions about her experience, and requested her to come for training the following week. • Qualifications questioned: Answering a Craigslist advertisement, a white woman with no accent applied at an upscale Italian restaurant. When she first walked in, the host looked her over slowly, making her feel she already had the job. She was promptly sent to an assistant manager, who, during an 18 min interview, called her resume impressive, said that she presented herself well and that she’d “fit right in,” and offered her specific work
  • 11. Author's personal copy M. Bendick Jr. et al. / The Social Science Journal 47 (2010) 802–818 811 shifts. He emphasized that she would have opportunities to advance into management and that the restaurant would pay part of her health insurance. At the end of the interview, he said that if she would provide a reference, she could start training that day. Meanwhile, a Chinese American woman with no accent, who had arrived half an hour before the white woman, was sent away with an interview appointment for the following day. During that interview, which lasted nine minutes, the same manager who had interviewed the white woman denied ever hearing of the restaurants on her resume and questioned whether she had worked in elegant establishments. He concluded by saying that he would call her after consulting with other managers, but he never did. In these examples, race/ethnicity is clearly the trigger for the discriminatory treatment our testers of color encountered. Therefore, the most direct interpretation is that the source of the discrimination is employers’ reaction to the testers’ race/ethnicity per se. For example, in their “statistical discrimination” model, economists hypothesize that employers discrimi- nate by erroneously using the average productivity of their race/ethnic group as a measure of individual applicants’ likely on-the-job productivity (Ehrenberg & Smith, 2008, chapter 12). Similarly, social psychologists hypothesize that employers discriminate when stereotypes about applicants’ race/ethnic group distort the employers’ assessments of applicants’ individual qualifications (Bendick & Nunes, in press). However, other interpretations suggest more complex relationships between applicants’ race/ethnicity and employers’ adverse reactions. For instance, Bourdieu (1984) emphasizes that restaurants are a venue in which many aspects of class distinctions and “taste” are worked out. In that circumstance, restaurant employers might reject job applicants of color not because the employer expects their job performance to be inferior but because their race/ethnicity would be inconsistent with an atmosphere of upper-class exclusivity the restaurant offers its customers. Another interpretation emphasizes efforts by white male employees to maintain “social closure” – that is, to preserve their “in-group” privilege and social comfort – against any “out-groups” seeking their scarce, well-paid jobs (Bendick & Nunes, in press; Murray, 1988). In that circumstance, our minority testers’ race/ethnicity might cause them to be rejected not because of their race/ethnicity per se but because of the mismatch between these characteristics and those of the dominant in-group. The testing results presented in this article were not structured to differentiate rigorously among these alternative interpretations.8 However, the next section provides some insights by examining the interactions between testers and the employers who interviewed them. 7. Micro-inequities in treatment of applicants Does the 31% net rate of hiring discrimination mean that the remaining 69% of upscale Manhattan restaurants are discrimination-free? Theoretical reasoning and empirical evidence do not support that interpretation. Employers who hire both whites and persons of color may still treat them differently after hiring. For example, white restaurant servers might be offered more work shifts per week, shifts or tables where “big tippers” are prevalent, or opportunities to advance to supervisory or management positions. Such differences often reflect employers’
  • 12. Author's personal copy 812 M. Bendick Jr. et al. / The Social Science Journal 47 (2010) 802–818 stereotypical assumptions, conscious or unconscious, that, although both whites and persons of color may be minimally qualified for waiter/waitress positions, whites are more competent (Fiske & Lee, 2008; Greenwald & Krieger, 2006). These assumptions may in turn generate constant “micro-inequities” in daily work life that cumulatively generate substantially differ- ent earnings, work environments, and career paths for employees of different demographic backgrounds (Valian, 1999). Suggestions of race-ethnic differences in post-hiring treatment are provided by the earn- ing differences and occupational segregation documented in Census data in Section 3 above. However, these data do not compare treatment of different types of employees by the same employer, the comparison presented in Table 4. Focusing first on employers’ stereotypical assumptions about employees’ competence, the first two rows of Section C of Table 4 report that employers interviewing testers often accepted white testers’ claims of work experience and food service skills without question while probing or challenging equivalent credentials presented by testers of color. The next three rows of Section C report that interviewers also tended to describe the available job more favorably to white testers, offer them better work days or shifts than testers of color, or otherwise promise better jobs. Table 4 also demonstrates that such differences in employment outcome generally co-existed with no differences in the politeness with white testers and testers of color were treated during the hiring process. As two job seekers among dozens or even hundreds of applicants screened by sought-after employers, our testers were sometimes treated impersonally or abruptly. However, testers of color were not treated worse than their white testing partners. Most employers today are aware that race-ethnic discrimination is illegal, as well as generally socially unacceptable. Consistent with findings from testing studies in a range of industries and occupations (Bendick, 1999, 2007), our restaurant testers essentially never encountered blatant discrimination or disrespect, racial-ethnic epithets, or even explicit acknowledgement of their race-ethnicity.9 Section A of Table 4 presents six measures of the politeness with which testers were treated, and among them there is no consistent pattern of more favorable treatment for white testers than their minority testing partners. This equality of treatment in Section A of the table contrasts sharply with Section C’s seven measures of employment outcomes, on which minority testers consistently experienced less success than their white partners. It also contrasts with the 11 indicators in Section B which measure the apparent seriousness with which testers’ applications were treated prior to decisions about their application. According to Section B, white testers were not only more likely to be interviewed than their minority testing partners but to receive longer, more focused, and more informative interviews. The combination of equal politeness and unequal seriousness suggests that some employers may seek to appear non-discriminatory by “going through the motions” of interviewing race-ethnic minority applicants. It may also suggest that, reflecting unconscious stereotypes, interviewers may make up their minds early in an interview in favor of white candidates or against minority ones (Fiske & Lee, 2008). By influencing the length and depth of the interviews themselves, those early predispositions become self-fulfilling prophecies. For workers born outside the U.S., a particularly salient issue involves employers’ willing- ness to hire workers speaking English with an accent. Research on U.S. employers in a range
  • 13. Author's personal copy M. Bendick Jr. et al. / The Social Science Journal 47 (2010) 802–818 813 Table 4 Treatment of testers applying for waiter/waitress positions in upscale Manhattan restaurants, by race/ethnicity. Measure White testers Testers of color % Difference (“−” means Whites favored) A. How politely was applicant treated? Average minutes waiting to be interviewed 8.2 10.3 −25.6% Employer friendliness during initial contact (scale of +2 = very friendly, −2 = very unfriendly) 0.2 0.1 −2.6% Employer friendliness during job interview (scale of +2 = very friendly to −2 = very unfriendly) 0.7 0.7 1.2% Interviewer introduced self to applicant 60.7% 70.0% 15.3% Interviewer shook applicant’s hand 85.7% 74.2% −13.4% Interviewer used applicant’s name 42.9% 55.8% 30.1% % of 6 measures on which whites were favored 50.0% Average % difference 0.8% B. How Seriously was Applicant Considered? Applicant was granted an interview 81.4% 60.5% −25.7% Interview was conducted by a manager, not a subordinate 100.0% 100.0% 0.0% Interview was held in quiet place without interruptions 82.1% 77.4% −5.7% Average length of interview (min) 11.1 9.2 −17.1% Interviewer looked carefully at applicant’s resume 39.3% 32.3% −17.8% Interviewer provided substantial information about job duties 40.7% 16.7% −59.0% Interviewer provided substantial information about potential earnings 44.0% 29.0% −34.1% Interviewer volunteered key information without being asked 74.1% 59.3% −20.0% % of interview devoted to job requirements and applicant qualifications 97.0% 83.3% −14.1% Interviewer suggested additional vacancies for the applicant to consider 10.7% 12.5% 16.8% At end of interview, interviewer volunteered information on next steps 81.2% 62.9% −22.5% % of 11 measures on which whites favored 72.7%*** Average % difference −18.1% C. What are Likely Employment Outcomes? Applicant’s work experience was accepted without probing 40.7% 20.7% −49.1% Applicant’s food/wine/table service knowledge was accepted without probing 75.9% 66.6% −12.3% Job was described more favorably to this applicant than to testing partner 27.8% 11.1% −60.1% Days or shifts discussed were better than those for testing partner 44.0% 0.0% −100.0% Where both applicants received offers, this applicant’s offer was better 25.0% 0.0% −100.0% Interviewee was offered a job or signaled an offer would be forthcoming 48.6% 38.5% −20.8% Interview closed with friendly, positive, or “welcome aboard” comments 67.9% 48.4% −28.7% % of 7 measures on which white were favored 100.0%*** Average % difference −53.0% Source: 43 hiring tests in upscale Manhattan restaurants, 2006–2007. ∗∗∗ In a sign test, different from .5 at < .01.
  • 14. Author's personal copy 814 M. Bendick Jr. et al. / The Social Science Journal 47 (2010) 802–818 of occupations and industries concludes that they often reject minority employees not explic- itly on their race-ethnicity but for the more socially acceptable reason that, in the employers’ perceptions, they lack the “soft skills” to perform the job (Moss & Tilly, 2001). For restaurant server positions, “soft skills” would include reliability in attendance, teamwork with super- visors and fellow workers, and articulateness. The label differentiates these skills from “hard skills” involving technical knowledge and techniques specific to an occupation—in the case of servers in fine dining, these might include knowledge of food-wine pairings or specific cuisines. The present testing study allows us to examine the soft skill of “articulateness” in more depth. In our tests, job applicant’s actual articulateness was controlled by employing only white and minority testers who were all fully articulate in English. However, within our sample of completed tests, 24 paired whites without accents and whites with a slight accent (mostly French), and 8 tests paired testers of color without accent to testers of color with accents (French, Spanish, or Asian). To the extent that accents increased job-seeking suc- cess among white testers but had a different effect among testers of color, then employers’ rejection of testers of color with accents might be interpreted as discrimination based on race/ethnicity or social class consciously or unconsciously disguised as a concern about articulateness. Did the employers we tested appear to view white job applicants’ accents as “charming” but equal accents by persons of color as “difficult for customers to understand?” Consistent with the hypothesis that accents were a plus factor for whites, in 37.5% of the white–white tests, white testers with accents were favored over their white partners without accents, while the reverse was true in 14.4% of tests, for a net rate of increased success of 23.1%; this difference is sta- tistically significant at p < .001. No such positive effect was observed in the minority–minority tests, where no statistically significant difference was observed in the application success of testers with and without accents. The implications of the findings presented in this section are important. Because our testing- based 30.8% net rate of discrimination is computed from only the most visible, substantial differences in hiring, it imperfectly captures multiple additional ways in which discrimi- nation potentially affects restaurant employees. The 69% of upscale Manhattan restaurants where testing did not document race-ethnic differences in hiring should not be assumed to be discrimination-free.10 8. The impact of changing employment practices The empirical findings in this paper support the conclusion that substantial social stratifi- cation adverse to racial minorities continues within the restaurant industry and that restaurant industry managers are key organizational actors maintaining that stratification. Enhanced enforcementofequalopportunitylawsandadoptionbyrestaurantsoftransparent,performance- based human resource management practices (Bielby, 2008) could help to lessen such racial employment inequality. Testing studies modeled after the present study might use- fully contribute toward motivating and implementing both types of actions (Bendick, 1999, 2007).
  • 15. Author's personal copy M. Bendick Jr. et al. / The Social Science Journal 47 (2010) 802–818 815 Table 5 Quality of Front of the House Jobs Manhattan Restaurants held by persons of color, 2007, by type of restaurant and work role. (a) (b) (c) (d) Indicator of job quality Server and Supervisor Positions in Fine Dining Restaurants Other Front of the House Positions in Fine Dining Restaurants Front of the House Positions in Fast Food and Casual Dining Restaurants (1) I earn > $31,000/year. 70.7% 33.3%*** 14.3%*** (2) I feel free from the risk of getting hurt. 81.8% 84.9% 88.4% (3) My job requires me to learn new skills. 67.2% 58.5% 56.3%* (4) I do not experience abuse or discrimination. 66.7% 66.0% 70.9% (5) I get health insurance. 41.5% 58.0%* 33.2% (6) I am paid time and a half over 40 h/week. 25.5% 36.8% 18.9% (7) I get a paid break after 4 work hours. 18.2% 28.3% 34.8%** (8) I get paid vacation days. 18.2% 30.2% 15.4% (9) I have some say in workplace decisions. 15.4% 21.2% 15.5% (10) I get paid sick days. 12.1% 15.1% 8.2% Source: authors’ tabulation from survey of 426 employees of New York City restaurants, 2007 (Jayaraman et al., 2009). ∗ p < .05 for difference from column (b). ∗∗ p < .01 for difference from column (b). ∗∗∗ p < .001 for difference from column (b). The most direct beneficiaries of reduced discrimination in upscale Manhattan restaurants would be those workers of color who would be hired there. Our sampling frame of fine din- ing establishments in Manhattan encompassed 327 establishments. Assuming that each of these establishments employs an average of 35 workers in front of the house positions paying $50,000 or more in 2010, there are 11,500 such positions in the Manhattan fine dining industry. Assuming than 30.1% of these jobs have been closed to persons of color, the potential effect of eliminating that hiring discrimination would be 3500 more persons of color employed there. Although such an increase would be substantial, it should be kept in perspective. As noted in Section 2, more than 123,000 persons work in the Manhattan restaurant industry, among whom 68.7% – 84,500 workers – are persons of color (U.S. Census 2000). Opening 3500 well-paid positions in fine dining restaurants would directly improve employment for 4.1% of those 84,500. For the remaining 95.9% of Manhattan restaurant workers or color, as well as their white counterparts, the principal path to “middle class” employment would be improved compensation and working conditions in their current positions. How good are those current positions? Table 5 presents data from a 2007 survey of restaurant workers of color in New York City restaurants (Jayaraman et al., 2009). The table compares positions as servers and supervisors in fine dining establishments – approximately the jobs examined in our matched pair tests – to “lower ranked” front of the house positions in fine dining establishments (e.g., table bussers and food runners), as well as all front of the house workers in “casual dining” or “fast food” restaurants. Consistent with findings earlier in this paper, the first row of the table reports that supervisors and servers in fine dining establishments have significantly higher earnings than the other two groups of workers. However, according to
  • 16. Author's personal copy 816 M. Bendick Jr. et al. / The Social Science Journal 47 (2010) 802–818 Column (b) of the table, fewer than half of supervisor and servers in fine dining establishments receive health insurance, overtime pay, work breaks, vacation days, sick pay, or substantial voice in workplace decisions. Indeed, according to columns (c) and (d) of the table, on such measures of job quality, supervisor and server positions in fine dining are not consistently superior to front of the house jobs in casual dining or fast food establishments, or to “lower ranked” positions (such as table bussers) in fine dining. The point here is that middle class employment requires not just equal opportunity but equal opportunity – that is, not only access to jobs but jobs of good quality. The positions for which we documented race-ethnic discrimination in hiring – server position in fine dining establishments—are certainly preferable to other positions in the industry but not consistently high quality as measured by a number of indicators. Upgrading working conditions across the board in the restaurant industry may be as important as expanding equal employment opportunity in improving the work lives of Manhattan’s – and the nation’s – restaurant workers. Notes 3. Throughout this paper, “white” is shorthand for the 2000 Census category of white non-Hispanics, and “persons of color” refer to the Census categories of African Ameri- cans/Blacks,Hispanics/Latinos,Asians,AmericanIndians,NativeHawaiiansandPacific Islanders, and mixed races. 4. A restaurant’s “front of the house” is the dining area, where waiters/waitresses, host/hostesses, bartenders, cocktail servers, table bussers, food runners, and their super- visors work. “Back of the house” (kitchen) employment is not examined in this study, but it is in ROC-NY (2005). 5. Our sampling frame consisted of establishments in any of 25 well-known “mini-empires” of high-reputation restaurants; in Restaurants and Institutions’ top 100 restaurants by sales or 75 top multi-concept operators; in Zagat (2006)’s “Most Popular” or “Top 50” for service, décor, or food; in Zagat (2006) and participating in New York Restaurant Week 2006; or in Platt (2005) or Platt (2006). 6. In auditing the earnings of restaurant employees, the Internal Revenue Service assumes that tips total 8% of restaurant revenues (IRS, 1990). Thus, if restaurants employ similar numbers of employees per customer, higher-priced meals translate directly into greater tip income for servers. 7. In 2000 Census data, among persons of color employed as waitstaff in Manhattan restau- rants, 5.4% earned at least $40,000, while among their white peers, the corresponding proportion was 7.7%. Dividing 5.4 × 7.7 yields a rate of achieving this favorable employ- ment outcome 70.0% as high for persons of color as for whites. By being roughly consistent with 54.5%, 70.0% confirms the reasonableness of the testing-based esti- mate. The difference between 70.0% and 54.5% suggests lower turnover among workers of color who succeed on obtaining such well-paid positions than among their white co-workers. 8. Bendick and Nunes (in press) describes matched pair testing studies designed to tests these alternative hypotheses.
  • 17. Author's personal copy M. Bendick Jr. et al. / The Social Science Journal 47 (2010) 802–818 817 9. However, non-testing evidence reminds us that blatant racism still occurs in some restau- rants; see, for example, Adamson (2000), Feagin and Sykes (1994), and Watkins (1997). 10. Because our study never paired male and female testers, it does not directly address gender discrimination. However, the Census data in Section 3, as well as other studies cited throughout this paper, suggest that this form of discrimination is also prevalent in upscale restaurants. Acknowledgement The authors gratefully acknowledge financial support from the Ford Foundation and insight- ful comments by an anonymous Social Science Journal referee. References Adamson, J. (2000). The Denny’s story, how a company in crisis resurrected its good name. John Wiley. Alger, H., Jr. (2007). Ragged Dick. W.W. Norton. Arrow, K. (1998). What has economics to say about racial discrimination? Journal of Economic Perspectives, 12, 91–100. Bailey, T. (1982). Immigrant and native-born workers in the restaurant industry. Columbia University Conservation of Human Resources. Becker, G. (1971). The economics of discrimination. University of Chicago Press. Bielby, W. (2008). Promoting racial diversity at work, Challenges and solutions. In A. Brief (Ed.), Diversity at work (pp. 53–88). Cambridge University Press. Bendick, M., Jr. (1999). Adding testing to the nation’s portfolio of information on employment discrimination. In M. Fix, & M. Turner (Eds.), A national report card on discrimination in America: The role of testing (pp. 47–86). The Urban Institute Press. Bendick, M., Jr. (2007). Situation testing for employment discrimination in the United States of America. Horizons Strategiques, 5, 17–39. Bendick, Jr., M., & Nunes, A. (in press). Developing the research basis for controlling bias in hiring. Journal of Social Issues. Boggs, R., Sellers, J., & Bendick, M., Jr. (1993). Use of testing in civil rights enforcement. In M. Fix, & R. Struyk (Eds.), Clear and convincing evidence, Measurement of discrimination in America (pp. 345–376). The Urban Institute Press. Bourdieu, P. (1984). Distinction, A social critique of the judgment of taste. Cambridge: Harvard University Press. Brennan Center. (2006). Unregulated work in the restaurant Industry in New York City. In Unregulated work in the global city. Brennan Center for Justice, New York University School of Law. Denstedt, M. (2008). Precariousness on the menu, Restaurant work and labour mobility within the low-wage service industry in Kingston, Ontario. M.A. Thesis, Queens University. Dickens, W., & Lang, K. (1985). A test of the dual labor market theory. American Economic Review, 75, 792–805. Ehrenberg, R., & Smith, R. (2008). Modern labor economics. Addison-Wesley. Feagin, J., Vera, H., & Batur, P. (2001). White racism. Routledge. Feagin, J., & Sykes, M. (1994). Living with racism, The black middle class experience. Beacon Press. Fiske, S., & Lee, T. (2008). Stereotypes and prejudice create workplace discrimination. In A. Brief (Ed.), Diversity at work (pp. 13–52). Cambridge University Press. Gabriel, P. (2005). A longitudinal examination of earnings inequality and mobility among young, full-time workers in the United States. The Social Science Journal, 42, 603–607. Greenwald, A., & Krieger, L. (2006). Implicit bias, Scientific foundations. California Law Review, 94, 945–967.
  • 18. Author's personal copy 818 M. Bendick Jr. et al. / The Social Science Journal 47 (2010) 802–818 HR. (2001). Verify executive resumes early in the process. HR Magazine, (November), 14. Isaacs, J., Sawhill, I., & Haskins, R. (2008). Getting a head or losing ground, Economic mobility in America. The Brookings Institution. Iverson, R., & Armstrong, A. (2006). Jobs aren’t enough, Toward a new economic mobility for low-income families. Temple University Press. IRS. (1990). Tip income study, Research publication 1530. U.S. Internal Revenue Service Washington Research Division. Jayaraman, S. (2005). ROCing” the industry: Organizing restaurant workers in New York. In S. Jayaraman, & E. Ness (Eds.), The new urban immigrant workforce, Innovative models for labor organizing. M.E. Sharpe, pp. 112–142 Jayamaran, S., Romero-Alston, L., Dropkin, J., Siby, S., & Markowitz, S. (2009). Dangerous dining, Health and safety in the New York City Restaurant industry. Restaurant Opportunity Center of New York. Leontaridi, M. (1998). Segmented Labour markets, Theory and evidence. Journal of Economic Surveys, 12, 63–101. Lynn, M., Struman, M., Ganley, C., Adams, E., Douglas, M., & McNeal, J. (2008). Consumer racial discrimination in tipping: A replication and extension. Journal of Applied Social Psychology, 38, 1045–1060. Morales, R. (2005). Contending tradeoffs, IRCA, immigrants, and the Southern California restaurant industry. Review of Policy Research, 11, 143–151. Moss, P., & Tilly, C. (2001). Tales employers tell, Race, skills and hiring in America. Russell Sage Foundation. Murray, R. (1988). Social closure, The theory of monopolization and exclusion. Oxford University Press. NRA. (2006). State of the restaurant industry workforce: An overview. National Restaurant Association. NRA. (2009). Restaurant industry pocket factbook. National Restaurant Association. Neumark, D. (1996). Sex discrimination in restaurant hiring: An audit study. Quarterly Journal of Economics, 113, 915–941. Platt, A. (2006). The Platt 101, New York’s best restaurants. New York Magazine, (January 9). Platt, A. (2005). here to eat 2005. New York Magazine, (May 21). Riach, P., & Rich, J. (2004). Deceptive field experiments of discrimination: Are they ethical? Kyklos, 57, 457–470. ROC-NY. (2005). Behind kitchen doors, Pervasive inequality in New York City’s thriving restaurant industry. Restaurant Opportunities Center of New York. Slonaker, W., Wendt, A., & Baker, B. (2007). Employment discrimination in the restaurant industry. Cornell Hotel and Restaurant Administration Quarterly, 48, 46–58. U.S. Bureau of Labor Statistics (2008). A profile of the working poor, 2006. Report 1006. Bureau of Labor Statistics, U.S. Department of Labor. USCB. (2000). Census 2000 EEO data tool. New York County, NY: Census Bureau., at http://www.census.gov/cgi- bin/broker USCB. (2006). County business patterns. New York County, NY: Census Bureau., at http://factfinder.census.gov Valian, V. (1999). Why so slow? The progress of women. MIT Press. Watkins, S. (1997). The black O, Racism and redemption in an American corporation. University of Georgia Press. Zagat. (2006). New York City restaurants. Zagat.