3. SOCIO-ECONOMIC AND MAPPING BASELINE
SURVEY REPORT
KALOBEYEI INTEGRATED SOCIO-ECONOMIC DEVELOPMENT PROGRAMME
SUPPORTING PLANNING FOR AN INTEGRATED SETTLEMENT
IN KALOBEYEI NEW SITE, TURKANA COUNTY, KENYA
2016
5. iii
Executive Summary
The primary objective of this socio-economic baseline survey
was to generate planning-relevant social, economic and spatial
data outlining development dynamics, as well as the interests
and concerns of host community and refugee populations in
Kalobeyei and Kakuma. This was to inform the Local Advisory
Spatial Plan for Kalobeyei New Settlement, submitted in 2017
to the Turkana County Government.
The survey findings are based on a sample of 331 households
and 215 businesses in four areas: Kakuma Refugee Camp,
Kakuma host community area, Kalobeyei host community
area and the Kalobeyei New Settlement. These were
complemented by key informant interviews with the
following organizations and individuals: DRC, GIZ, LWF, IRC,
NRC, NCCK, UNHCR, WFP and Windle Trust, Kalobeyei Ward
Administrator, Kakuma Livestock Market Manager, Kalobeyei
Assistant Chief, a new site Bamba Chakula operator and
a new site refugee farmer. The team also conducted FGDs
with various groups from Kalobeyei host community (elders,
women and youth), the Kalobeyei New Site (business
operators and youth), Kakuma Refugee Camp (youth group)
and Kakuma host community (youth groups). The primary
data was collected over a period of 11 days (22nd August to
2nd September, 2016).
The survey established that the refugees were largely better
off in most developmental aspects than the host community
members. This was mainly attributed to better access to
basic services such as education, health, shelter, sanitation
and water, courtesy of various humanitarian organizations.
For example, in Kalobeyei Town 70.2% of host community
members lacked formal education, compared to 13.1% of
the refugee community. This may also explain family sizes -
the average household size in the host community was found
to be 5.5, compared to 3.5 for refugees. It was also found
that 28.6% of the host community practiced polygamous
marriage. In terms of monthly income, 73.6% of host and
60.9% of refugees earn less than 5,000 KES per month
(around $50 US). It was noted that the likelihood of residents
from the refugee and host communities to modify residential
buildings often relate to livelihood strategies - most were
transforming their living and open spaces to engage in
commercial activities, or because of the need to accommodate
an expanding family.
In terms of access to basic and infrastructural services there
was no major discrepancy, as those in the new settlement are
yet to receive all the services they need. Water was accessible
to refugees in the settlement whereas members of the host
community needed to travel long distances in search of
water. The issue of water featured much during Focus Group
Discussions (FGD) with elders and women. Improving access
to water was one of the conditions the host community
requested of the government, in exchange for land for the
new settlement. In terms of livelihoods, the host mainly relied
on their livestock and small businesses. Refugees in the new
settlement were engaged in small businesses.
The local community also enjoyed some of the basic services in
the refugee camp. Analysis showed that women from the host
community were involved in constructing family homes, and
fetching water and firewood. Men tended to keep livestock,
and were more often employed in the formal sector, as their
level of education was higher than that of women. The variety
and size of businesses in Kakuma Refugee Camp was superior
to the existing businesses located outside the camp. Many
businesses were established in Kalobeyei New Site in a short
timeframe.
Among the refugees, men tended to dominate ownership and
operations of medium and large scale businesses, whereas
women tended to be more visible in small scale business and
food-oriented enterprises, which normally operate in or near an
operator’s home. This is common practice in cottage industries.
It was also noted that more host community members came
for casual work in the camp. Cases of refugees working for
the host community were extremely rare. Schools and religious
facilities were found to play a significant role as interactive
spaces for both host and refugee communities.
The local community struggled to meet their basic needs,
resorting to survival tactics such as exchanging of firewood
for food or cash. The use of firewood as an interactive
commodity must be interrogated further, as it has a negative
impact on natural assets in the long term, since the rapidly
growing population is increasing demand for this resource. The
host community engaged in pastoralism, while the refugee
community was found to dominate in business, with some
engaged in crop farming. The major asset base for the host
community was livestock and grazing land. Refugees had
several assets including business networks that linked up to
other countries. However, the nature of activities carried
out by refugees was related to their country of origin. Most
Somalis and Ethiopians engaged in business, Burundians and
Congolese were farmers or had food related businesses, and
South Sudanese tended to be consumers and not dominant in
any specific income generating activities (IGAs).
The National and County Government of Kenya play a
significant role in provision of services and infrastructure for the
host communities. International and local organizations such
as WFP, IRC, DRC, LWF, Windle Trust, GIZ, NCCK and LOKADO,
among others coordinated by UNHCR, engage in provision of
services to refugees in a complementary manner.
Findings indicate that the involvement of host community is
vital in the sustainable growth and integration of the host and
refugee communities, since they have permanent interest in
6. Kalobeyei Socio-Economic and Mapping Baseline Survey Report, 2016iv
the area as citizens and the local community. Their involvement
will help to address possible fluctuations of refugee numbers,
which would be the result of refugees returning to their
home countries or relocating to another country (returning
or relocating are the stated aspirations and desires of many
refugees). It is expected that the host community will be
required to form the foundation of the proposed integrated
settlement. It was also noted that the development needs of
the host community and humanitarian needs of the refugee
community had some similarities. Identified in both areas were
basic needs (water, education and, in some cases, food) and
livelihoods (employment and income generating activities).
The only concern was that members of the host community
favoured livestock as a source of livelihoods, while the refugees
tended to prefer businesses since stock could be sold quickly if
they were required to return to their country.
The survey recommends that any effort to integrate the host
and refugee communities should focus on both communities:
• Important focus areas for the host community are:
improving livelihoods, employment and scholarship
linkages and networks, and access to basic services.
• Important focus areas for the refugee community are:
addressing security concerns and supporting refugees to
engage in commercial enterprises including farming.
Achievement of the desired integration between the host and
refugees is critical. This will require renewed goodwill and
collaborative efforts by the Kenya Government and County
Government of Turkana, and the collaboration of international
and local organizations.
7. v
List of Figures
Figure 1: Study Area Scope ......................................................................................................................................................3
Figure 2: Kakuma Analytical Scope..........................................................................................................................................16
Figure 3: Kakuma and Kalobeyei Regional location .................................................................................................................17
Figure 4: Distribution of health facilities in Kakuma Refugee Camp (excluding alternative healthcare)......................................24
Figure 5: Accessibility of health facilities in Kakuma Refugee Camp ........................................................................................25
Figure 6: Distribution of health facilities in Kakuma host community areas..............................................................................26
Figure 7: Comparative CDI for Marginalised and Wealthy Regions in Kenya.............................................................................27
Figure 8: Distribution of Education Facilities in Kakuma Refugee Camp...................................................................................28
Figure 9: Distribution of Education Facilities in Kakuma Host Community Areas.......................................................................29
Figure 10: Distribution of Water Facilities in Kakuma Refugee Camp.......................................................................................30
Figure 11: Household Sources of Water...................................................................................................................................31
Figure 12: Distribution of Water Facilities in Kakuma Host Community Area............................................................................31
Figure 13: Main Sources of Light in Households......................................................................................................................33
Figure 14: Firewood is a Major Trade Commodity in Kakuma Refugee Camp...........................................................................33
Figure 15: Charcoal is a Major Trade Commodity in Kakuma Town..........................................................................................33
Figure 16: Some Public Facilities in Kakuma Camp..................................................................................................................34
Figure 17: Cemetery in Kakuma III is Poorly Planned and Not Fenced.......................................................................................34
Figure 18: Why Households are Not Interested in Commercial Farming...................................................................................35
Figure 19: Businesses of Interest Among Households .............................................................................................................36
Figure 20: Household Asset Base in Kakuma...........................................................................................................................37
Figure 21: Household Food Security Situation in Kakuma .......................................................................................................37
Figure 22: Reasons for Skipped Meals.....................................................................................................................................38
Figure 23: Household Food Insecurity Coping Strategies..........................................................................................................38
Figure 24: House Walling Material...........................................................................................................................................40
Figure 25: Roofing Materials in Kakuma .................................................................................................................................41
Figure 26: Typical Housing Typologies in Kakuma Refugee Camp and Extensions.....................................................................41
Figure 27: Different Nationalities Have Different Architecture in Kakuma.................................................................................41
Figure 28: Sunken Internal Space in South Sudanese Architecture...........................................................................................41
Figure 29: Positive Changes from Refugee Settlement.............................................................................................................42
Figure 30: Negative Changes from Refugee Settlement...........................................................................................................42
Figure 31: Nature of Changes from Refugee Settlement..........................................................................................................43
Figure 32: Areas of Interaction Between Hosts and Refugees..................................................................................................43
Figure 33: Frequency of Disagreements Between Hosts and Refugees.....................................................................................44
Figure 34: Areas of Collaboration Between Hosts and Refugees..............................................................................................45
Figure 35: Location of Schools in Kalobeyei Ward....................................................................................................................46
Figure 36: Distribution of Water Facilities in Kalobeyei Ward ...................................................................................................48
Figure 37: Distribution of Water Facilities in Kalobeyei Integrated Settlement..........................................................................49
Figure 38: Water Tanks and UNHCR Water Bowsers................................................................................................................49
Figure 39: Pit latrines are lined up behind houses in Kalobeyei New Site settlement.................................................................49
Figure 40: Main Sources of Lighting Energy in Kalobeyei.........................................................................................................50
Figure 41: A GIZ supported solar street light in Kalobeyei........................................................................................................50
List of Figures and Tables
8. Kalobeyei Socio-Economic and Mapping Baseline Survey Report, 2016vi
Figue 42: Why Households are Not Interested in Commercial Farming Activities......................................................................51
Figure 43: Small Scale Commercial Farming in Kalobeyei New Site..........................................................................................51
Figure 44: Interests in Business Activities.................................................................................................................................52
Figure 45: Household Asset Ownership in Kalobeyei...............................................................................................................53
Figure 46: Mpesa Shop Set Up on the Roadside in Kalobeyei Shopping Centre........................................................................53
Figure 47: Reasons For Skipped Meals in Households..............................................................................................................54
Figure 48: Short Term Food Insecurity Indicators in Households...............................................................................................54
Figure 49: Household Perception on Food Security .................................................................................................................55
Figure 50: Typical Homestead Layout in Kalobeyei Host Community Area ...............................................................................55
Figure 51: Refugee Room with One Side Acting as Cooking Area............................................................................................55
Figure 52: Varying Walling and Roofing Materials in Kalobeyei Host Community Areas...........................................................56
Figure 53: Walling and Roofing Material in Kalobeyei New Site...............................................................................................56
Figure 54: Emerging Challenges to Growth and Development in Kakuma and Kalobeyei.........................................................57
Figure 55: Strong Winds are a Major Challenge for Refugees..................................................................................................58
Figure 56: Emerging Opportunities for Growth and Development in Kakuma and Kalobeyei...................................................58
Figure 57: Pictorial View of Businesses Activities in Kalobeyei and Kakuma ............................................................................59
Figure 58: Reasons for Venturing into Current Business...........................................................................................................60
Figure 59: Operating Other Business(es)..................................................................................................................................61
Figure 60: Business Modification(s)..........................................................................................................................................61
Figure 61: Conversion of Space from Residential to Commercial Uses is Popular in Kakuma Camp..........................................62
Figure 62: Commercial Streets in Kakuma I, Showing Location of Somali & Ethiopian Markets................................................63
Figure 63: Macro-Level Settlement Patterns in The Kakuma Kalobeyei Area.............................................................................67
Figure 64: Settlement Patterns in Kalobeyei and Oropoi Towns................................................................................................68
Figure 65: Nucleated and Linear Settlement in Kakuma Town..................................................................................................68
Figure 66: Nature and Extent of Settlements in and Around Kalobeyei and Oropoi Towns.......................................................69
Figure 67: Nature and Extent of Settlements in and Around Kakuma Town.............................................................................70
Figure 68: Nucleated, Planned and Organic Developments in Kakuma Camp..........................................................................71
Figure 69: Settlement Patterns in Kakuma-Kalobeyei Non-Urban Areas...................................................................................71
Figure 70: Communal Nucleated Settlement Outside Urban Areas and Dispersed Settlements Outside Urban Areas................72
Figure 71: Human Settlement Transitions in Kakuma Camp: 2003, 2007 and 2013.................................................................73
Figure 72: Human Settlement Transitions in Kakuma Town, 2003, 2007 and 2013..................................................................74
Figure 73: Densification within Plots and Extensions In Kakuma..............................................................................................75
Figure 74: Typical Extensions in Kakuma Camp .......................................................................................................................75
Figure 75: Variations in Material Used for Commercial Extensions in Kakuma Camp................................................................76
Figure 76: Typical Nature of Densification and Extensions in Kakuma Host Community Area....................................................76
Figure 77: Roadside Informal Economic Activities are the New Order in Kakuma Town Main Commercial Area........................77
Figure 78: Typical Turkana Architecture for a Monogamous and Polygamous Family................................................................77
Figure 79: Emerging Architecture Mix in Kakuma Host Community Area.................................................................................78
Figure 80: Emerging Architecture Mix in Kakuma Host Community Area.................................................................................78
Figure 81: Reasons for House Modification in Kakuma............................................................................................................79
Figure 82: Nature of Modifications Adopted by Hosts and Refugees in Kalobeyei....................................................................80
Figure 83: Variations in Typical Extensions in Kalobeyei Host Community and Kalobeyei New Settlement.................................80
9. vii
Figure 84: Registration of Land rights in Turkana County.........................................................................................................82
Figure 85: Land use / Land cover in Kalobeyei.........................................................................................................................83
Figure 86: Land use / Land cover New Kalobeyei site...............................................................................................................83
Figure 87: Livestock Migration Routes.....................................................................................................................................84
Figure 88: Densified topographical map for Kalobeyei New Site .............................................................................................85
List of Tables
Table 1: Kenya Refugee Population 2015..................................................................................................................................5
Table 2: Sample Distribution ...................................................................................................................................................19
Table 3: Comparative Demographic Data................................................................................................................................23
Table 4: Aspects that Cause Conflict Between Refugees and Hosts..........................................................................................44
Table 5: Comparative Demographic Data................................................................................................................................45
Table 6: Reasons for Interest in Various Businesses...................................................................................................................52
Table 7: Types of Businesses....................................................................................................................................................60
Table 8: Summarizes the basic demographic profile of business operators. .............................................................................61
Table 9: Daily Wage Distribution..............................................................................................................................................62
Table 10: Nature of Business Modifications .............................................................................................................................62
Table 11: Perceptions of Refugee Influx on Income Generating Activities, Employment, Security and Business Environment.....63
Table 12: Challenges Facing Businesses...................................................................................................................................64
Table 13: Business Opportunities.............................................................................................................................................64
Table 14: Applicable charges on livestock in Kakuma market...................................................................................................89
10. Kalobeyei Socio-Economic and Mapping Baseline Survey Report, 2016viii
List of Acronyms
CBOs Community Based Organizations
CIDP County Integrated Development Plan
DRA Department of Refugees Affairs
DRC Danish Refugee Council
EPAU Evaluation and Policy Analysis Unit
FAO Food and Agriculture Organization
FBOs Faith Based Organizations
FGDs Focus Group Discussions
IRC International Rescue Committee
IGAs Income Generating Activities
KIIs Key Informant Interviews
LWF Lutheran World Federation
LOKADO Lotus Kenya Action for Development Organization
NCCK National Council of Churches in Kenya
NGOs Non Governmental Organizations
NRC Norwegian Refugee Council
PWJ Peace Winds Japan
RA Research Assistant
TCG Turkana County Government
TOR Terms of Reference
UN HABITAT United Nations Human Settlement Programmes
UNHCR United Nations High Commissioner for Refugees
WFP World Food Programme
11. ix
Table of Contents
Acknowledgements...............................................................................................................................................................ii
Executive Summary..............................................................................................................................................................iii
List of Figures and Tables......................................................................................................................................................v
List of Acronyms.................................................................................................................................................................viii
Chapter 1: Introduction........................................................................................................................................................1
1.1 Background....................................................................................................................................................................1
1.2 Objectives of the Baseline Survey and Mapping:.............................................................................................................1
1.3 Overview of the Kalobeyei Integrated Socio-Economic Development Programme............................................................2
1.4 Scope of the Baseline Survey..........................................................................................................................................2
Chapter 2: Literature Review: Global Refugee Trends and Local Operating Framework ...............................................5
2.1 Overview of Refugee Settlements...................................................................................................................................5
2.2 Refugee Settlements: Emerging relationships, conflicts, and integration alternatives.......................................................5
2.2.1 Causes of conflicts between refugees and host communities................................................................................6
2.2.2 Determinants of Sustainable Refugee Settlements................................................................................................8
2.3 Other Initiatives which may Impact on KISEDP..............................................................................................................10
2.3.1 The Lamu Port-Southern Sudan-Ethiopia Transport (LAPSSET) Corridor................................................................10
2.3.2 Other Initiatives by the Turkana County Government .........................................................................................11
2.4 Legal and Policy Framework guiding planning & development of refugee settlements...................................................11
2.4.1 The Refugees Convention of 1951......................................................................................................................11
2.4.2 1967 Protocol relating to the Status of Refugees................................................................................................11
2.4.3 1969 Organization of African Unity (OAU) Convention Governing the Specific Aspects of Refugee Problems in
Africa .............................................................................................................................................................12
2.4.4 Government of Kenya Refugees Act 2006..........................................................................................................12
Chapter 3: Study Area and Methodology.........................................................................................................................15
3.1 Introduction.................................................................................................................................................................15
3.2 The Study Area.............................................................................................................................................................15
3.2.1 Sub-National Context - Turkana County Overview...............................................................................................15
3.2.2 Local Context – Kakuma and Kalobeyei .............................................................................................................15
3.3 Study Methodology and Approach ..............................................................................................................................18
3.3.1 Baseline Socio-Economic Survey Design..............................................................................................................18
3.3.2 Baseline Mapping Survey Design.........................................................................................................................19
Chapter 4: Baseline Socio-Economic Survey Findings......................................................................................................23
4.1 Overview......................................................................................................................................................................23
4.2 Socio-Economic Baseline Survey Findings from Kakuma ...............................................................................................23
4.2.1 Basic Demographic profile..................................................................................................................................23
4.2.2 Access to Basic Services......................................................................................................................................23
4.2.3 Income Generating Activities and Opportunities ................................................................................................35
4.2.4 Household Asset Base and Quality of Life...........................................................................................................36
4.2.5 Household Food Security and Coping Mechanisms.............................................................................................37
4.2.6 Housing Characteristics and Space Utilization ....................................................................................................39
4.2.7 Impact of Kakuma Camp on the Larger Area and Nature of Interactions Between Refugees and Hosts...............41
4.3 Findings from Kalobeyei Area.......................................................................................................................................44
12. Kalobeyei Socio-Economic and Mapping Baseline Survey Report, 2016x
4.3.1 Basic Demographic Profile..................................................................................................................................44
4.3.2 Access to Basic Services......................................................................................................................................45
4.3.3 Livelihoods and Growth Opportunities................................................................................................................51
4.3.4 Household Food Security and Coping Mechanisms.............................................................................................53
4.3.5 Housing Characteristics and Space Utilization.....................................................................................................55
4.4 Emerging Challenges and Opportunities in Kakuma and Kalobeyei...............................................................................57
4.4.1 Challenges.........................................................................................................................................................58
4.4.2 Opportunities.....................................................................................................................................................58
4.5 Businesses Survey Findings ..........................................................................................................................................60
4.5.1 Business Typologies.............................................................................................................................................60
4.5.2 Basic Demographic Profile of Business Respondents ...........................................................................................60
4.5.3 Experience in Business Activities..........................................................................................................................61
4.5.4 Business Permits ................................................................................................................................................61
4.5.5 Operating Other Businesses................................................................................................................................61
4.5.6 Business Employments........................................................................................................................................62
4.5.7 Business Premises Modifications.........................................................................................................................62
4.5.8 Challenges Facing Businesses and Opportunities.................................................................................................64
4.5.9 Inter-Linkage of Business Activities......................................................................................................................64
Chapter 5: Baseline Mapping Findings..............................................................................................................................67
5.0 Overview......................................................................................................................................................................67
5.1 Land Use, Settlement Patterns and Transformations in Kakuma-Kalobeyei Area............................................................67
5.1.1 Settlement Patterns in Kakuma-Kalobeyei...........................................................................................................67
5.1.2 Spatial Analysis of Settlement Transformations....................................................................................................72
5.1.3 Household Analysis on Settlement Modifications ...............................................................................................79
5.1.4 Lessons for Kalobeyei Integrated Settlement from Analysis of Settlement Patterns in Kakuma............................81
5.2 Land Use, Land Tenure and Migration Patterns ............................................................................................................81
5.2.1 Land Tenure........................................................................................................................................................81
5.2.2 Land Use and Land Cover in Kalobeyei...............................................................................................................82
5.2.3 Migration Patterns .............................................................................................................................................84
5.3: Topographic Mapping and Densification of Features in the Kalobeyei new site.............................................................84
Chapter 6: Conclusions and Recommendations................................................................................................................87
6.1 Conclusions..................................................................................................................................................................87
6.2 Recommendations........................................................................................................................................................88
Annexes................................................................................................................................................................................89
Annex 1: Market Profiles....................................................................................................................................................89
1. Kakuma Town Livestock Market...............................................................................................................................89
2. Hong Kong Market .................................................................................................................................................91
3. Kakuma II Market (also called Phase 2 market).........................................................................................................92
4. Kakuma III Market (also called Reception market)....................................................................................................93
5. Ethiopian Markets ..................................................................................................................................................94
6. Somali Market ........................................................................................................................................................95
7. Kakuma IV/New Area Market..................................................................................................................................95
15. 1. Introduction;
2. Global refugee trends and local operating framework ;
3. Study area background and methodology;
4. Baseline socio-economic survey findings
5. Baseline mapping survey findings
6. Conclusion and recommendations
1.2 Objectives of the Baseline Survey and
Mapping:
The goal of the baseline survey was to generate planning
specific and relevant information which will be used by UN-
Habitat (and partners) in the development of the Kalobeyei New
Settlement Local Advisory Spatial Plan. The survey included two
components – socio-economic and mapping studies.
The specific objectives of the socio-economic study sub-
component included to:
(i) Analyse the existing situation in the wider area of the
host communities and the new site area, with regards to:
agricultural lands, main natural features and productive
natural features, protected or heritage areas, roads,
infrastructure and basic services, access to the area and
connections with other settlements;
(ii) Document and analyse current and historical settlement
patterns around Kakuma and Kalobeyei area;
(iii) Conduct a participatory settlement household survey to
establish a detailed analysis of the identified settlement
systems and humanitarian and development needs of
both the refugees and host communities;
(iv) Conduct a survey and a community workshop with the
refugee communities in order to gain an understanding of
their conditions, capacities, needs, problems and desires;
(v) Conduct a socio-economic and spatial survey of livelihood
means in the area, targeting both host and refugee
communities;
(vi) Conduct a participatory business survey; and
(vii) Organise a stakeholder validation and training workshop
in which the findings of the study would be disseminated.
The objectives of the mapping sub-component included to:
1. Collect all available data on land use and map the current
tenure situation in the area by:
2. Identifying all existing information, as well as missing
crucial data that needs to be acquired with the survey in
wider Kakuma area;
3. Identifying sources of data and facilitating the access to,
and collection and collation of all spatial land information
from these sources;
4. Collecting and collating other relevant GIS datasets (e.g.
topography, roads infrastructure, health, education, water
facilities etc.);
1.1 Background
The global refugee situation has been worsening over the
last decade, with conflict re-emerging and appearing in new
forms in all major world regions. Over this period, Sub-Saharan
Africa has both generated and hosted the world’s largest
refugee population. By the end of 2015, the region was home
to 4.4 million refugees (about a quarter of the total refugee
population under UNHCR mandate), of which more than half
(2.7 million) were hosted in the East and Horn of Africa region.
By the end of 2015, Kenya was ranked seventh in the world in
numbers of refugees it hosted (553,900), and was the African
country with the second highest refugee population (after
Ethiopia which hosted 736,100 refugees)1
.
The Kakuma Refugee Camp opened in 1992 to host 12,000
unaccompanied minors who had fled the war in Sudan and
arrived on foot from camps in Ethiopia2
. It was designed to host
a maximum population of 100,000, but was home to 161,725
people by the end of 20153
. With an unrelenting conflict in
the region, particularly in South Sudan, more refugees have
continued to trickle into Kakuma Camp, demanding alternative
methods of hosting them, especially since allocated camp land
has been filled.
In June 2015, the Turkana County Government allocated 1500
hectares of land, located approximately 15 km to the west of
Kakuma, in Kalobeyei ward, to the United Nations Refugee
Agency (UNHCR) and the Department of Refugee Affairs (DRA)4
.
One of the conditions given by the County Government and the
people of Turkana was that the land would be developed as a
settlement as opposed to a camp; that deliberate efforts would
be made to facilitate local integration; and that humanitarian
and development organizations would not only be on refugees
but also on the host community. The new settlement also
had to consider development of the larger region, and ensure
that all activities were in line with the county and national
development frameworks. All these would be implemented
within the framework of the “Kalobeyei Integrated Socio-
Economic Development Programme” (KISEDP). UN-Habitat’s
role in the programme was to plan a sustainably integrated
settlement.
UN-Habitat commissioned this Baseline Socio-Economic and
Mapping Survey to understand the larger planning context,
and in turn to inform the integrated planning process. The
report is organised into six chapters,
1 UNHCR, 2016, Global Trends: Forced Displacements 2015. UNHCR
2 Wikipedia, The Free Encyclopedia, Kakuma.
3 ibid
4 UNHCR, Alternatives to Camps; Making it Work, Good Practice and
Guidance Series, 2016
Chapter 1: Introduction
Chapter
16. Kalobeyei Socio-Economic and Mapping Baseline Survey Report, 20162
5. Processing the data into a common GIS database
(scanning and digitizing hard copy maps, cleaning and
amalgamating existing GIS files);
6. Conducting a participatory GIS mapping of established
‘commons’ land, and informal or semi-formal systems of
land and resource management;
7. Conducting mapping from secondary sources (satellite
imagery, aerial photos) and field surveys to fill gaps in
existing data from sources listed in (ii);
8. Mapping livelihoods, and living and working spaces in
Kakuma Refugee Camp.
9. Develop an integrated WEB-GIS system to store, manage
and support the manipulation of the collected datasets.
10. Provide technical capacity development to selected
Government of Turkana staff on mapping and WebGIS
system management.
11. Organise a stakeholder validation and training workshop.
12. Provide 6-months system support.
1.3 Overview of the Kalobeyei Integrated
Socio-Economic Development Programme
The Kalobeyei Integrated Socio-Economic Development
Program (KISEDP) is a Turkana-based initiative that aims to
facilitate collaboration and coordination between the Kenyan
Government, UN agencies, development actors, NGOs, the
private sector and civil society to build sustainable services and
economic opportunities. The programme revolves around a new
refugee site in the Kalobeyei area (ward) of Turkana County,
Northern Kenya, which is expected to accommodate more than
60,000 refugees and host communities. It focuses on both short-
term (humanitarian) and long-term (sustainable development)
interventions, and will be implemented in four thematic areas5
:
1. Sustainable Integrated Service Delivery and Skills
Development;
2. Spatial Planning and Infrastructure Development;
3. Agriculture and Livestock Development; and
4. Private Sector and Entrepreneurship.
5 UN-Habitat News, UN-Habitat to lead in planning Kenya’s first
Integrated Settlement in Kalobeyei, Turkana County, 2016.
The Kalobeyei New Settlement is designed as a hybrid system
which empowers refugee and host communities through
livelihood opportunities and gives them access to mainstreamed
services. UNHCR will ensure that refugees and host community
members in Kalobeyei and Kakuma produce and run as many
of the goods, services and businesses in the area as possible. For
example, activities will support crop production and prepare youth
to benefit from the emerging industry in Turkana where large
reserves of oil, gas and under-ground water have been discovered.
UN-Habitat’s intervention in KISEDP will be one that promotes
public participation and stakeholder involvement and is
expected to lead to the establishment of a support function
for the County Government of Turkana, sustainable livelihoods
development for refugee and host communities, and the
formulation of a detailed resettlement plan for the new
settlement (that will include the Local Advisory Spatial Plan and
other investment plans).
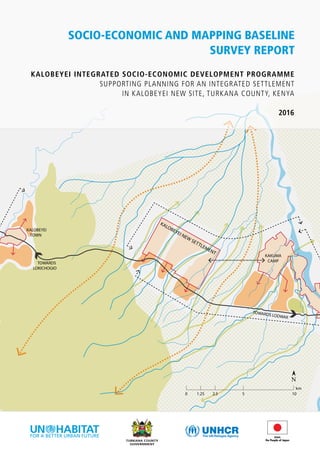
1.4 Scope of the Baseline Survey
The scope of the baseline survey was the two wards of
Kalobeyei (with a host population of 16,378) and Kakuma (with
a host population of 33,539 people)6
(Figure 1). The Kakuma
Camp and Kalobeyei New Settlement, though not included in
the above statistics, were important areas for data collection
and analysis. Since they are not territorially demarcated within
Kenya’s geographical units, the two settlements were treated
as falling within the two administrative wards. To appreciate
regional development dynamics and how these were influenced
by refugee settlements, part of the survey also focused on the
surrounding Lopur and Nakalale wards.
The influence of Kakuma Refugee Camp on Kakuma Town,
other surrounding major towns (e.g. Lokichogio, Lodwar,
Kitale), as well as smaller market centres were also evaluated
(Figure 1). At the lower level, the study sought to attain
information on households, businesses and key informants
such as local and international organizations working in the
area. A regional level analysis spanning over the larger Turkana
area was also undertaken on grazing and migration patterns
among the Turkana people.
6 Info Track Kenya, Constituency Information and Wards, 2015,
http://www.infotrackea.co.ke/services/leadership/constituencyinfo.
php?cinf=wards&t=124
19. Chapter 2: Literature Review: Global Refugee Trends
and Local Operating Framework
Refugees in Kenya are hosted in three major areas:
1. The Dadaab refugee complex which has five camps -
Dagahaley, Hagadera, Ifo, Ifo 2 and Kambioos;
2. Kakuma Camp; and
3. Urban refugees in the country’s capital Nairobi.
Several thousand other refugees are also estimated to be spread
out throughout the country, but are currently unaccounted for.
The populations in the settlements vary widely, with urban
refugees accounting for about 8.5% of the total national
refugee population, and Kakuma Camp hosting about 29% of
the population (Table 1).
2.2 Refugee Settlements: Emerging
relationships, conflicts, and integration
alternatives
Aroundtheworld,incidencesofforceddisplacement–whichoften
result in refugees – are increasing. This has not only necessitated
a heightened need for resources to take care of them, but has
also led to the realization that sustainable solutions to the refugee
crisis are required. While this largely applies at the management
context, there are emerging dynamics at the local level, which
are mostly related to how refugees interact among themselves in
refugee camps/settlements, and also how they interact with the
local communities in the areas they resettle.
Whereas existing literature on the overall (short and long-
term) relationships between refugees and host communities
is limited, there is a growing interest in this subject, which is
broadly being influenced by the growing refugee populations
and increasing conflicts in refugee camps. Several existing
studies focus on refugee settlements as encamped human
settlements; often with individual refugee camp studies as
opposed to comparative analysis of different settlements
(see Martin, 2005; Berry, 2010, Tollebrandt& Wrede, 2013;
2.1 Overview of Refugee Settlements
The past few decades have seen a rising global refugee crisis. This has
not only challenged local development, but also strained resources
from humanitarian organizations and resulted in growing conflicts
between refugees and host communities. The number of forcibly
displaced people globally increased by 5.8 million, from 59.5 million
in 2014 to 65.3 million in 2015. Of this number, 21.3 million were
refugees, 16.1 million of whom were under UNHCR’s mandate. By
the end of 2015, 86% of the refugees under UNCHR mandate were
hosted in developing countries7
. Sub-Saharan Africa was home to
about a quarter of this population (4.4 million people), more than
half (2.7 million) of whom were hosted in the East and Horn of
Africa region where Kenya lies. In 2015 alone, the East and Horn
of Africa region experienced a 5% increase in refugee numbers, an
equivalent of 138,000 individuals from the start to end of the year8
.
Kenya, which is centrally located in the East and Horn of Africa
high conflict zone has enjoyed relatively stable political and
economic environment over the decades. The country borders
two of the top 10 major sources of refugees globally, Somalia
(ranked number 3) and South Sudan (number 4), and is close
to three other major refugee sources (Sudan – number 5,
Democratic Republic of Congo – number 6 and Central African
republic – number 7). As a result, by the end of 2015, Kenya was
among the 10 countries hosting the largest number of refugees
globally, ranked 7th with a total of 553,900 refugees; and the
second in Africa after Ethiopia (hosting 736,100 refugees). While
the net increase in number of refugees (and people in refugee like
situations) in the country through 2015 was marginal (recorded
at only 2,560 persons), the number of spontaneous arrivals was
recorded at 21,624 people through the year. On the other hand,
there was a major decrease in the ‘refugee’ and ‘people in refugee
like situation’ population, recorded at 10,848 persons, of whom
5,847 were voluntarily repatriated and 5001 were resettled9
.
7 UNHCR, 2016, Global Trends: Forced Displacements 2015. UNHCR
8 ibid
9 ibid
Table 1: Kenya Refugee Population 2015
Demographic indicators
Name of location
Refugees at location, end-2015
Share of age group in total Percentage female per age group
0-4 5-11 12-17 <18 18-59 60+> 0-4 5-11 12-17 <18 18-59 60+> Total
Nairobi : Province 47,249 7% 16% 13% 36% 61% 3% 48% 49% 51% 9% 54% 61% 52%
Dagahaley : Point 86,634 16% 27% 18% 61% 36% 3% 50% 49% 47% 13% 54% 51% 51%
Hagadera : Point 105,367 15% 25% 17% 56% 40% 3% 48% 49% 47% 13% 53% 51% 50%
Ifo : Point 82,678 15% 25% 17% 57% 39% 4% 48% 49% 47% 13% 53% 50% 50%
Ifo 2 : Point 50,471 19% 31% 18% 67% 30% 3% 49% 47% 44% 14% 53% 46% 48%
Kakuma : Point 161,725 14% 24% 19% 56% 42% 2% 49% 47% 42% 12% 48% 67% 47%
Kambioos : Point 19,788 18% 31% 18% 67% 30% 3% 49% 47% 43% 13% 52% 49% 48%
Source: UNHCR 2016. Global trends - forced displacements 2015.Table 16. Major locations and demographic composition of refugees and people in refugee-like situations, end-2015
Chapter
20. Kalobeyei Socio-Economic and Mapping Baseline Survey Report, 20166
Malik et al, 2011, Aukot, 2003). In the recent past, new
studies are focusing on local integration of refugees and host
communities (as promoted by UNHCR, World Vision - Guay,
J, 2015, Jacobsen, 2003). The level of data comparability and
data generation is however at the micro level, and is often
inconclusive. Refugees should not be considered as burdens in
the areas where they settle, as they bring potential to generate
economic, legal and social opportunities in impoverished
regions. However, the humanitarian approach to addressing
refugee situations that is broadly guided and influenced by
international law and other national policies has created high
levels of inequality between refugees and host community
members; one which views refugees as more important than
their hosts, often resulting in their being given greater access
to economic and social opportunities. This has contributed
to growing tensions between the two communities, which is
hindering efforts by organizations such as UNHCR to develop
integrated settlements.
This section discusses the most common causes of conflict
between the two groups, as well as the emerging opportunities
from refugee settlements.
2.2.1 Causes of conflicts between refugees and
host communities
Conflicts between refugees and host communities are varied,
often depending on the local contexts where resettlement
happens. While assessing 15 studies discussing the drivers of
social tensions in Lebanon and Jordan (as influenced by the
Syria refugee crisis), Guay (2015) identifies three broad causes
of conflict: structural, socio-economic and proximate. Each has
multiple elements, as follows:
Structural causes:
• Structural vulnerabilities that pre-date the specific crisis,
such as high levels of poverty, resource scarcity, and lack of
effective governing institutions (or support for institutions).
Socio-economic causes:
• Differences in religious, cultural and social norms between
refugee and host communities and lack of social networks.
Proximate causes:
• Access (poor quality living conditions and the perception
of exploitation).
• Economic competition over jobs (formal and informal
employment) and livelihood opportunities.
• Access to and quality of basic education (e.g. concerns of
overcrowded classrooms and lack of quality or access) and
basic public goods and services (e.g. water and electricity,
solid waste collection, healthcare).
• The role of international aid (in terms of perceptions on
fairness of distribution, availability and perceptions of
inequity, unfairness and corruption).
• The role of social, local and international media and the
framing of issues.
This categorization is not universal and some sub-causes
may easily belong to different clusters. It however gives a fair
summary of findings by other researchers from across the world.
a. Structural causes of conflict
Outside the fact that most refugees around the world are
hosted in the developing and least developed countries, refugee
camps are themselves located in the most remote areas of such
countries. These are the resource-scarce areas where poverty
stricken and marginalised communities live without access to
basic needs. The influx and settlement of refugees in these
areas is often an immediate cause for tension, not only on the
aspects of utilization of land, but also on access to services in
high demand.
According to international law, to receive international aid a
person must live outside their country of origin and without
state protection, implying that one group of vulnerable people
(refugees) receives aid and support in all aspects of their life,
while the other vulnerable group (the host community) does
not. The mix of traditional vulnerabilities and inequitable access
to emerging services and opportunities often leads to hostility
between the refugees and hosts. This is the case in Kenya,
where the two largest camps, Dadaab and Kakuma are located
in the least (agriculturally) productive semi-arid areas10
. Here,
humanitarian-organization supported refugees live among the
Turkana nomadic pastoralists, many of whom live in severe
poverty11
and who receive very minimal, if any assistance
from the international community. This has resulted in the
host communities feeling hostile and blaming their problems
on refugees and support institutions12
. A similar situation was
reported in Jordan where external “uneven access to” support
and “targeting” was identified as a major source of heightened
tension from host communities that were estimated to be at
relatively high risk of tension13
.
The long term achievement of integrated communities,
where social cohesion is a driving force for local growth,
should therefore consider local perceptions on “selective” aid/
assistance. Aid agencies should consider how their response is
linked to community dynamics, and how it may inadvertently
catalyse frictions, escalate tensions and increase negative
perceptions of assistance14
.
b. Conflicts emanating from “value” of resources,
culture and changing security patterns
There is increasing concern about cultural diffusion,
environmental degradation and cultural conflict and tension
in many refugee settled areas. Demand for construction and
cooking material (timber, firewood) strains natural resources
such as forests. In Turkana, there have been incidences
of increased elopement; increased cases of prostitution;
increased insecurity; destruction of forests and other events,
10 Country’s economy still largely relies on agriculture (60-70%)
11 Aukot, E. 2003. “It is Better to be a Refugee Than a Turkana in
Kakuma: Revisiting the Relationship between Hosts and Refugees in
Kenya.” Global Movements for Refugees and Migrant Rights. 21.3
(2003); 73-83
12 ibid
13 Joseph Guay, World Vision International, 2015, Social Cohesion
between Syrian Refguees and Urban Host Communities in Lebanon
and Jordan, “Perceptions of External Support”, 4.
14 ibid
21. Chapter 2: Literature Review: Global Refugee Trends and Local Operating Framework 7
which have been a major causes of conflict in Kakuma. There
are also reported fights between the local population and
refugees, related to destruction of forest resources including
indigenous trees. Hosts feel that falling trees are endangering
the survival of their livestock15
. Over the years, there has
been a growing shift towards use of bricks and iron sheets in
construction, rather than timber, although use of firewood is
a major cause for concern for the local community.
Variations in culture, beliefs and political affiliations between
refugees and hosts (and among the refugee communities),
is another issue of concern. Around the world, refugees are
considered a security threat to their host communities. In
Kakuma, the Turkanas have previously accused the Dinka ethnic
group of Sudan of raping local women and creating gangs16
.
There have also been reports of the Dinkas fighting with the
Nuers (another Sudanese ethnic group), often drawing the
local population into conflict17
.
The security situation is influenced by events, public opinion,
leadership and governance, and is a major barrier to developing
integrated settlements. In Kenya, the presence of Somali
refugees in the country (and especially the Dadaab camps) has
been associated with high levels of insecurity and increased
terrorist activities, and has contributed to ongoing deliberations
by the government on whether the camp should be closed.
c. Conflicts emanating from access to goods,
services and facilities
Basicservicessuchaswaterandfoodareoftendisproportionately
accessible to refugees rather than host communities. Most
settlements are in arid areas, straining food supplies and
increasing competition for scarce water resources. In Chad
and Darfur, friction between refugees and host communities
is reportedly due to increased demand for water resources18
,19
.
Similarly in Kakuma, the host community complain that their
water supply has been severely compromised since the arrival
of refugees. Local women must walk long distances to fetch
water20
, while refugees have piped water in their compounds.
There are also growing concerns over the sustainability of
underground water resources in the river reserve, along which
most boreholes supply water to the camps have been drilled.
Displacement of host communities in refugee settlement
areas, soil erosion and deforestation have greatly affected
food security for locals, who depend on pasture and water for
survival and to sustain their pastoral lifestyle.
15 Aukot, E. 2003. “It is Better to be a Refugee Than a Turkana in
Kakuma: Revisiting the Relationship between Hosts and Refugees in
Kenya.” Global Movements for Refugees and Migrant Rights. 21.3
(2003); 73-83.
16 ibid
17 ibid
18 Cronin, A. et al., “A review of water and sanitation provision in
refugee camps in association with selected health and nutrition
indicators – the need for integrated service provision.”
19 Unite for Sight, Module 7: Refugee and Host Community
Relationships, http://www.uniteforsight.org/refugee-health/module7
20 Aukot, E. 2003. “It is Better to be a Refugee Than a Turkana in
Kakuma: Revisiting the Relationship between Hosts and Refugees in
Kenya.” Global Movements for Refugees and Migrant Rights. 21.3
(2003); 73-83.
d. Conflicts emanating from discrepancy in access
to social opportunities
Access to services forms a key basis and premise for sustainable
integration of communities. There are mixed reports on the
impact of refugee presence on access to education and health,
but there is consensus that refugees have better access to food,
education and utilities. Refugees can choose to go to local or
camp schools, but locals may not attend schools in refugee
camps, such as in Kakuma21
.
An example to be emulated is the Buduburam refugee camp
in Ghana, which has far fewer restrictions. Construction of
schools for the refugee camp has increased education access
among locals, thus enhancing opportunities in the villages
around the camp as compared to other areas22
. Inequitable
access to these services is a major cause of conflict between
refugees and host communities.
e. Conflicts over access to economic opportunities
A key measure of the impact of a refugee settlement on a local
community is economic growth. When refugee settlement
occurs in a marginalised and previously economically inactive
area, it may receive substantial foreign capital. Refugees
influence the local economy in various ways:
1. Increased demand for goods, which increases the variety
of income generating opportunities possible for the host
community.
2. Increased purchasing power of refugees, who often
receive aid from humanitarian organizations. This leads
to higher prices and increased profits for traders, but may
negatively impact the rest of the local population if income
generating opportunities are not made widely accessible.
3. New job opportunities with the construction of the camp,
though mostly for the refugee population with regular
spill-over to the host community. In properly governed
settlements, negotiations for community participation in
the emerging jobs would lead to equal job opportunities
and capacity-development for locals.
The change in economic fortunes and creation of opportunities
is important for local communities, but also a major area of
conflict between refugees and host communities. Increased
demand for goods and products is associated with higher
prices. In the long term, the exchange of goods and services
leads to further development and improves the standard of
living for people living around the refugee camps23
.
The improved standard of living, however, also causes
increased inequality, with more strategically placed locals at
an advantage over the rest of the community. As refugees
begin to settle, the camps grow into self-sustaining “towns”,
21 Ibid
22 Boamah-Gyau, K. “The Socio-cultural and economic impact of
Refugees on the host Indigenous Communities in West Africa: A case
study of Liberian Refugees at Buduburam Community in Ghana.”
Thesis.University of Tromso. June 2008.
23 Unite for Sight, Module 7: Refugee and Host Community
Relationships, http://www.uniteforsight.org/refugee-health/module7
22. Kalobeyei Socio-Economic and Mapping Baseline Survey Report, 20168
• Participatory formulation of policies and development
frameworks in line with community norms, local, semi-
national, national and regional interests;
• Local community empowerment in all social and economic
fronts; and
• Promotion of regional economic opportunities, policies and
guidelines.
The achievement of sustainably integrated settlements can be
achieved in several ways:26
• Development of integrated humanitarian and development
programmes which seek to balance assistance to both
refugee and host communities, or integrate services
provided to both communities.
• Development of conflict resolution programmes which
encourage peace-building workshops, discussions or
regular meetings between both communities.
• Environmental management programmes which seek to
improve the management of environmental resources in
order to promote co-operation and reduce tensions.
The literature on good practice in this area is very limited, and
there are only a few general studies that address these issues
directly. One main barrier to effective programming is donors’
tendency to separate humanitarian assistance for refugees
from broader development assistance27
.
2.2.2.1 Alternatives to attaining Sustainable
Refugee Settlements – is Local Integration the
Ultimate Solution?
Globally, the development of sustainable solutions for the
growing refugee crisis is guided by 1951 Convention relating
to the status of refugees, which encourages signatory States
to cooperate in finding long-lasting solutions for refugees28
.
However, the attainment of durable solutions has legal,
economic, cultural, political and civil dimensions that need to
be addressed outright, so that refugees and other displaced
persons can enjoy the same rights as the nationals of the
country they are settled in. According to UNHCR, “without
safe environments, administrative and legal pathways to formal
solutions, access to economic opportunities, and inclusion
of displaced people in all aspects of social and cultural life,
solutions cannot be achieved”29
.
There are several options for the attainment of comprehensive
refugee settlements, including voluntary repatriation,
resettlement, and different forms of local integration. A
combination of pathways can be pursued simultaneously to
attain the best outcome for displaced populations30
.
Voluntary Repatriation was the preferred solution towards
26 Oliver Walton, 2012, GSDRC Applied Knowledge Services, Preventing
Conflict between refugees and host communities, http://www.gsdrc.
org/publications/preventing-conflict-between-refugees-and-host-
communities/
27 ibid
28 UNHCR, 2016, Global Trends: Forced Displacements 2015. UNHCR
29 ibid
30 ibid
‘Job competition is “intense because
NGOs tend to hire refugees, who work
for less than the Kenyans.” Clinics
in Kakuma, for instance, employ ten
refugees to assist one Kenyan. The
hospital alone employs 78 refugees
and only 21 Kenyans. Similar disparities
exist in Kenyan schools. A primary
teacher’s salary is KS 1875 for a refugee
and KS 11,790 for Kenyans’24
The disparity in access to employment opportunities, for two
populations who have a similar demand for income generating
opportunities, is a major cause of tension between refugees
and host communities25
.
2.2.2 Determinants of Sustainable Refugee
Settlements
Based on the sources of conflict between refugees and
hosts, the following are key requirements for a sustainably
integrated settlement:
• Equality of opportunities;
• Equitable distribution of resources;
• Enhanced local community growth;
• Cultural integration, while also respecting varying cultures
and their diversity;
24 Montclos, M., and Kagwanja, P. “Refugee Camps or Cities? The Socio-
economic Dynamics of the Dadaab and Kakuma Camps in Northern
Kenya.”Journal of Refugee Studies. 13.2 (2000): 205-222.
25 Ibid.
which usually offer higher quality goods and services than
the surrounding areas. A good example of this is in Kakuma,
where over the years the development of the Kakuma
Refugee Camp has promoted the growth of Kakuma Town.
However, several commercial streets and markets have also
developed within the camp, with camp-based businesses far
outperforming the town in terms of returns and variety of
goods available. This is due to higher purchasing power in
the camps, which creates demand for full time access to
goods and services, while restrictions such as curfew hours
reduce amount of trading time between hosts and refugees
in the host community town.
A high-conflict scenario for refugees and host communities
often involves land and labour distribution. In many areas,
the influx of refugees creates job opportunities, but it
also creates job competition which often gives refugees
an advantage over the hosts. The disadvantage of host
communities is based on two key aspects: the level of
expertise among these mostly marginalised communities
who must compete with skilled refugees; and the cost
of labour, as hiring refugees is much cheaper than hiring
hosts. This situation is clear in Kakuma, where, as noted by
Montclos and Kagwanja (2000):
23. Chapter 2: Literature Review: Global Refugee Trends and Local Operating Framework 9
attainment of a sustainable refugee solution, since it was based
on the belief that returning home would offer refugees the
right level of security and dignity, and the full state protection
required for each citizen. This solution has, however, been
challenged by growing conflicts, and recurrence of conflicts in
different world regions, making it difficult to repatriate citizens.
This was in addition to challenges such as a lack of access to
livelihoods, health care, education, and difficulties in land
and property reclamation by marginalised refugees. Because
of these challenges, the number of refugees who have been
voluntarily repatriated is uneven, with recorded returns of
201,400 refugees in 2015 and 414,600 in 2013. While 12.9
million refugees could return to their homes between 1996 and
2005, only 4.2 million returned between 2006 and 2015, with
the period 2011-2015 accounting for only 10% of the returns
over the last 20 years31
. The declining numbers of returns,
together with new and recurring conflicts, has greatly limited
this option, resulting in the need to promote two alternatives:
Resettlement occurs when refugees are unable to go back
to their countries for various reasons (continued conflict,
persecution etc.), and are resettled in a third country for
asylum, which has agreed to admit them as refugees and
ultimately grant them permanent residence. This option
is beneficial for refugees, and an increasing number
of countries are taking part in UNHCR’s resettlement
programme. However, very few people are resettled through
this program compared to the number of refugees being
generated each year. In 2015, for example, out of the total of
21.3 million refugees, only 134,000 refugees were referred
for resettlement. This was a 29% increase from 2014 and
the highest number in two decades32
.
Local Integration is perhaps the most promising means
for large scale refugee settlement, which offers not only
adequate protection for refugees, but also generates growth
opportunities for the settlement area. Local integration involves
a refugee finding a permanent home in the country of asylum
and integrating into the local community. This is a complex
and gradual process comprising distinct legal, economic, social,
and cultural dimensions. Over time the process should lead to
permanent residence rights and, in some cases, the acquisition
of citizenship in the country of asylum.
Until recently, local integration was a mostly neglected
alternative, as humanitarian organizations such as UNHCR
tended to prefer encampment as a solution to the growing
refugee crisis. Continuing and re-emerging conflicts have,
however, resulted in protracted refugee situations. The
concept is attracting attention for its potential to promote
economic development, protect refugee rights and provide
long-term solutions to persistent crises33
. Local integration
in the broadest sense, means permanently settling refugees
in host communities located in the country where they first
31 ibid
32 ibid
33 Migration Information Source, 2003, Jacobsen, K, Local Integration:
The Forgotten Solution, https://www.migrationpolicy.org/article/local-
integration-forgotten-solution
sought asylum34
. Some of the most popular approaches to
boosting local community integration are either policy driven,
or due to (pro-)active community and agency involvement in
the development of integrated communities, mostly with an
intention to tap into the benefits that refugee settlements
bring. Both approaches seek to boost short and long-term
links, and promote local resilience in the marginalised areas
where most refugee settlements develop.
In the past, many host governments, particularly in Africa,
have allowed “self-settlement” of refugees without official
assistance in local host communities. But local integration has
rarely been pursued systematically or formalized in a way that
gives refugees a secure legal status. Only a small number of
governments, including Uganda, Mexico, and Belize, have
offered local integration opportunities to refugees who cannot
or do not wish to repatriate. In both developed and developing
host countries, the preference is for temporary protection and
restrictions on refugees, including channelling them into camps
pending their repatriation.
There are many options for local integration of refugees, with
some of the most common scenarios including35
,36
:
• Full integration – in which refugees are granted asylum,
residency, and full and permanent membership status and
protection by the host government, with access and enjoy
the full range of economic, social, and civil rights accorded
to permanent legal residents, including access to citizenship
under the same terms as others.
• Local integration – which may take place when it is not safe
for refugees to return home after a prolonged period in
exile. In such cases, a host government may decide to allow
refugees to integrate locally, in the first-asylum country.
Local integration may or may not lead to permanent
residence and eventual citizenship.
• Self-settlement – when refugees share local households, or
set up temporary accommodation with the assistance of
local families or community organizations. Such refugees
do not have legal refugee status in the host country, and
though UNHCR recognises them it is unable to provide any
formal protection. These refugees are often active in the
local economy despite legal restrictions on such activities.
• Encampment – means that refugee camps are purpose-built
and administered by UNHCR and/or host governments.
Food, water, and services such as schooling and health
care are provided by relief agencies. Refugees in camps are
not expected to be self-sufficient, and camps are seldom
planned for long-term use or population growth. Host
governments and many relief agencies tend to prefer camps
not only because they make managing assistance easier,
34 Migration Information Source, 2003, Jacobsen, K, Local Integration:
The Forgotten Solution, https://www.migrationpolicy.org/article/local-
integration-forgotten-solution
35 Jacobsen, K, 2001. The forgotten solution: local integration for
refugees in developing countries. New Issues in Refugee Research,
Working Paper No. 45
36 ibid
24. Kalobeyei Socio-Economic and Mapping Baseline Survey Report, 201610
Local Integration through Policy and Pro-active Intervention in Uganda: The case of Uganda’s Refugee and Host Population
Empowerment (ReHoPE) Strategic Framework: A People-Centred Approach to Sustainable Economic EmpowermentBox 1
ReHoPE is a self-reliance and resilience strategic framework targeting refugees and host communities in Uganda’s nine refugee hosting districts. It is a five-year
commitment which recognises the need for creative durable solutions. It is in line with humanitarian principles and has a special focus on self-reliance and
resilience of refugees and host communities alike.Through a holistic approach, ReHoPE addresses the sustainable development of the host country on a district
level and enhances refugee protection.
The ReHoPE strategy provides the basis for proposed joint programming of up to $350 million over five years, involving UN agencies, the World Bank,
the Government of Uganda, development partners and the private sector. Through a multi-sectoral partnership, new development programming focused on
improving social services and enhanced livelihoods will enable refugees and host communities to meet their immediate needs and prepare them for future
shocks. It is also envisaged that support for self-reliance and resilience will serve refugees equally in the event of a prolonged stay in Uganda, as well as upon
their eventual return to their countries of origin.
ReHoPE is expected to deliver:
1. Sustainable livelihoods, based on:
a) Modernized agricultural practices and improved market linkages
b) Market-driven technical skills and small-scale enterprise.
2. Integrated and Sustainable Social Service Delivery with District Local Government systems focused particularly on the health and education
sectors.
3. Community and system resilience based on dialogue and peaceful co-existence.
4. Protection including emergency response.
5. Preserve equal and unhindered access to territory and protection space and promote the full enjoyment of rights, while maintaining the civilian character
of asylum.
6. Preparing refugees for solutions, such as building knowledge, skills, and capacities for refugees when they return home.
Several initiatives and activities have been launched in support of ReHoPE, including:
a) OPM-WFP-UNHCR Joint Project for Self-Reliance – a partnership targeting 3,500 refugee and host community households in agriculture and non-
farm income generating activities.
b) Koboko Partnership – a public-private partnership targeting 7,500 refugee and host community households in modern, commercial-scale agriculture.
c) Yunus Social Business – a social entrepreneurship initiative designed to empower and capacitate youth in refugee and host communities.
d) The Enhanced Japan-UNHCR Uganda Partnership – a comprehensive partnership with JICA, the Embassy of Japan, and private sector actors that
supports rice value chain upgrading, vocational training, and rehabilitation and construction of vital infrastructure.
REHoPE’s expected outcomes include both enhancing social cohesion and coexistence, and building knowledge, skills and capacities for both refugees and
host communities, to be applied in the long term.
but also because they are believed to facilitate repatriation.
This belief exists because austere camp conditions make
staying less attractive.
• Organised or local settlements – which are planned,
segregated enclaves or villages created specifically for
refugees, but which differ from camps in that refugees
are expected to become self-sufficient pending their
repatriation. There is limited freedom of movement
outside official areas of residence, more permanent
housing construction, and access to land provided by
the government.
In instances where refugees acquired citizenship through
naturalization, statistical data are often limited, as countries may
not distinguish between the naturalization of refugees and that of
non-refugees. Thus, many gaps and challenges exist in measuring
local integration by the number of naturalized refugees, and the
reported number of naturalized refugees in a given period is
not a true reflection of local integration. In 2015, 28 countries
reported at least one naturalized refugee, two countries more
than the previous year. The total number of naturalized refugees
was 32,000 in 2015, compared to 32,100 in 2014.
Local integration requires thinking beyond refugee-host
community dynamics, particularly because the long-term
sustainability of integrated neighbourhoods is multi-tiered. There
are horizontal tensions (between hosts and refugees) and vertical
tensions (between the communities and those who govern and
administer them). Micro-level opportunities (e.g. economic
competition, employment) generate horizontal tensions, while
macro level issues such as distribution of services among various
parties and leadership disjuncture contribute to vertical tensions.
There is evidence of this phenomenon in Kakuma37
.
2.3 Other Initiatives which may Impact on
KISEDP
2.3.1 The Lamu Port-Southern Sudan-Ethiopia
Transport (LAPSSET) Corridor
The LAPSSET Corridor Program is a flagship regional project
intended to provide transport and logistics infrastructure which
will lead to seamless connectivity between the Eastern African
37 Aukot, E. 2003. “It is Better to be a Refugee Than a Turkana in
Kakuma: Revisiting the Relationship between Hosts and Refugees in
Kenya.” Global Movements for Refugees and Migrant Rights. 21.3
(2003); 73-83.
26. Kalobeyei Socio-Economic and Mapping Baseline Survey Report, 201612
• States’ obligations, including cooperating with UNHCR
in the exercise of its functions and facilitating its duty of
supervising the application of the Convention.
By acceding to the Protocol, States agree to apply most of the
articles of the Refugee Convention (Articles 2 through 34) to
all persons covered by the Protocol’s refugee definition. Yet the
vast majority of States have preferred to accede to both the
Convention and the Protocol. In doing so, States reaffirm that
both treaties are central to the international refugee protection
system39
.
2.4.3 1969 Organization of African Unity (OAU)
Convention Governing the Specific Aspects of
Refugee Problems in Africa
The conflicts that accompanied the end of the colonial era in
Africa led to a succession of large-scale refugee movements.
These population displacements prompted the drafting and
adoption of not only the 1967 Refugee Protocol but also the
1969 OAU Convention Governing the Specific Aspects of
Refugee Problems in Africa. Asserting that the 1951 Refugee
Convention is “the basic and universal instrument relating to
the status of refugees”, the OAU Convention is, to date, the
only legally binding regional refugee treaty.
Perhaps the most important portion of the OAU Convention
is its definition of a refugee. The OAU Convention follows the
refugee definition found in the 1951 Convention, but includes
a more objectively based consideration: any person compelled
to leave his/her country because of “external aggression,
occupation, foreign domination or events seriously disturbing
public order in either part or the whole of his country of
origin or nationality”. This means that persons fleeing civil
disturbances, widespread violence and war are entitled to
claim the status of refugee in States that are parties to this
Convention, regardless of whether they have a well-founded
fear of persecution (UNHCR& IPU, Undated).
2.4.4 Government of Kenya Refugees Act 2006
Until 2006, Kenya had no law exclusively addressing the status
and rights of refugees. The development of the refugee law
was more informed by security concerns than protection
considerations40
. The Refugees Act of 2006, which became
39 UNHCR & IPU (Undated), Refugee Protection: A guide to International
Refugee Law, http://www.ipu.org/pdf/publications/refugee_en.pdf
40 Maina, A. 2016. Development of Refugee Law in Kenya,
http://www.worldpolicy.org/blog/2016/03/29/development-refugee-
law-kenya
operational in 2007, defined refugee status replete with
exclusion and cessation clauses. It also outlined the rights
and duties of refugees and asylum-seekers. The act defines a
refugee as a person;
• owing to a well-founded fear of being persecuted for
reasons of race, religion, sex, nationality, membership of
a particular social group or political opinion is outside the
country of his nationality and is unable or, owing to such
fear, is unwilling to avail himself of the protection of that
country; or
• not having a nationality and being outside the country of
his former habitual residence, is unable or, owing to a well-
founded fear of being persecuted for any of the aforesaid
reasons is unwilling, to return to it.
The Act further established institutions that would manage
refugee affairs in the country. These include the Department
of Refugee Affairs, the Refugee Affairs Committee, and the
Refugee Affairs Board. It incorporated the provisions of
relevant international conventions into the domestic legislative
framework. Refugees have the right to access work permits,
seek and gain employment, or start a business.
While the law provided the right to work and access work
permits, it restricted the movement of refugees. Refugees
were required to reside in refugee camps unless they had
authorization to live elsewhere. Work permits were only
granted in Nairobi, so refugees had limited access to these
documents, which also did not enable refugees to apply for
authorization. Those who decided to live and work in urban
areas without authorization often did so under a constant
threat of harassment and intimidation.
Another limitation of the Refugee Act is that it does not define
how refugees should live in harmony with other Kenyans, nor
does it clearly articulate the legal framework upon which local
integration can be achieved. The Act also does not clearly
define dispute resolution mechanisms, where disputes occur
between hosts and refugees, and does not define how to
resolve tensions within refugee communities, which often spill
over to the local community. Aspects such as allocation of land
for refugees fall under different laws such as the Communal
Land Act. This governs community land such as the land on
which the Kalobeyei New Site is situated. It is hoped that
on-going revisions of the Act will address issues impeding
attainment of sustainable solutions to the refugee crisis, while
conforming to international law.
29. Chapter 3: Study Area and Methodology
Chapter
the county in the recent past. Key attractions to Turkana include
Sibiloi National Park, Lake Turkana, and two islands on the lake
that migratory birds use as a stopping ground41
.
The headquarters for Turkana County is Lodwar town, which is
also the biggest town in North-Western Kenya. The town is a
commercial centre whose principal activities are fish trade and
basket weaving.
3.2.2 Local Context – Kakuma and Kalobeyei
Kakuma
The history of Kakuma as an administrative area dates back
to 1992 when it was demarcated as part of Turkana District
within Rift Valley Province, through the Districts and Provinces
Act of 1992. Today, the area largely known as Kakuma falls
within two wards, Kakuma and Lopur wards, which are both
within Turkana West sub-county, Turkana County. The area is
home to Kakuma Refugee Camp. Most of the land in the larger
Kakuma area is unsettled, and is largely used for herding by the
pastoral Turkana community, who often move from one place
to another with their animals in search of pasture and water.
The development of Kakuma is largely associated with the
settlement of refugees in the area today known as Kakuma
Refugee Camp. The camp was established in 1992 owing
to the plight of about 30,000 to 40,000 Sudanese “walking
boys” or “lost boys” who were forcefully returned to Sudan
when the Ethiopian regime of Mengistu was toppled in 1991.
The “boys” walked through the wilderness and wandered into
Kenya42
,43
.Through the 1990s, Kakuma Camp experienced
a large influx of population coming from Sudan, Ethiopia,
Eritrea and other conflict areas in the Horn of Africa region.
The closure of the Kenya coastal camps in 1997 also meant
resettlement of some of the refugees to Kakuma, necessitating
the creation of Kakuma II and III44
. Increased conflict in the
horn of Africa region through the 1990s and early 2000s
further increased the number of refugees arriving at Kakuma,
leading to the expansion into Kakuma III in the early 2000s,
and construction of Kakuma IV starting in 2012. In just about
two and half decades, the population of Kakuma has grown to
163,192 (as of September 2016)45
.
41 Turkana County Government Webpage, http://www.turkana.go.ke/
42 Assets WUSC California, Kakuma Camp Profile, Student
Refugee Program, http://assets.wusc.ca/Website/Resources/
StudentRefugeeProgram/kakumacamp.pdf
43 Aukot, E. 2003. “It is Better to be a Refugee Than a Turkana in
Kakuma: Revisiting the Relationship between Hosts and Refugees in
Kenya.” Global Movements for Refugees and Migrant Rights. 21.3
(2003); 73-83
44 ibid
45 UNHCR 2016.Kakuma Camp population 2016-09-30. Available
online at http://data.unhcr.org/horn-of-africa/documents.
php?page=1&view=grid&Settlement%5B%5D=17
3.1 Introduction
The Horn of Africa region has experienced a rapid refugee
surge in recent years, and the situation is likely to intensify. This
will not only expose millions of people to forced displacement,
but also complicate already strained hosting situations. Based
on global trends, local integration is the most promising option
for hosting the new refugees, a solution that will help nations
tap into the potential of the refugees, and assuage growing
tensions between refugees and host communities.
In Kenya, and specifically Kakuma and Kalobeyei New
Settlement, the proposed integration approach by UNCHR
needs to be thoroughly deliberated in collaboration with the
host community, to promote a greater cohesive approach to
implementing suggested improvements. In the subsequent
parts of this report, we borrow from some of the experiences
highlighted in this section to compare and contrast findings from
the Socio-Economic Survey, in a bid to inform the planning for the
Kalobeyei Integrated Socio-Economic Development Programme.
This chapter presents the study area and the methodology used
for data collection. Part one presents the two study sites, Kalobeyei
and Kakuma, within the larger Turkana County context, discusses
variousboundarydelimitationalternativesavailableinthearea,and
the adopted data collection unit - together with the justification
for the same. Part two discusses the methodology used in the
collection of both socio-economic and spatial data, in particular
the type and nature of indicators used for data collection, the data
collection tools, respondent categories, sampling techniques, the
sampling frame and analytical techniques used.
3.2 The Study Area
3.2.1 Sub-National Context - Turkana County
Overview
The name Turkana is widely believed to be a corruption of
Turkwen which means ‘cave people’ in Kiturkana, the language
of the Turkana people. Turkana County, located to the North
West of Kenya measures 77,000 sq. km, which is about 13%
of the country’s land area. The county shares its borders with
four others; Marsabit to the East, Samburu to the south-east,
and Baringo and West Pokot to the south-west. Internationally,
Turkana County borders South Sudan to the north, Uganda to
the west and Ethiopia to the north-east.
The weather in Turkana County is warm and hot, with unreliable
rainfall pattern ranging between 300mm and 400mm per
annum. Most residents of Turkana County depend on nomadic
pastoralism and fishing as a major source of their livelihoods.
Fishing is practised in the waters of Lake Turkana. Small-scale
farming is also practised in different parts of the county. Oil reserves
and huge underground water reservoirs have been discovered in