Sliding from imagery realism to topographic abstraction
•
0 likes•13,126 views

This document summarizes a presentation given at the 27th International Cartographic Conference in Rio de Janeiro, Brazil from August 23-28, 2015. The presentation discusses creating a "Cartographic Continuum" which provides a design method to enable users to choose hybrid representations between raster (imagery) and vector (map) data. It describes determining pivot symbolizations and interpolating symbolization parameters to allow local adaptation and create a graphic path between two symbolizations.

Recommended
Recommended
More Related Content
More from Charlotte Hoarau
More from Charlotte Hoarau (6)
Recently uploaded
Recently uploaded (20)
Sliding from imagery realism to topographic abstraction
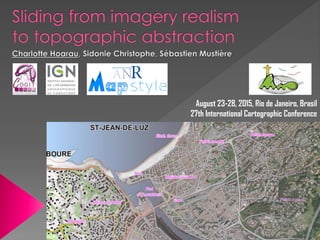
- 1. August 23-28, 2015, Rio de Janeiro, Brasil 27th International Cartographic Conference
- 2. ICC 15 Charlotte Hoarau Raster Data Vector Data 24.08.15 2
- 3. ICC 15 Charlotte Hoarau Hybrid representations Interactive geovisualization tools© Géoportail, IGN © Swiss Topo © The Smithonian 24.08.15 3
- 4. ICC 15 Charlotte Hoarau Various graphic design Poor legibility 24.08.15 4
- 5. ICC 15 Charlotte Hoarau Providing a design method to create Cartographic Continuum Enabling the user to choose an in-between representation Topographic Map Imagery 24.08.15 5
- 6. ICC 15 Charlotte Hoarau From the map From the imagery Procedural rendering methods 24.08.15 6
- 7. ICC 15 Charlotte Hoarau Cartographic readability Graphic continuity Visual heterogeneity 24.08.15 7
- 8. ICC 15 Charlotte Hoarau Local adaptation of vector symbolizations Cartographic readability Graphic continuity Visual heterogeneity Symbolization interpolation 24.08.15 8
- 9. Preservation of vector data legibility Poor legibility Too much saliency Control of the visual saliency 9
- 10. ICC 15 Charlotte Hoarau Determining a graphic context Selecting a contrasted color Symbolizing feature outline Extracting the main color 24.08.15 10
- 13. How to create a graphic path between two symbolizations ? Imagery Map 13
- 14. ICC 15 Charlotte Hoarau Imagery Map ? 24.08.15 14
- 15. ICC 15 Charlotte Hoarau Determining pivot symbolizations 24.08.15 15
- 16. ICC 15 Charlotte Hoarau Using endings visual properties 24.08.15 16
- 17. ICC 15 Charlotte Hoarau Using endings visual properties 24.08.15 17
- 18. ICC 15 Charlotte Hoarau Determining pivot symbolizations 24.08.15 18
- 19. ICC 15 Charlotte Hoarau Determining pivot symbolizations Interpolating symbolization parameters 24.08.15 19
- 20. ICC 15 Charlotte Hoarau Applied to the hydrography Map color Imagery main color 24.08.15 20
- 21. ICC 15 Charlotte Hoarau Applied to buildings Plain color Transparent color 24.08.15 21
- 22. ICC 15 Charlotte Hoarau Applied to the vegetation Procedural texture Plain color 24.08.15 22
- 23. ICC 15 Charlotte Hoarau How to choose & order pivot symbolizations? How to combine interpolations? How to synchronize cartographic themes ?24.08.15 23
- 24. ICC 15 Charlotte Hoarau How to choose & order pivot symbolizations? How to combine interpolations? How to synchronize cartographic themes ?24.08.15 24
- 25. ICC 15 Charlotte Hoarau How to choose & order pivot symbolizations? How to combine interpolations? How to synchronize cartographic themes ?24.08.15 25
- 26. GeOxygene Plugin How to configure symbolization interpolations ? 26
- 27. ICC 15 Charlotte Hoarau Imagery Map Couleur naturelle Texture naturelle 24.08.15 27
- 35. 35
- 36. ICC 15 Charlotte Hoarau Continuum design method 24.08.15 36
- 37. ICC 15 Charlotte Hoarau Providing various representations in the same visualization Allowing the user to interact with the continuum 24.08.15 37
- 38. August 23-28, 2015, Rio de Janeiro, Brasil 27th International Cartographic Conference This work is (partially) supported by the French National Research Agency : MapStyle project [ANR-12-CORD-0025]. ,