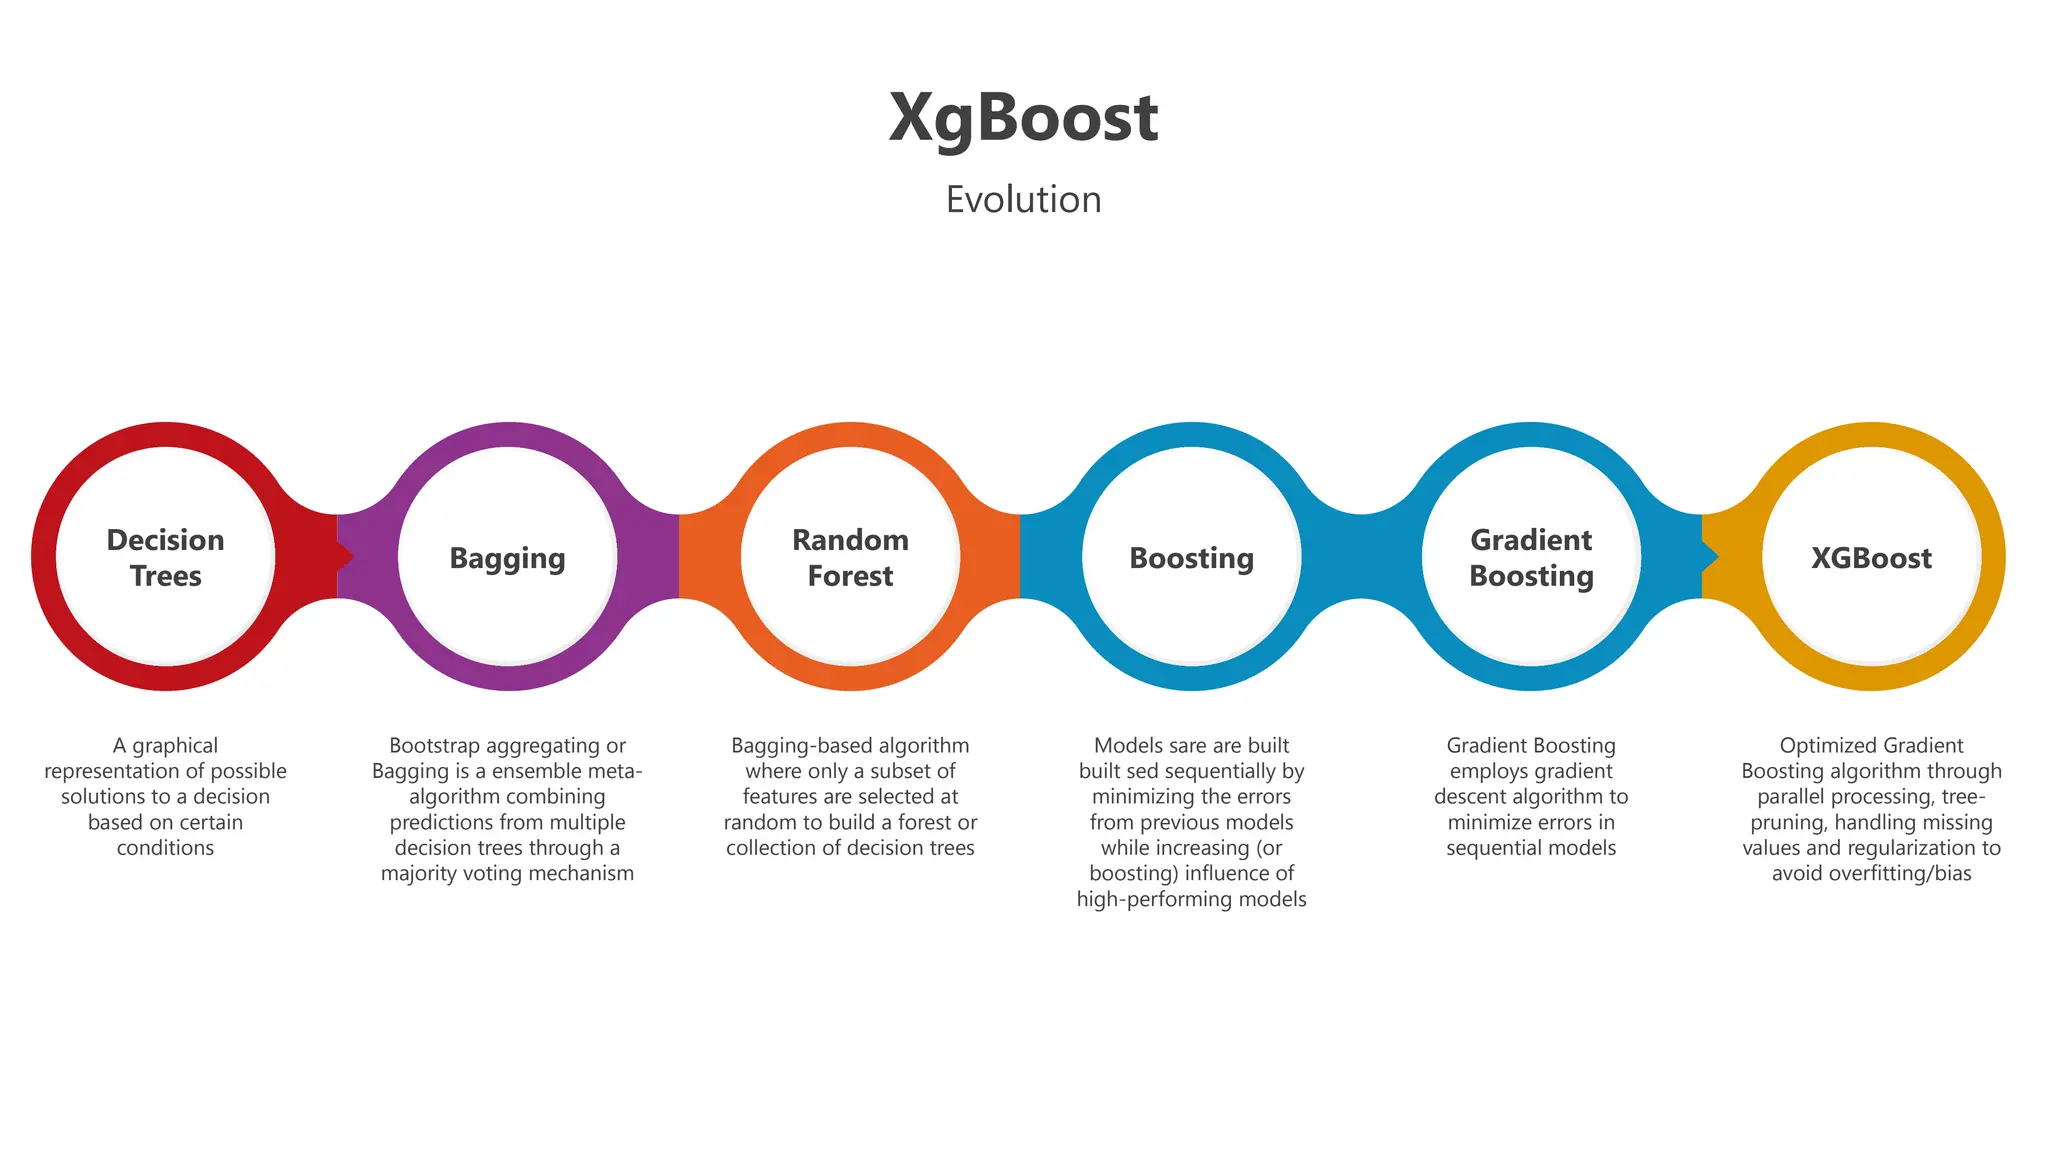
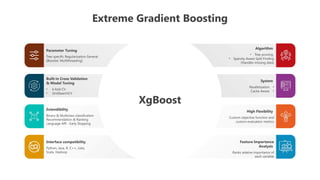
XgBoost
Evolution
Bagging
Decision
Trees
Random
Forest
Boosting XGBoost
Gradient
Boosting
A graphical
representationof possible
solutions to a decision
based on certain
conditions
Bootstrap aggregating or
Bagging is a ensemble meta-
algorithm combining
predictions from multiple
decision trees through a
majority voting mechanism
Bagging-based algorithm
where only a subset of
features are selected at
random to build a forest or
collection of decision trees
Gradient Boosting
employs gradient
descent algorithm to
minimize errors in
sequential models
Models sare are built
built sed sequentially by
minimizing the errors
from previous models
while increasing (or
boosting) influence of
high-performing models
Optimized Gradient
Boosting algorithm through
parallel processing, tree-
pruning, handling missing
values and regularization to
avoid overfitting/bias
2.
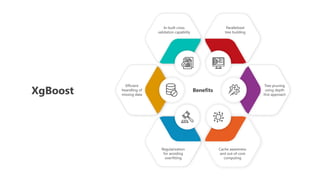
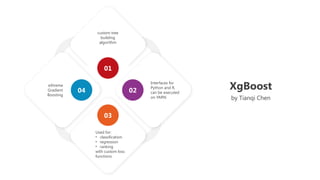
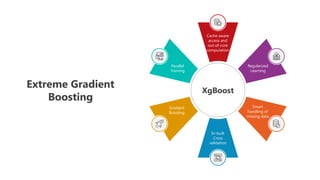
XgBoost
Parallelized
tree building
Tree pruning
usingdepth
first approach
Cache awareness
and out-of-core
computing
Regularization
for avoiding
overfitting
Efficient
heandling of
missing data
In-built cross
validation capability
Benefits
3.
custom tree
building
algorithm
Interfaces for
Pythonand R,
can be executed
on YARN
Used for:
• classification
• regression
• ranking
with custom loss
functions
eXtreme
Gradient
Boosting
01
03
04 XgBoost
by Tianqi Chen
02
01
04
You can addand edit some shapes to your presentation to present your data in a visual way.
● Choose your favourite infographic and insert it in your presentation using Ctrl C + Ctrl V or Cmd
C + Cmd V in Mac.
● Select one of the parts and ungroup it by right-clicking and choosing “Ungroup”.
● Change the color by clicking on the paint bucket.
● Then resize the element by clicking and dragging one of the square-shaped points of its
bounding box (the cursor should look like a double-headed arrow). Remember to hold Shift
while dragging to keep the proportions.
● Group the elements again by selecting them, right-clicking and choosing “Group”.
● Repeat the steps above with the other parts and when you’re done editing, copy the end result
and paste it into your presentation.
● Remember to choose the “Keep source formatting” option so that it keeps the design. For
more info, please visit Slideegg (Tips & Tricks).
How To Edit Shapes
9.
Terms Of Use(Free Users)
If you are a free subscriber, you should credit SlideEgg by keeping the “Thank You” slide.
Kindly refer to the following slide for the Terms of Use for premium users.
You can:
• Customize or edit this template
• Use this template for both business and personal endeavors.
You can not:
• Sell, rent, or second-license SlideEgg content or its altered version.
Promulgate, unless explicitly permitted, SlideEgg content, by SlideEgg.
• Incorporate SlideEgg content in any database or file online or offline.
• Obtain SlideEgg content’s copyright.
Kindly refer to our Tutorial page or FAQ for advanced slide modification guidelines.
10.
Terms Of Use(Premium Users)
Being a premium subscriber, you have the privilege of using this PPT template
without giving attribution to SlideEgg or keeping the “Thank You” slide.
You can:
• Customize or edit this template.
• Use this template for both business and personal endeavors.
• Circulate or share the editable format of this template with anyone you want.
You can not:
• Sell, rent or second-license SlideEgg content or the altered version of it.
Promulgate or include the templates in any other services database
• that performs as distribution or resale platform, unless explicitly permitted, by SlideEgg.
• Incorporate the elements used in SlideEgg templates separately.
• Obtain SlideEgg copyright for the elements used in this template as a logo or trademark.
Kindly refer to our Tutorial page or FAQ for advanced slide modification guidelines.
11.
www.slideegg.com
Thank You!
We respectyour valuable time with SlideEgg!
If you have any questions, please reach us
CREDIT: SlideEgg created this PowerPoint template.
Let this slide be kept for attribution.
Do you have a design request, please visit our Deckez site.