Download to read offline

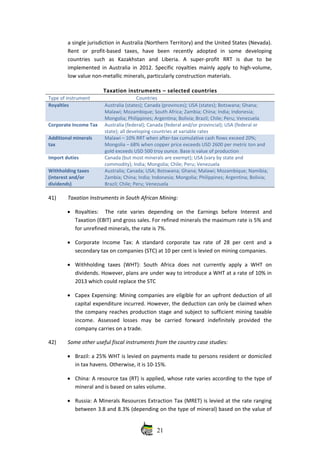
![are not viable due to an isolated location, or specific climate conditions (e.g. desert),
then relocation plans need to be developed.
9) LED‐ Mining Charter: Failure to comply with the community and worker conditions of
the Charter should trigger a suspension of the mining licence and, if not rectified
within a reasonable period, the concession should be cancelled. The MPRDA should be
amended to cater for this.
2.4 Proposals to Enhance the Developmental Impact through Regional Integration:
1) Larger markets for Linkages Industries: Although the South African minerals sector
constitutes a relatively large market for mineral inputs industries (backward
linkages), the southern African region (SADC) has a rapidly growing minerals inputs
market and significant future mineral potential. Most of the countries surveyed with
well‐developed linkages either have large domestic markets (China, Brazil) or are
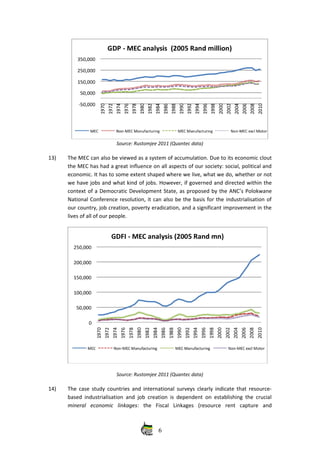
part of large regional markets such as EU, ASEAN and Mercosur. In this regard the
52nd
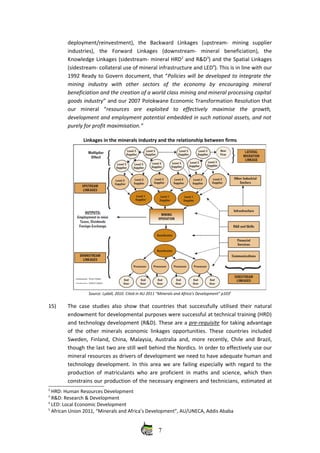
ANC National Conference resolved to build “stronger economic linkages across
the continent of Africa as a whole as a basis for increasing our market size through
deepened economic integration”51
. The viability of establishing supplier and
beneficiation industries (backward & forward linkages) would be substantially
enhanced by regional integration. “In this regard a special facility should be created
to promote investment in the sub‐continent”52
, through the proposed SWF Regional
Development Fund to invest in long‐term trade infrastructure across the southern
African region. Many countries in the region are displaying robust growth due to the
minerals “super‐cycle”. The NGP notes that “South Africa cannot succeed with
regional development without strong partnerships with other countries on the
continent. [The NGP] proposals centre on a strategy for improving logistics, with
clear priorities and timeframes... [including] ...measures to expand regional
investment and trade and develop integrated supply‐chains and industrial corridors
particularly in mining and agro‐processing; and reducing regulatory obstacles to
trade and travel.”53
In this regard industrial linkages potential would be greatly
enhanced by larger (regional) markets (economies of scale) and our government
should be mandated to progress the extension of membership of the Southern
African Customs Union (SACU), with a reassessment of the relevant import tariff
lines (infant industry protection), and the IDC should develop viable linkage industry
investments in other member countries to facilitate equitable benefits. This should
be pursued together with the proposed Regional Development Fund (trade related
infrastructure) to facilitate intra‐regional trade in mining inputs and outputs.
2) Competitive Mineral Feedstock Prices: A larger (regional) market could also facilitate
competitive pricing of mineral‐based intermediate products (and manufacturing
jobs) as “...the small size and relative isolation of our economy leads to monopolies
in certain sectors which could be overcome by increasing regional economic
51
See Annexure – ANC 52nd
Congress Economic Transformation Resolution, 2.12
52
RDP 2004, op cit, see Annexure, #12.
53
EDD 2010, NGP, p14.
50](https://image.slidesharecdn.com/sims-141202223439-conversion-gate01/85/Sims-50-320.jpg)


This document discusses maximizing the developmental impact of South Africa's mineral assets. It reviews South Africa's significant mineral resources and the country's history of mining. It discusses the ANC's policies regarding ensuring mineral resources benefit South Africans. The document conducted research including international case studies and stakeholder workshops. It proposes interventions in areas like ownership and control, governance, economic linkages, and regional impact to better leverage mineral wealth for growth, employment and equitable development in South Africa.