Download as PDF, PPTX
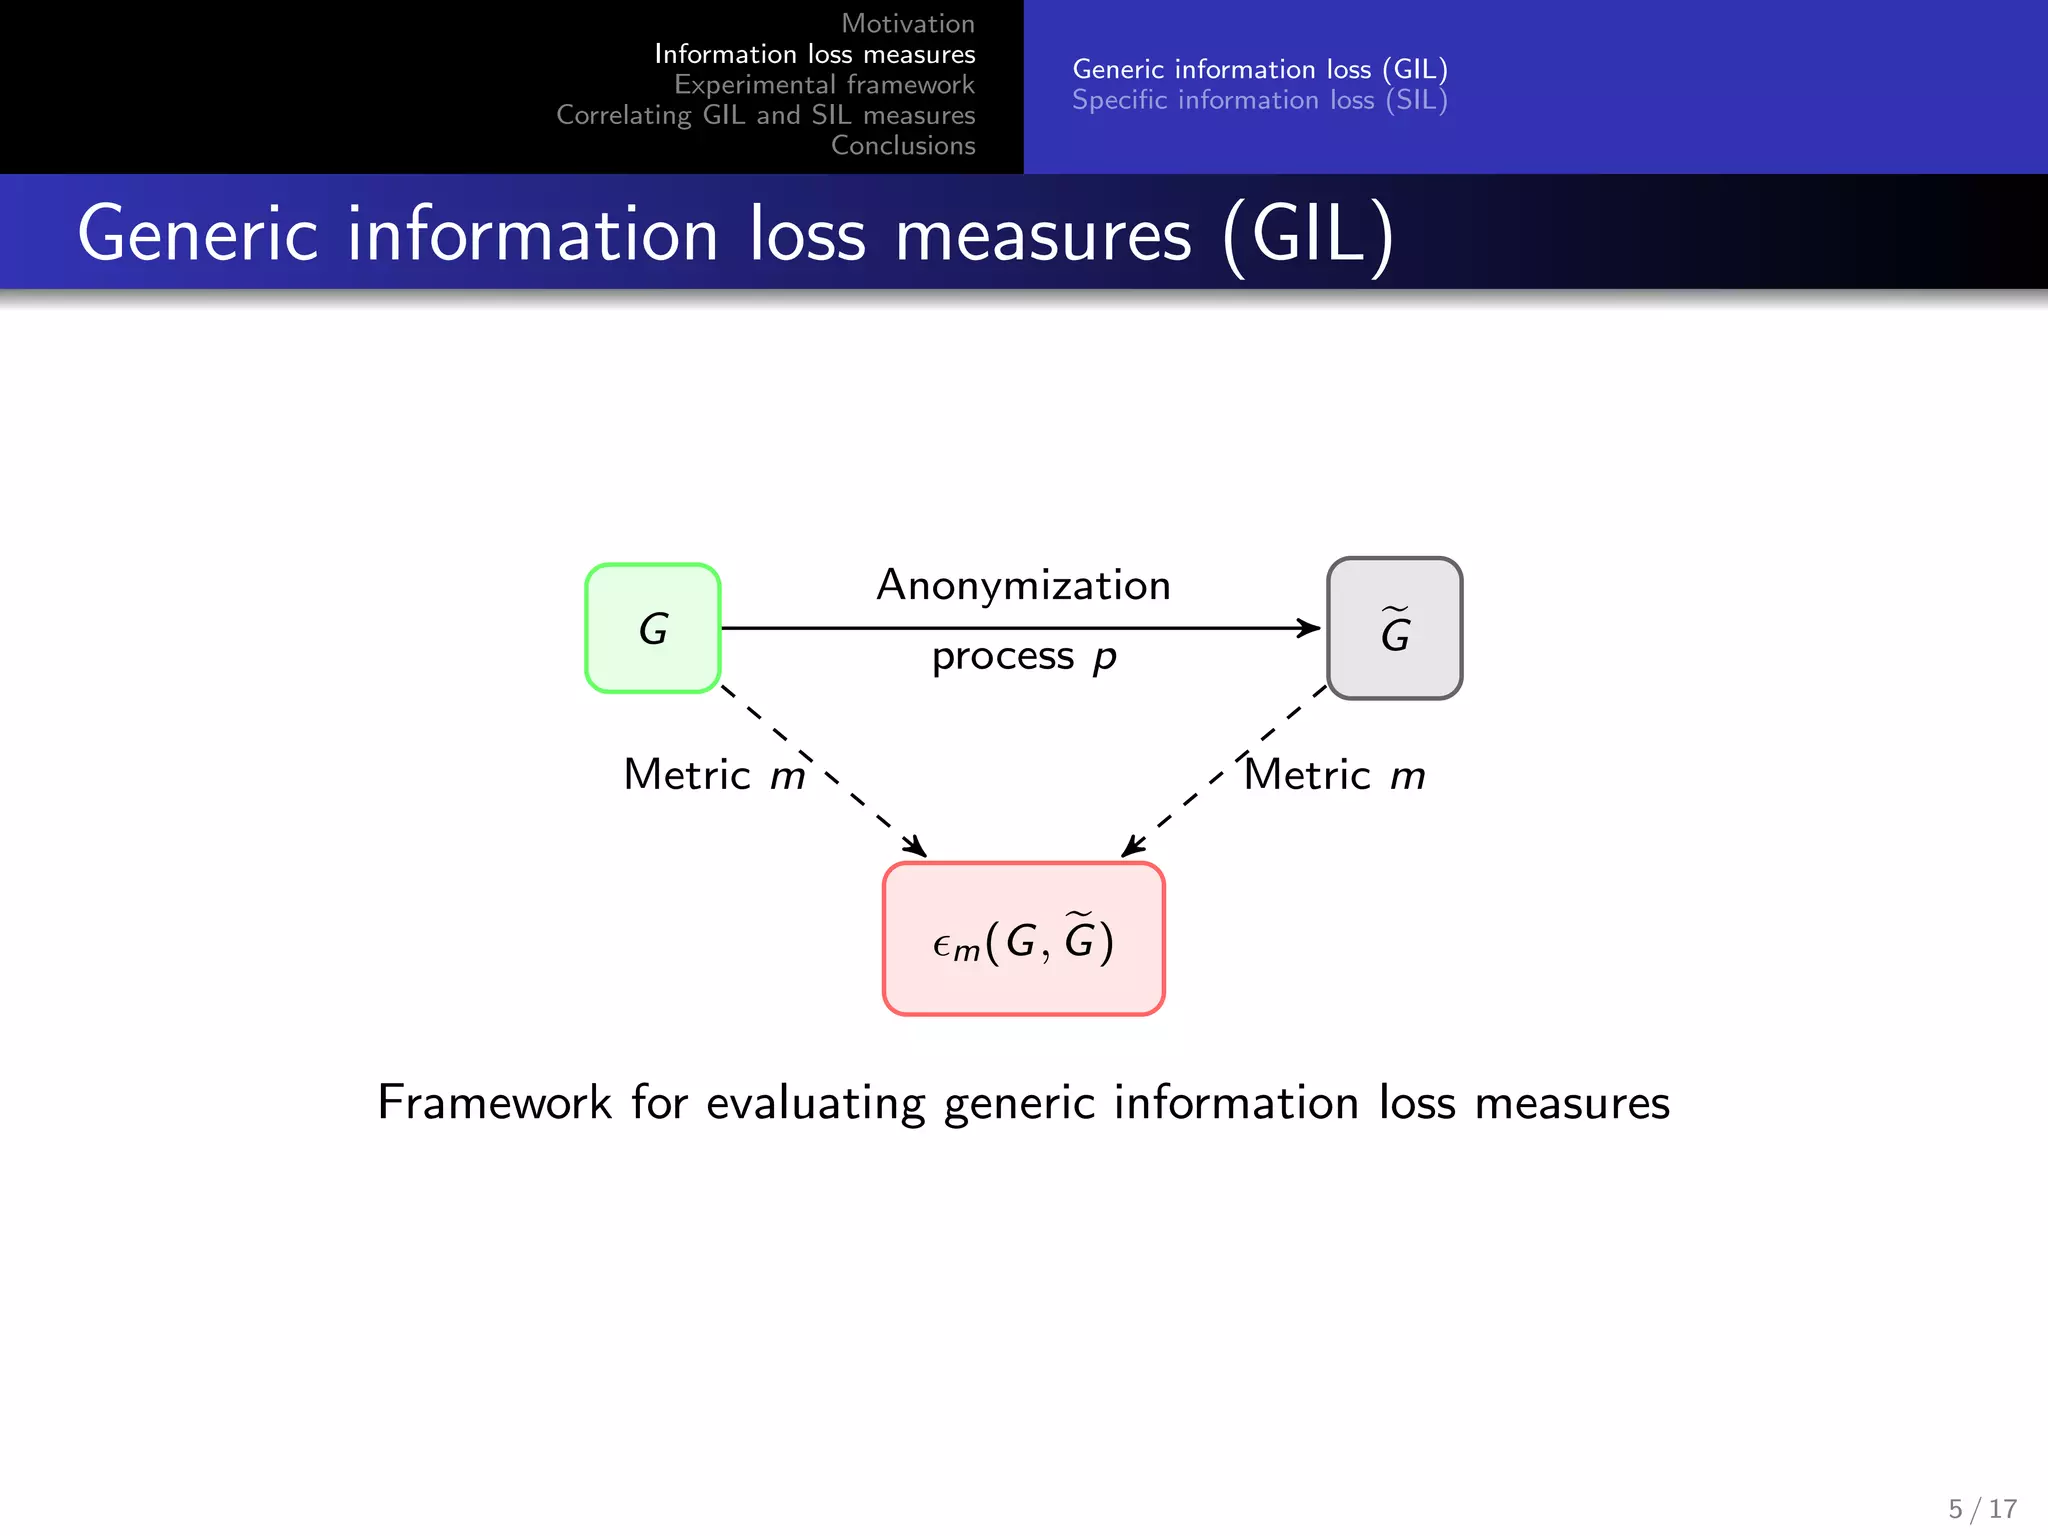
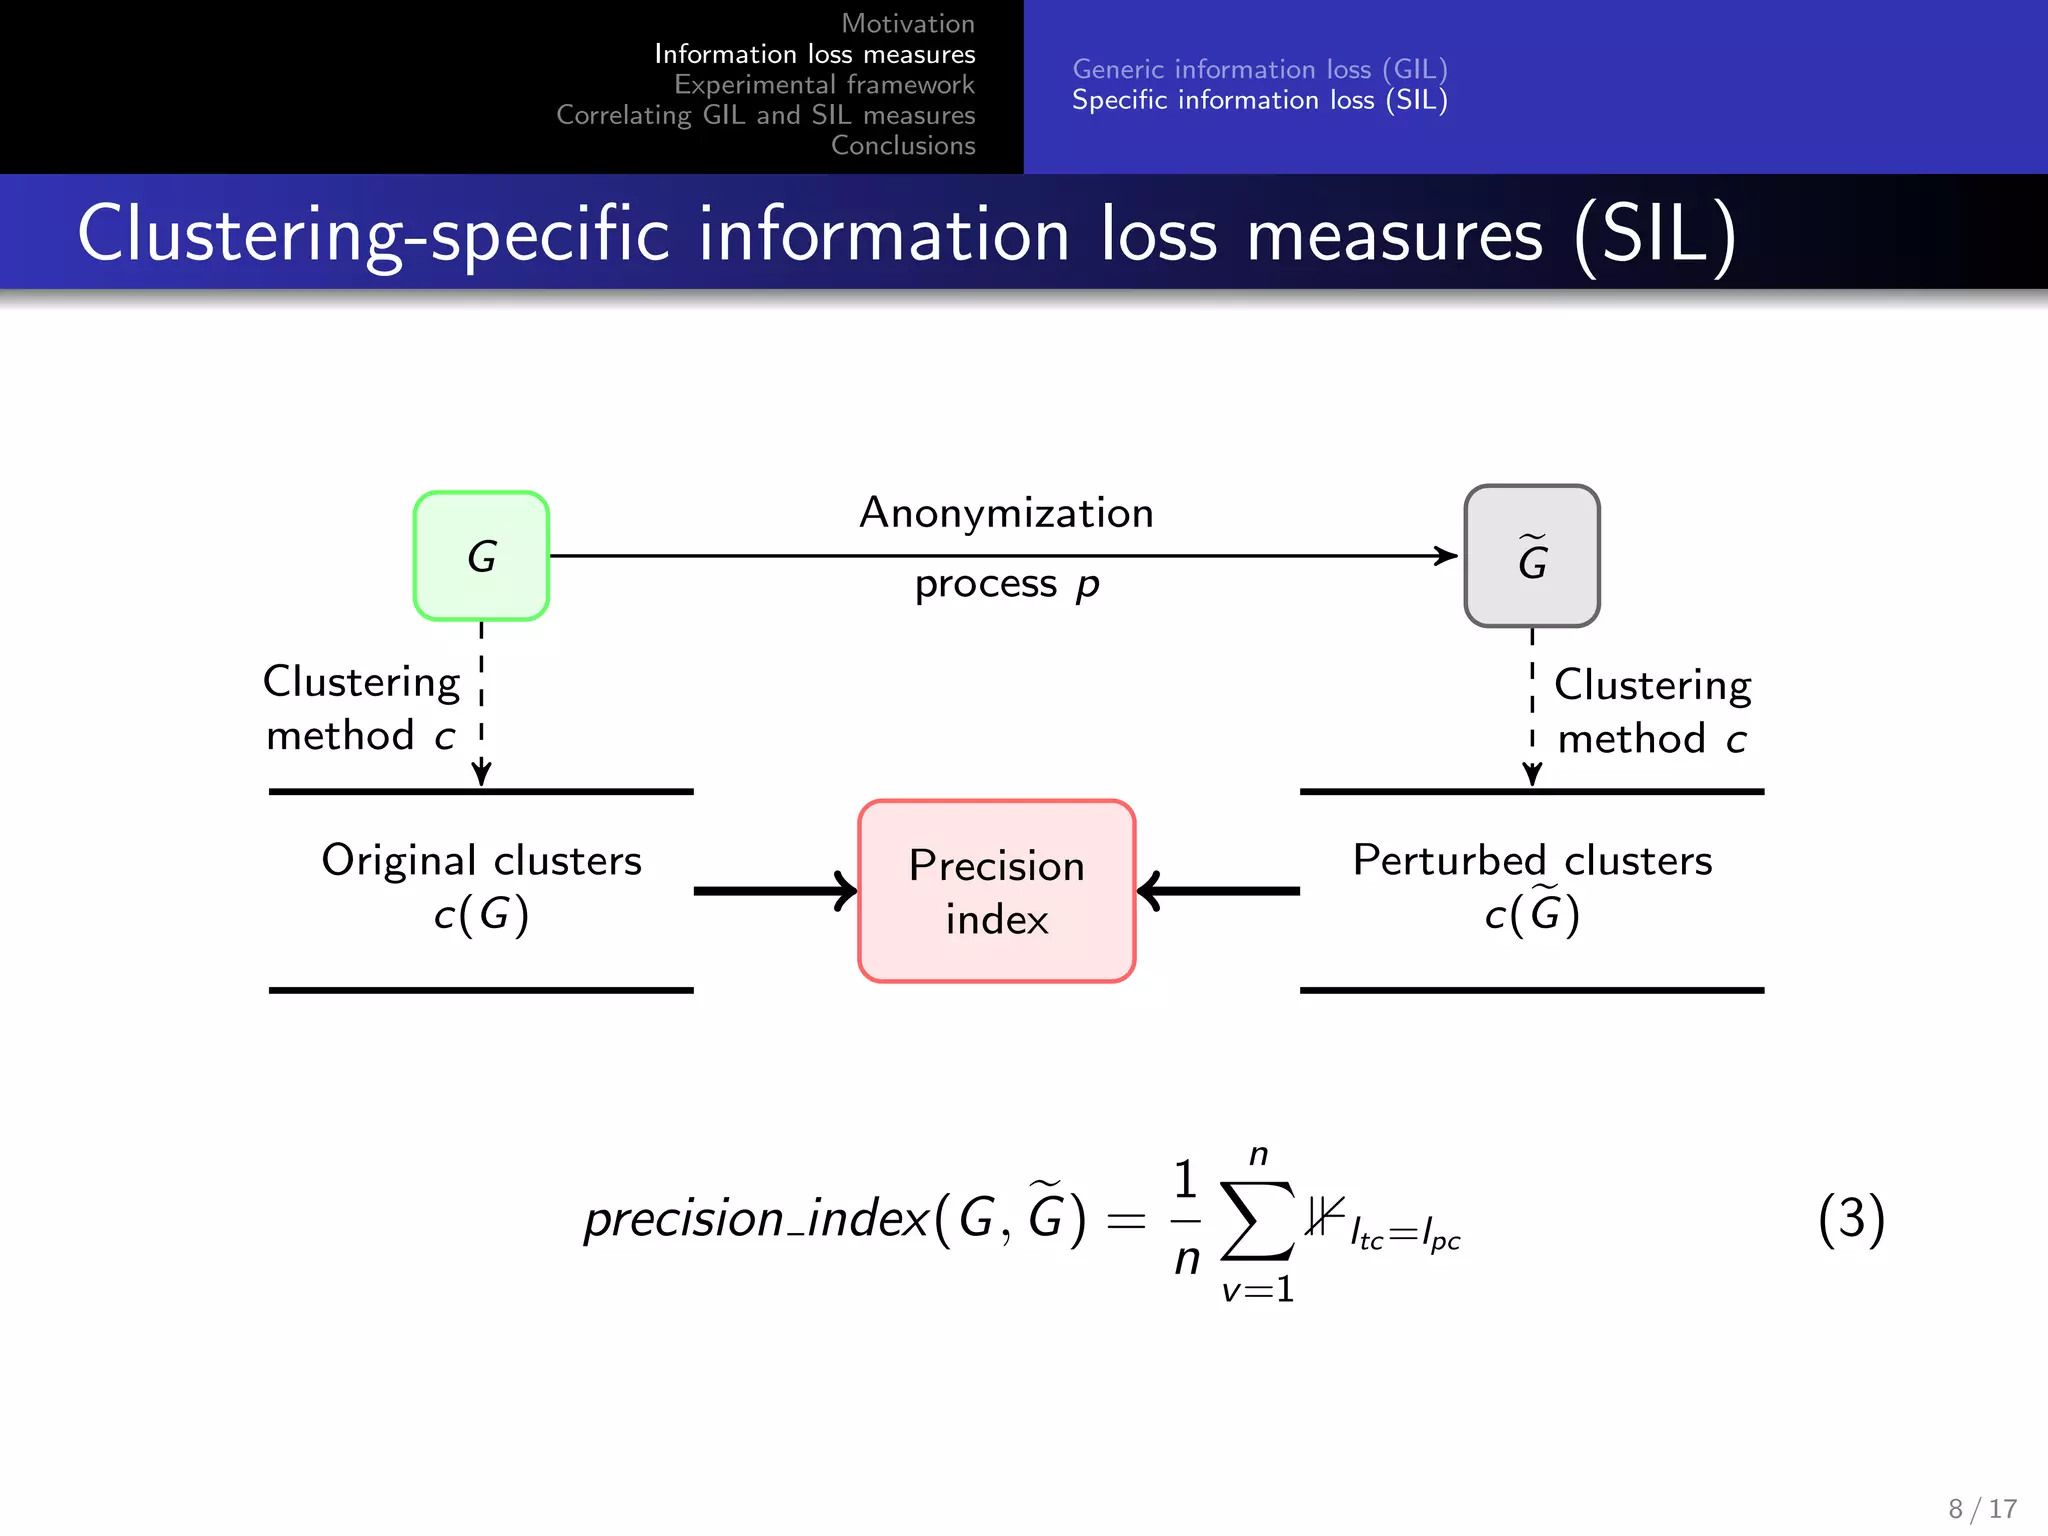
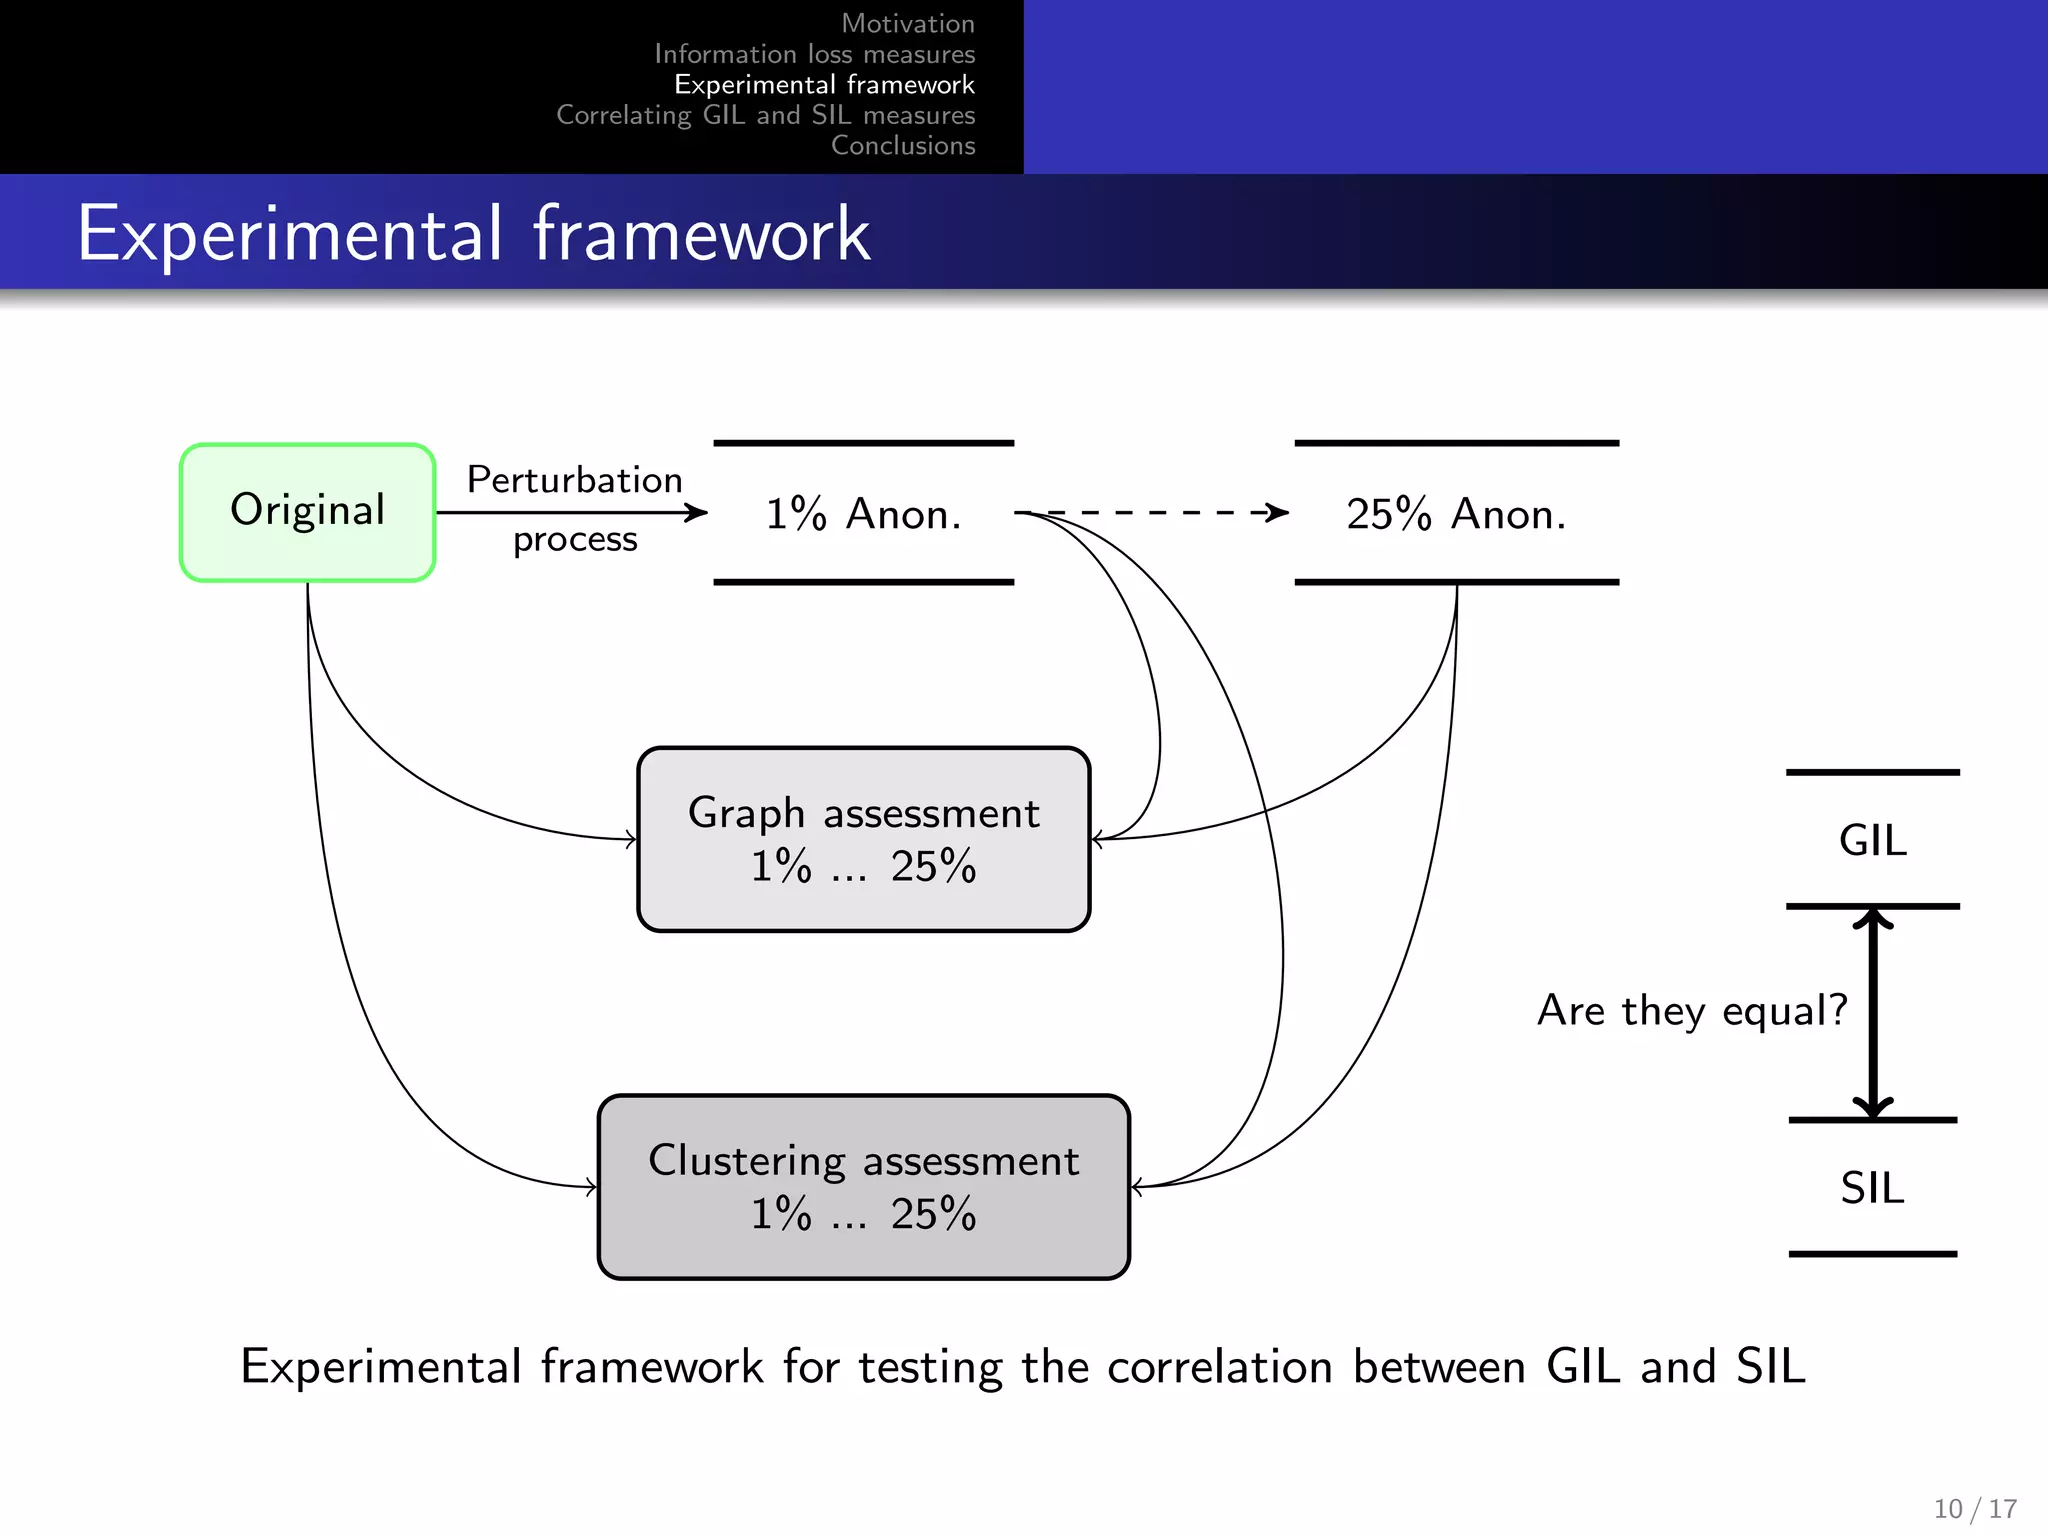
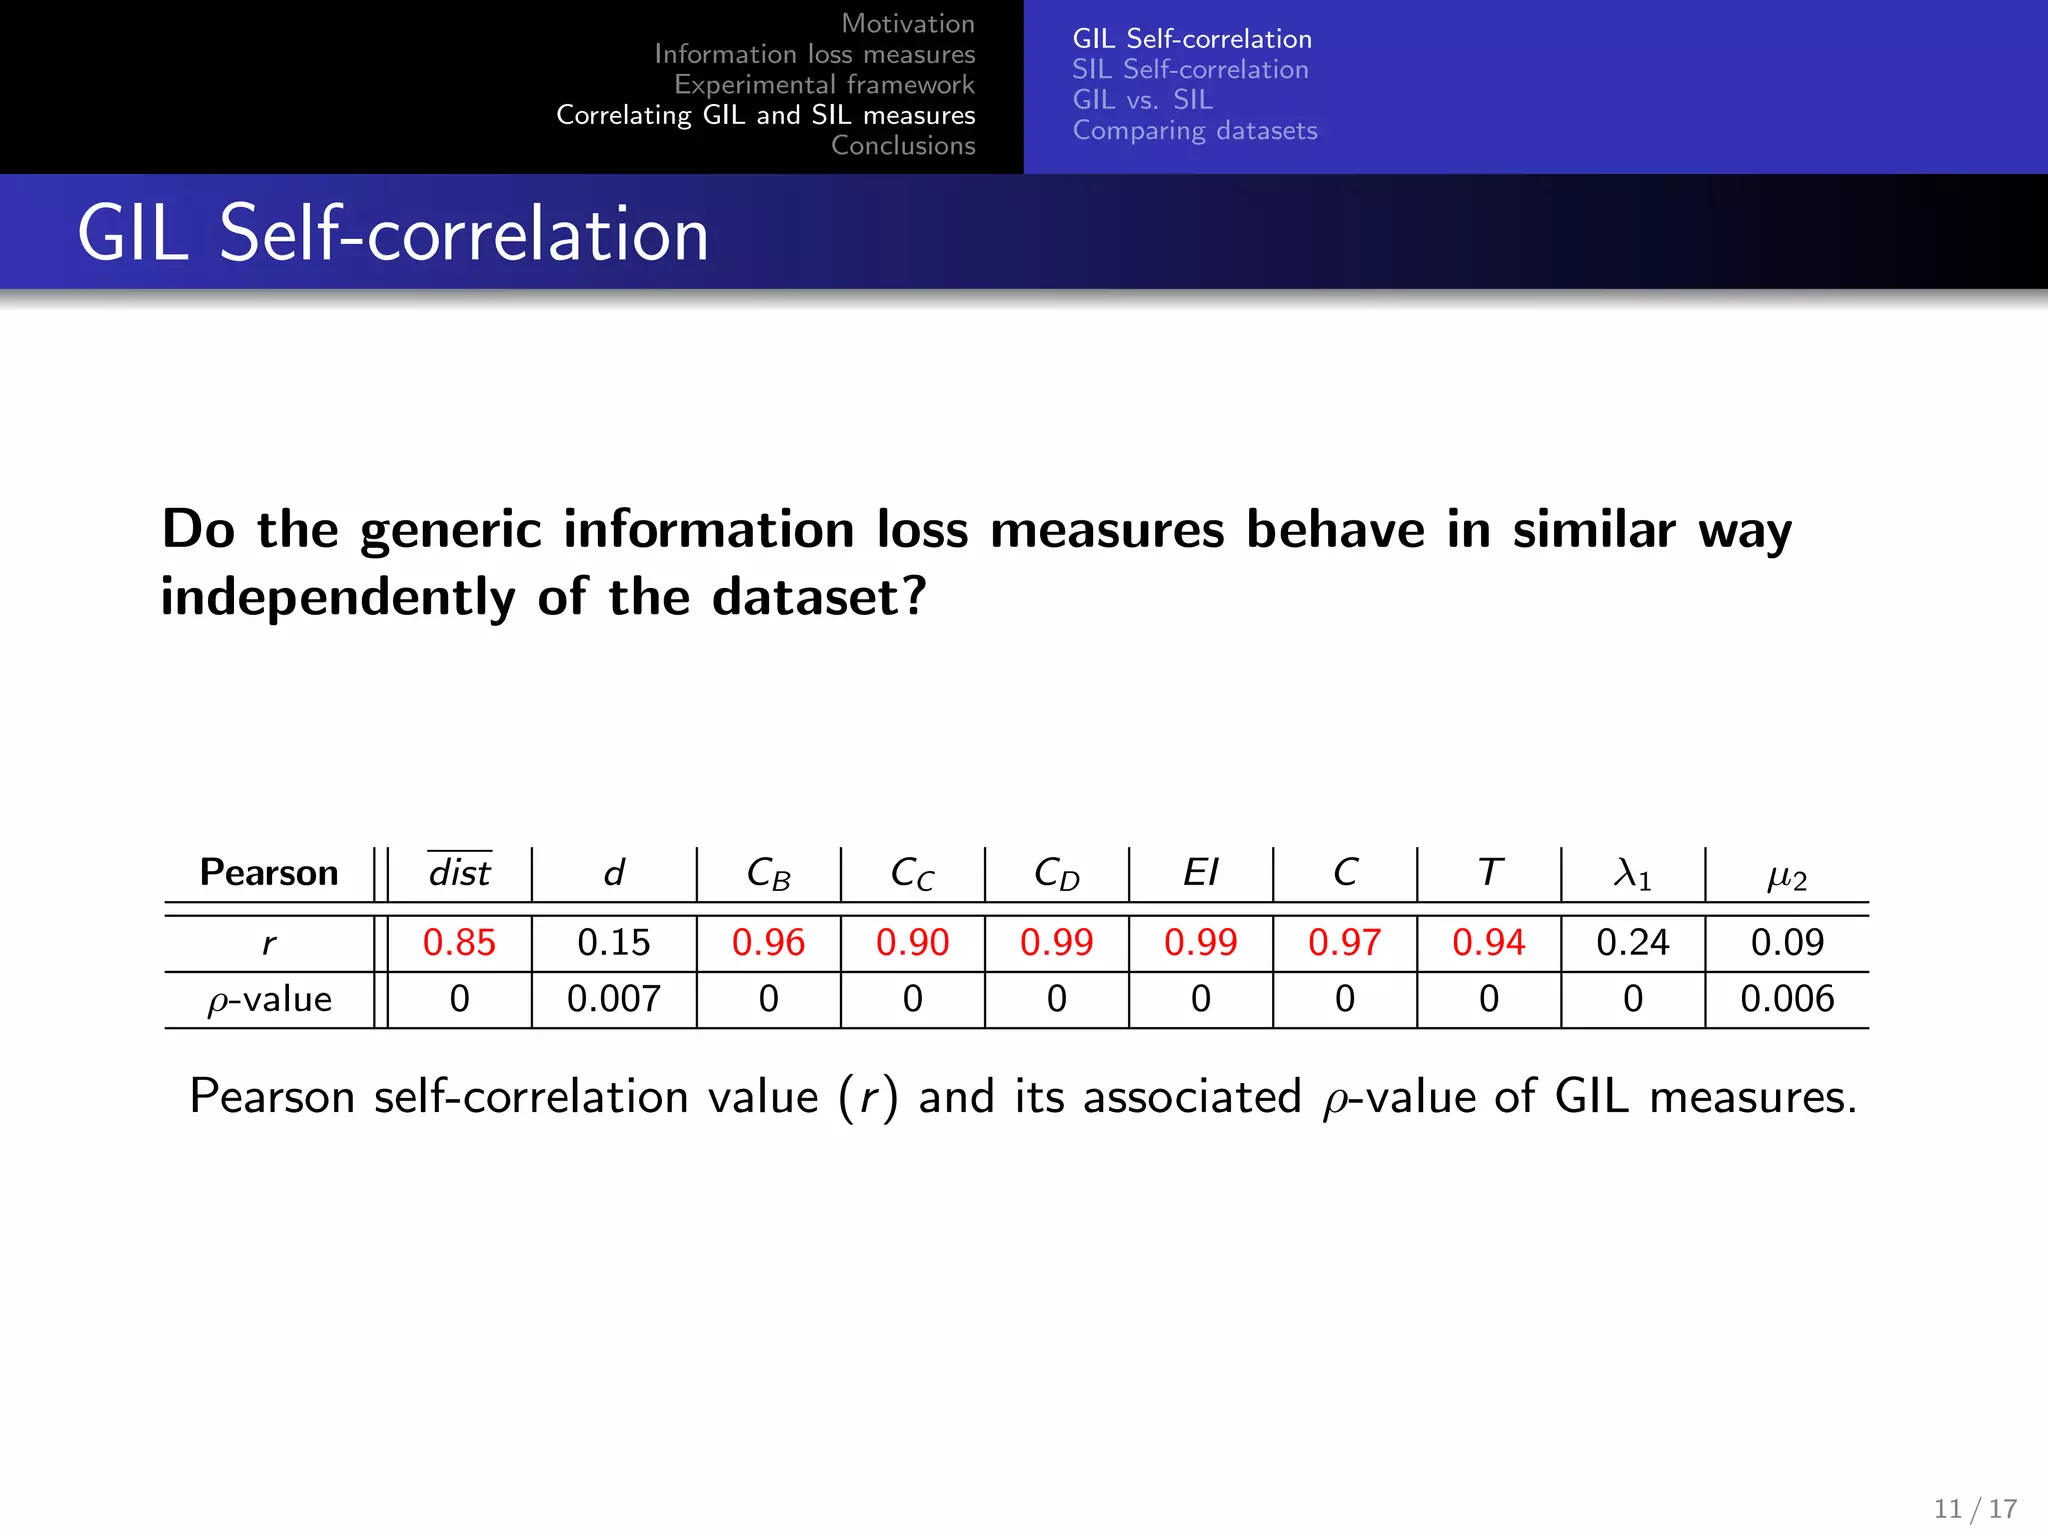
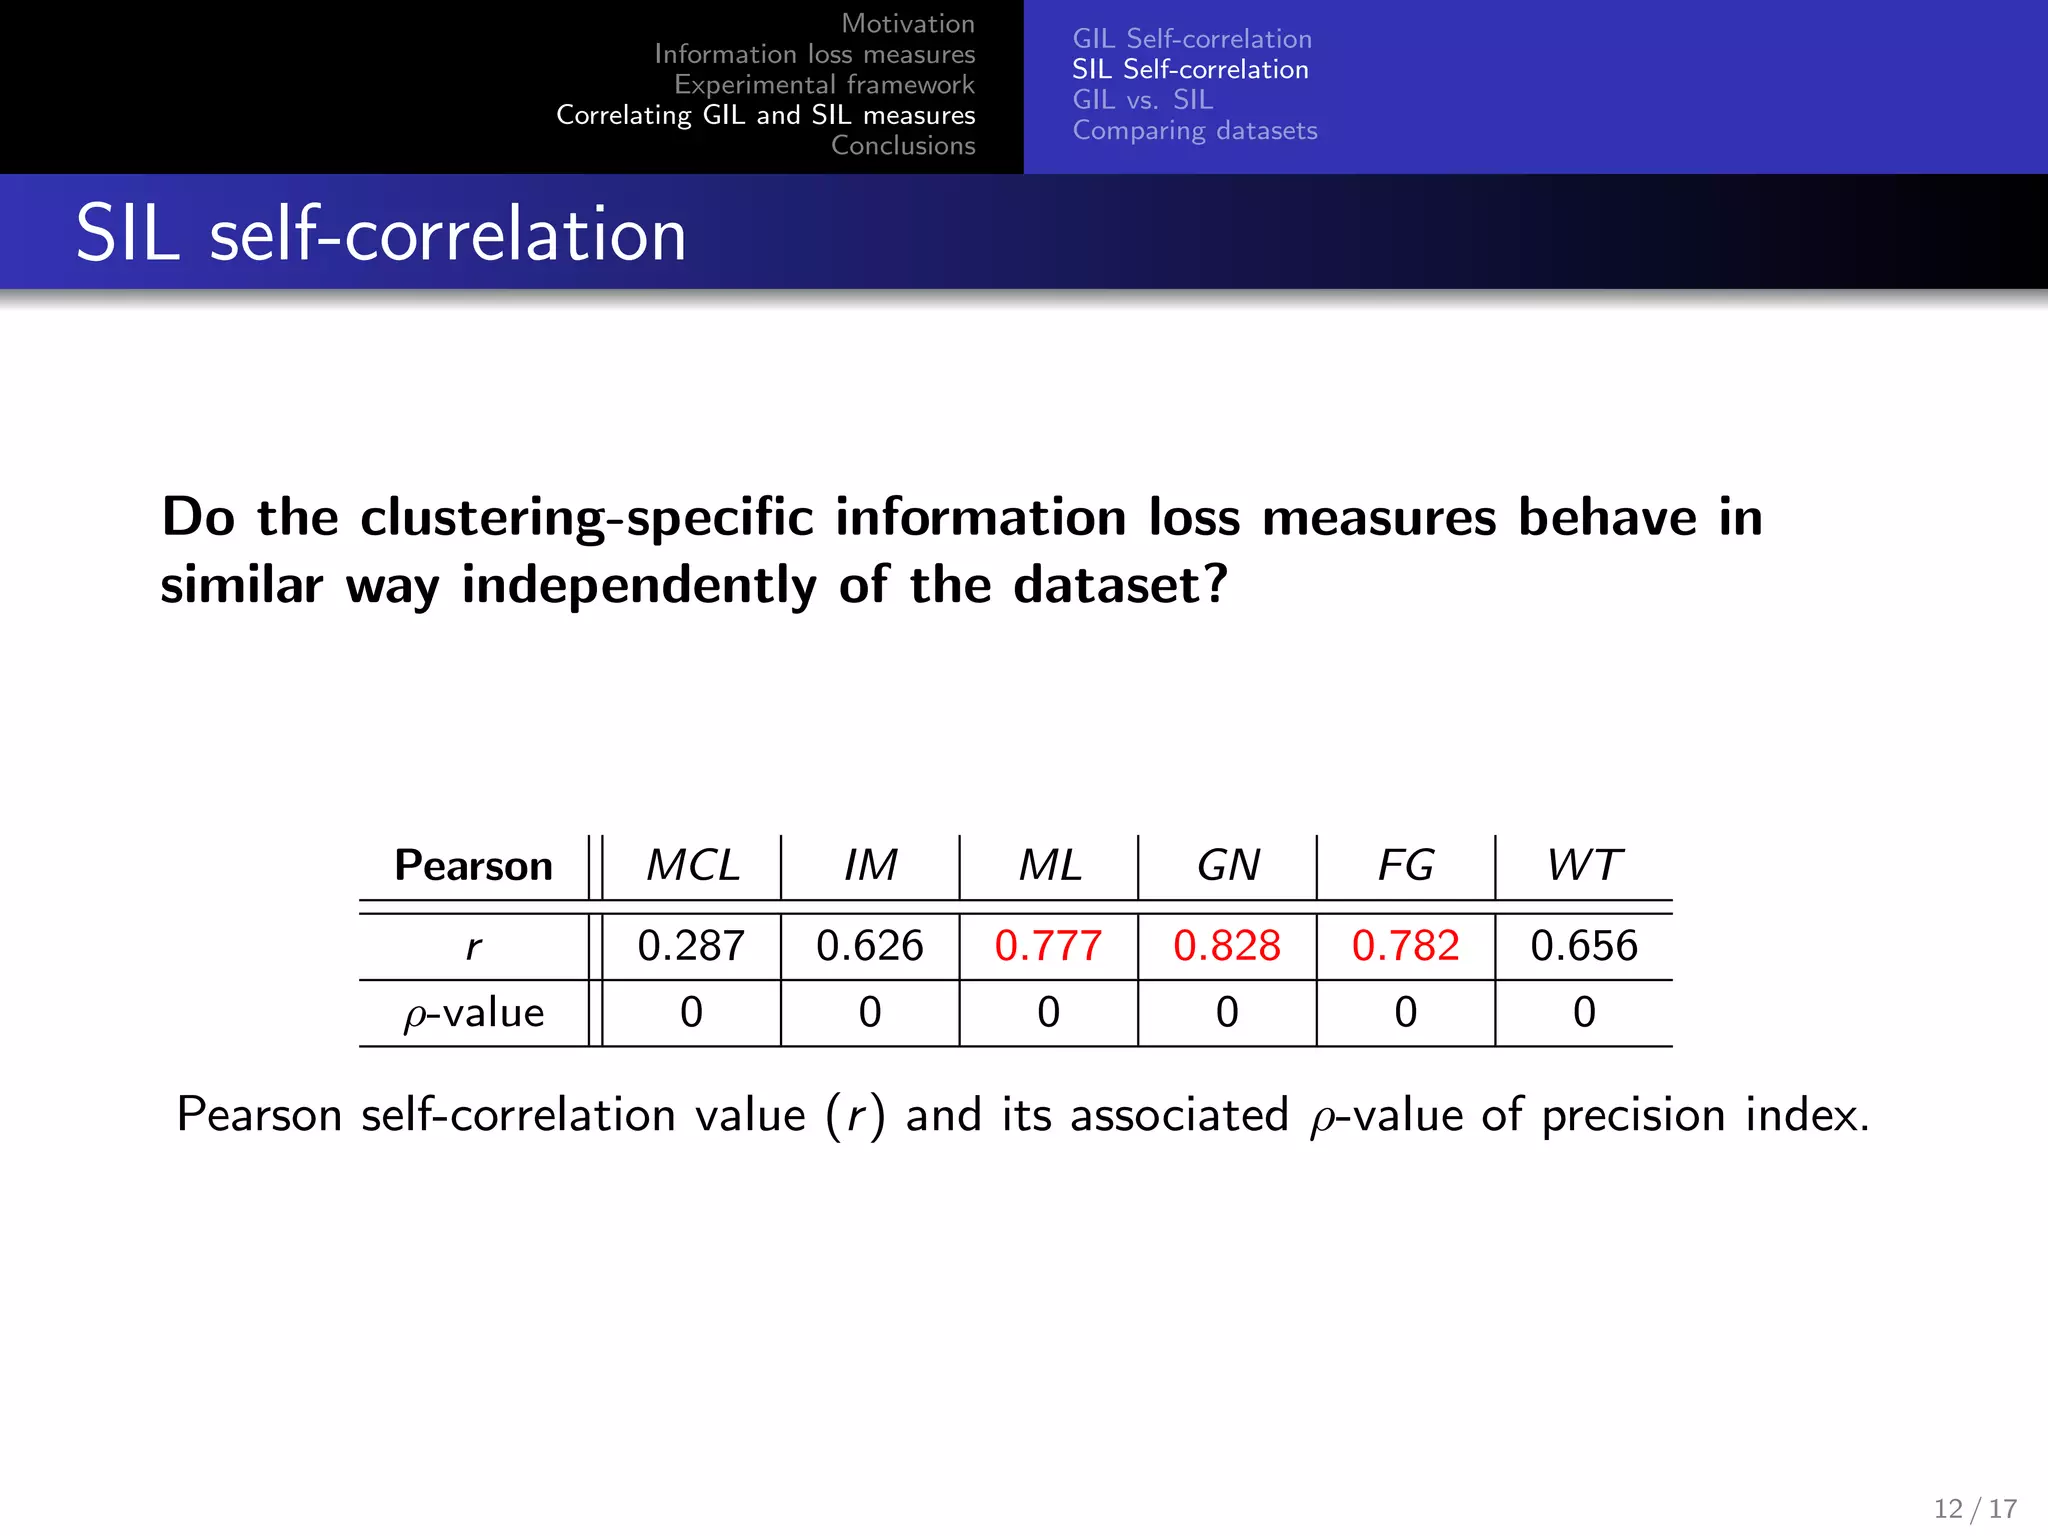
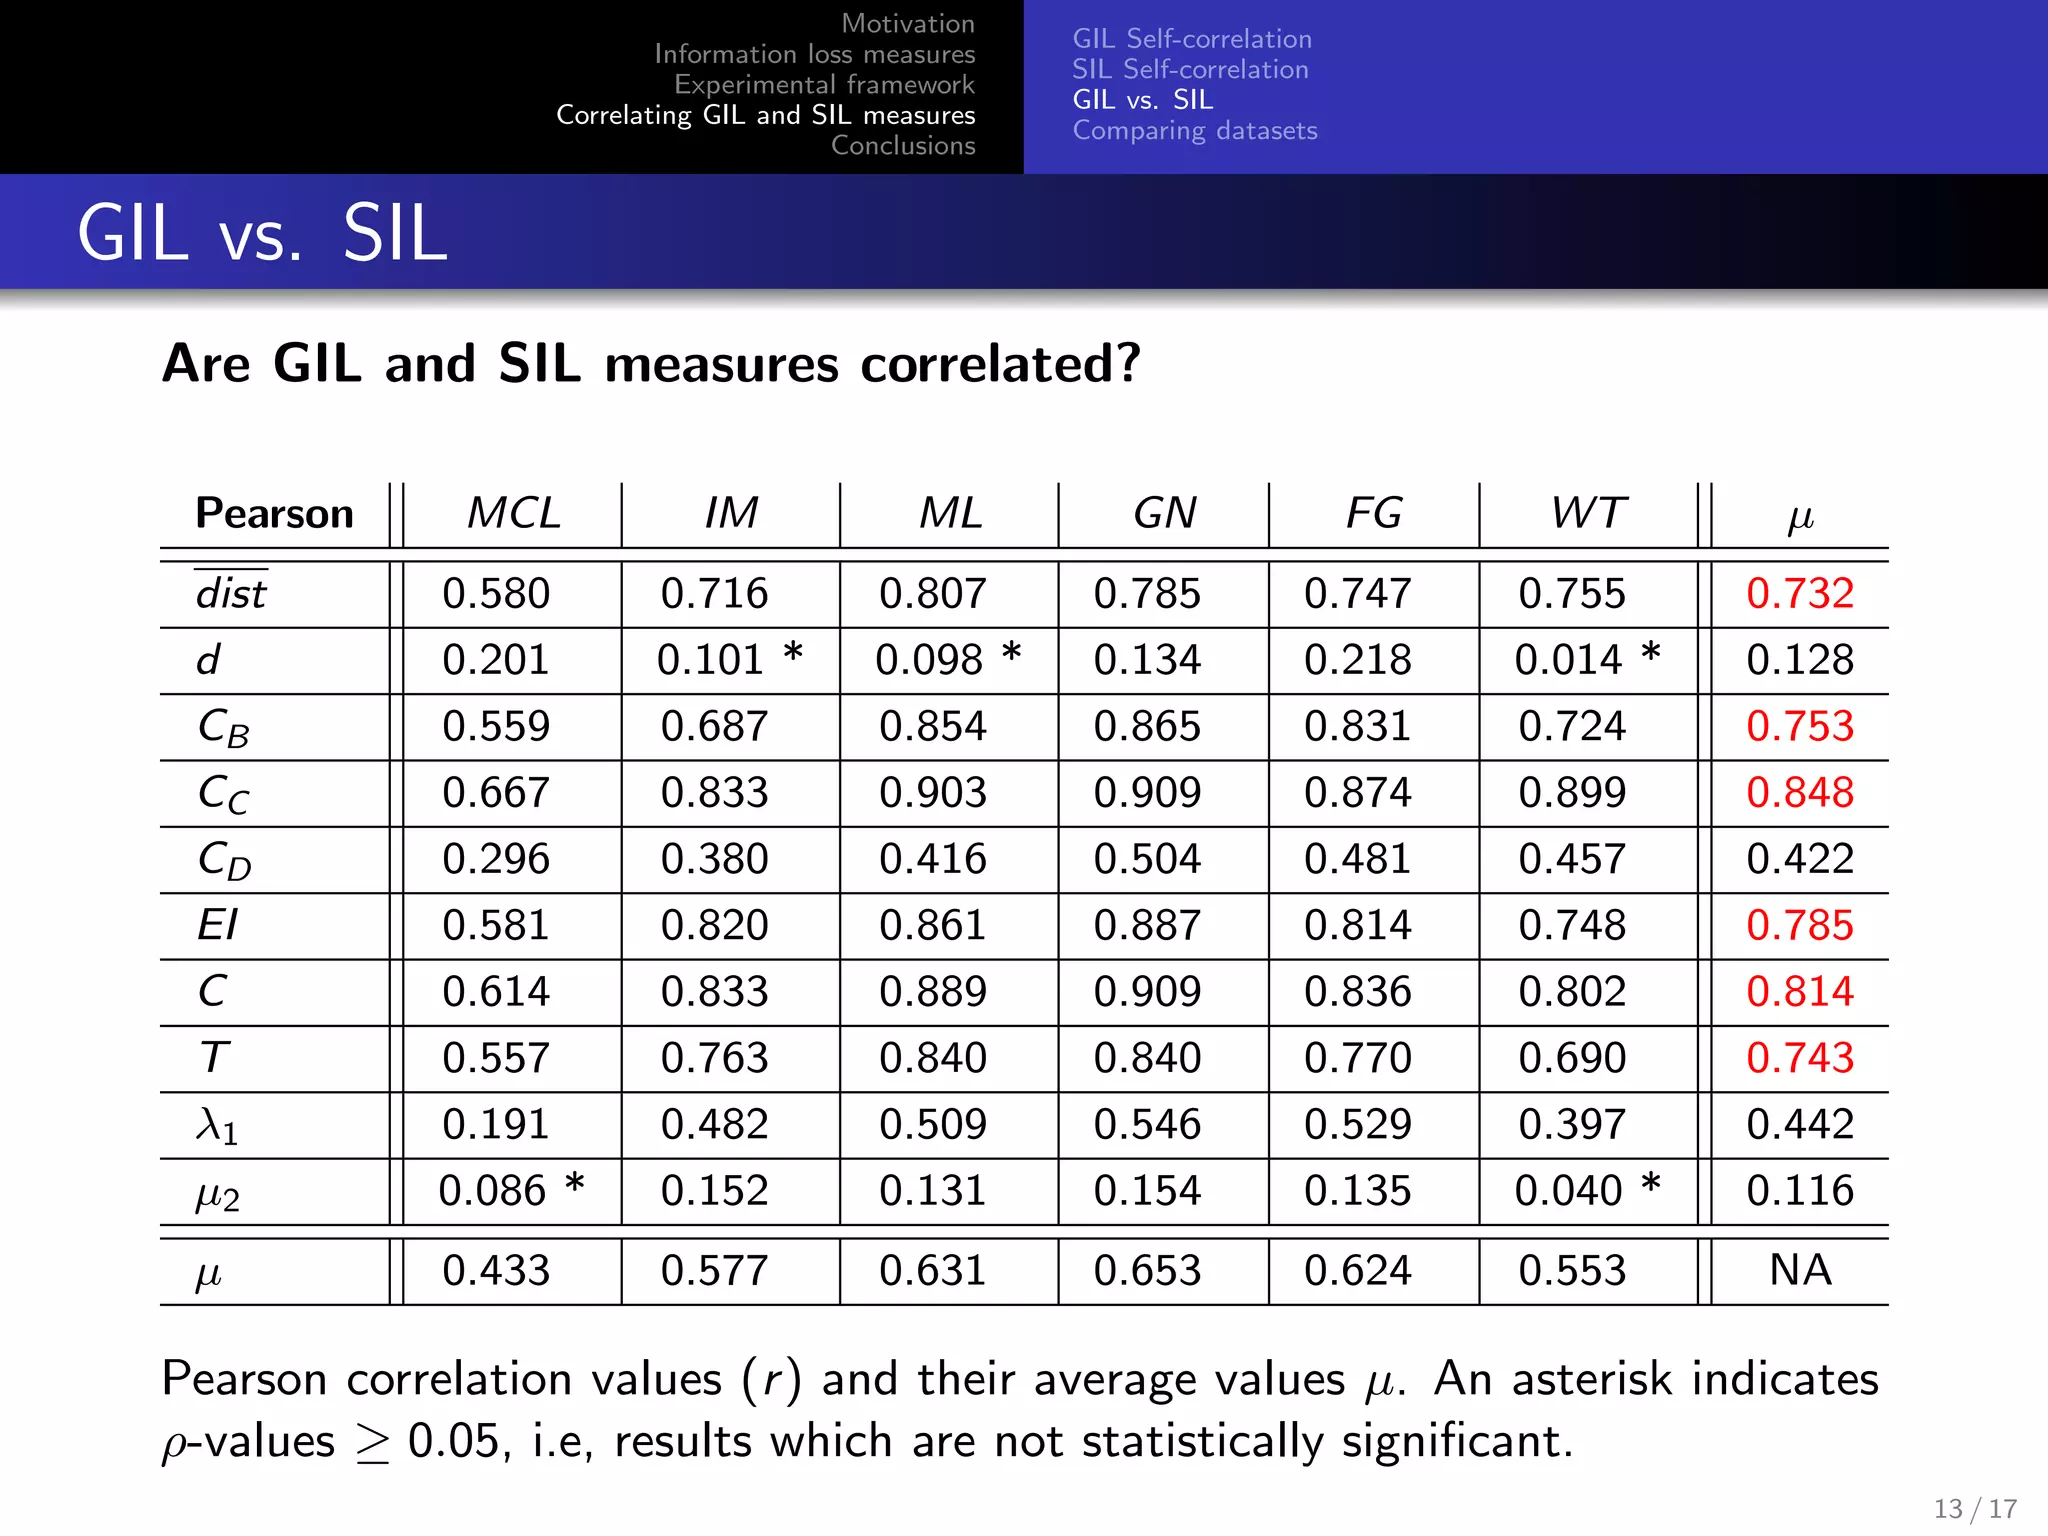
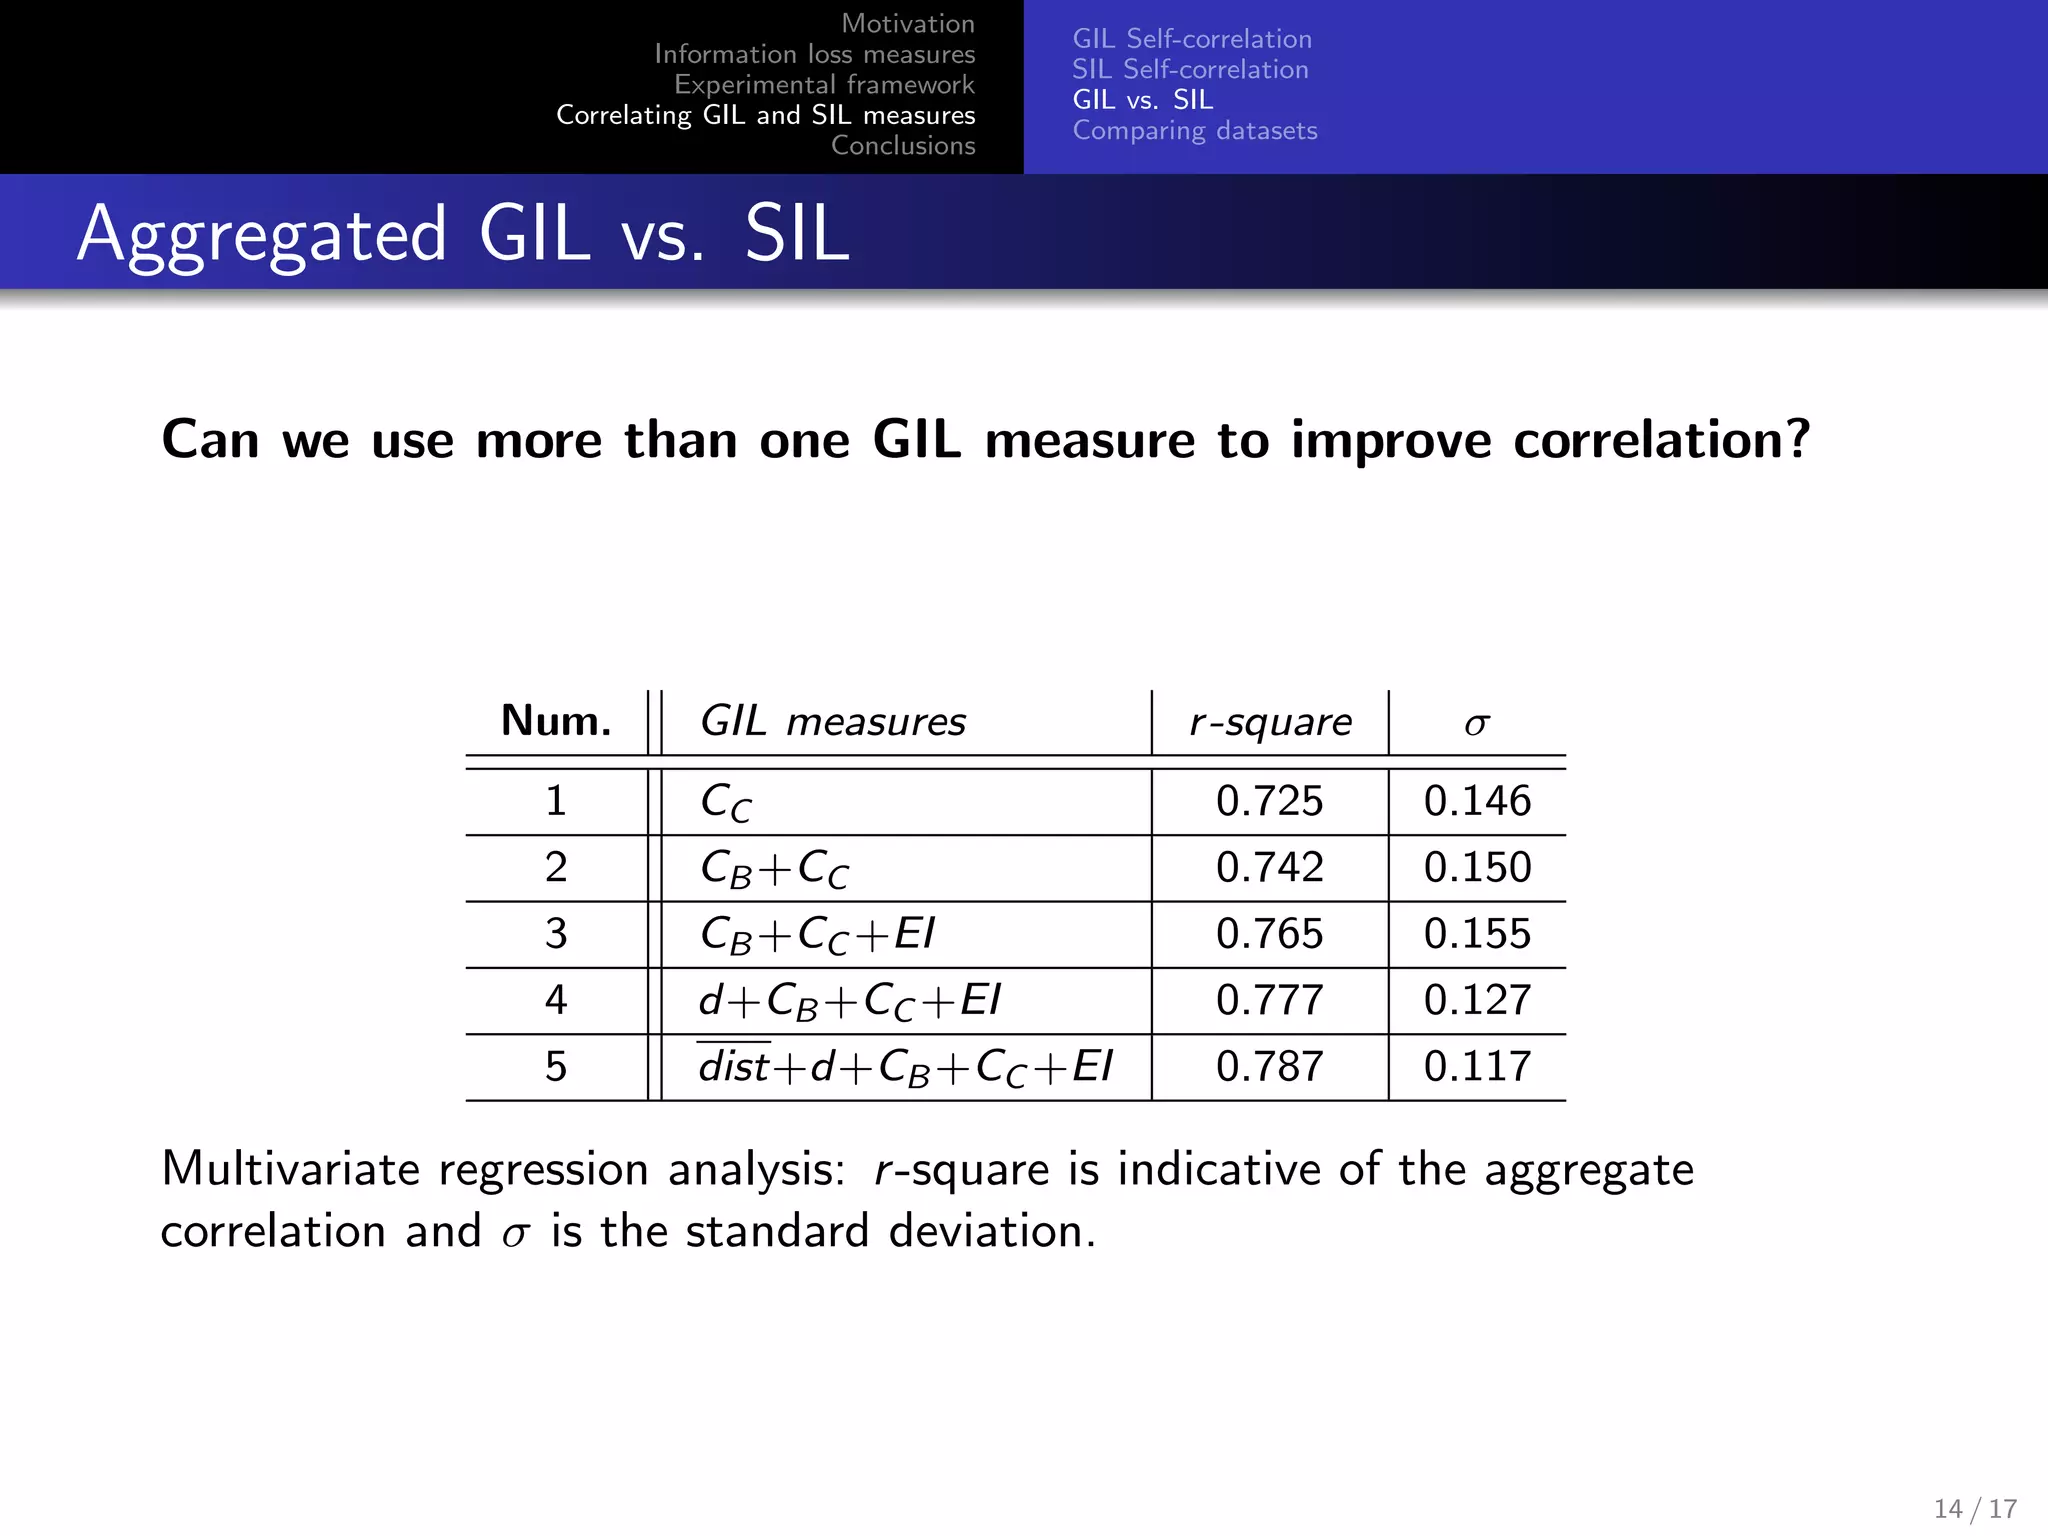
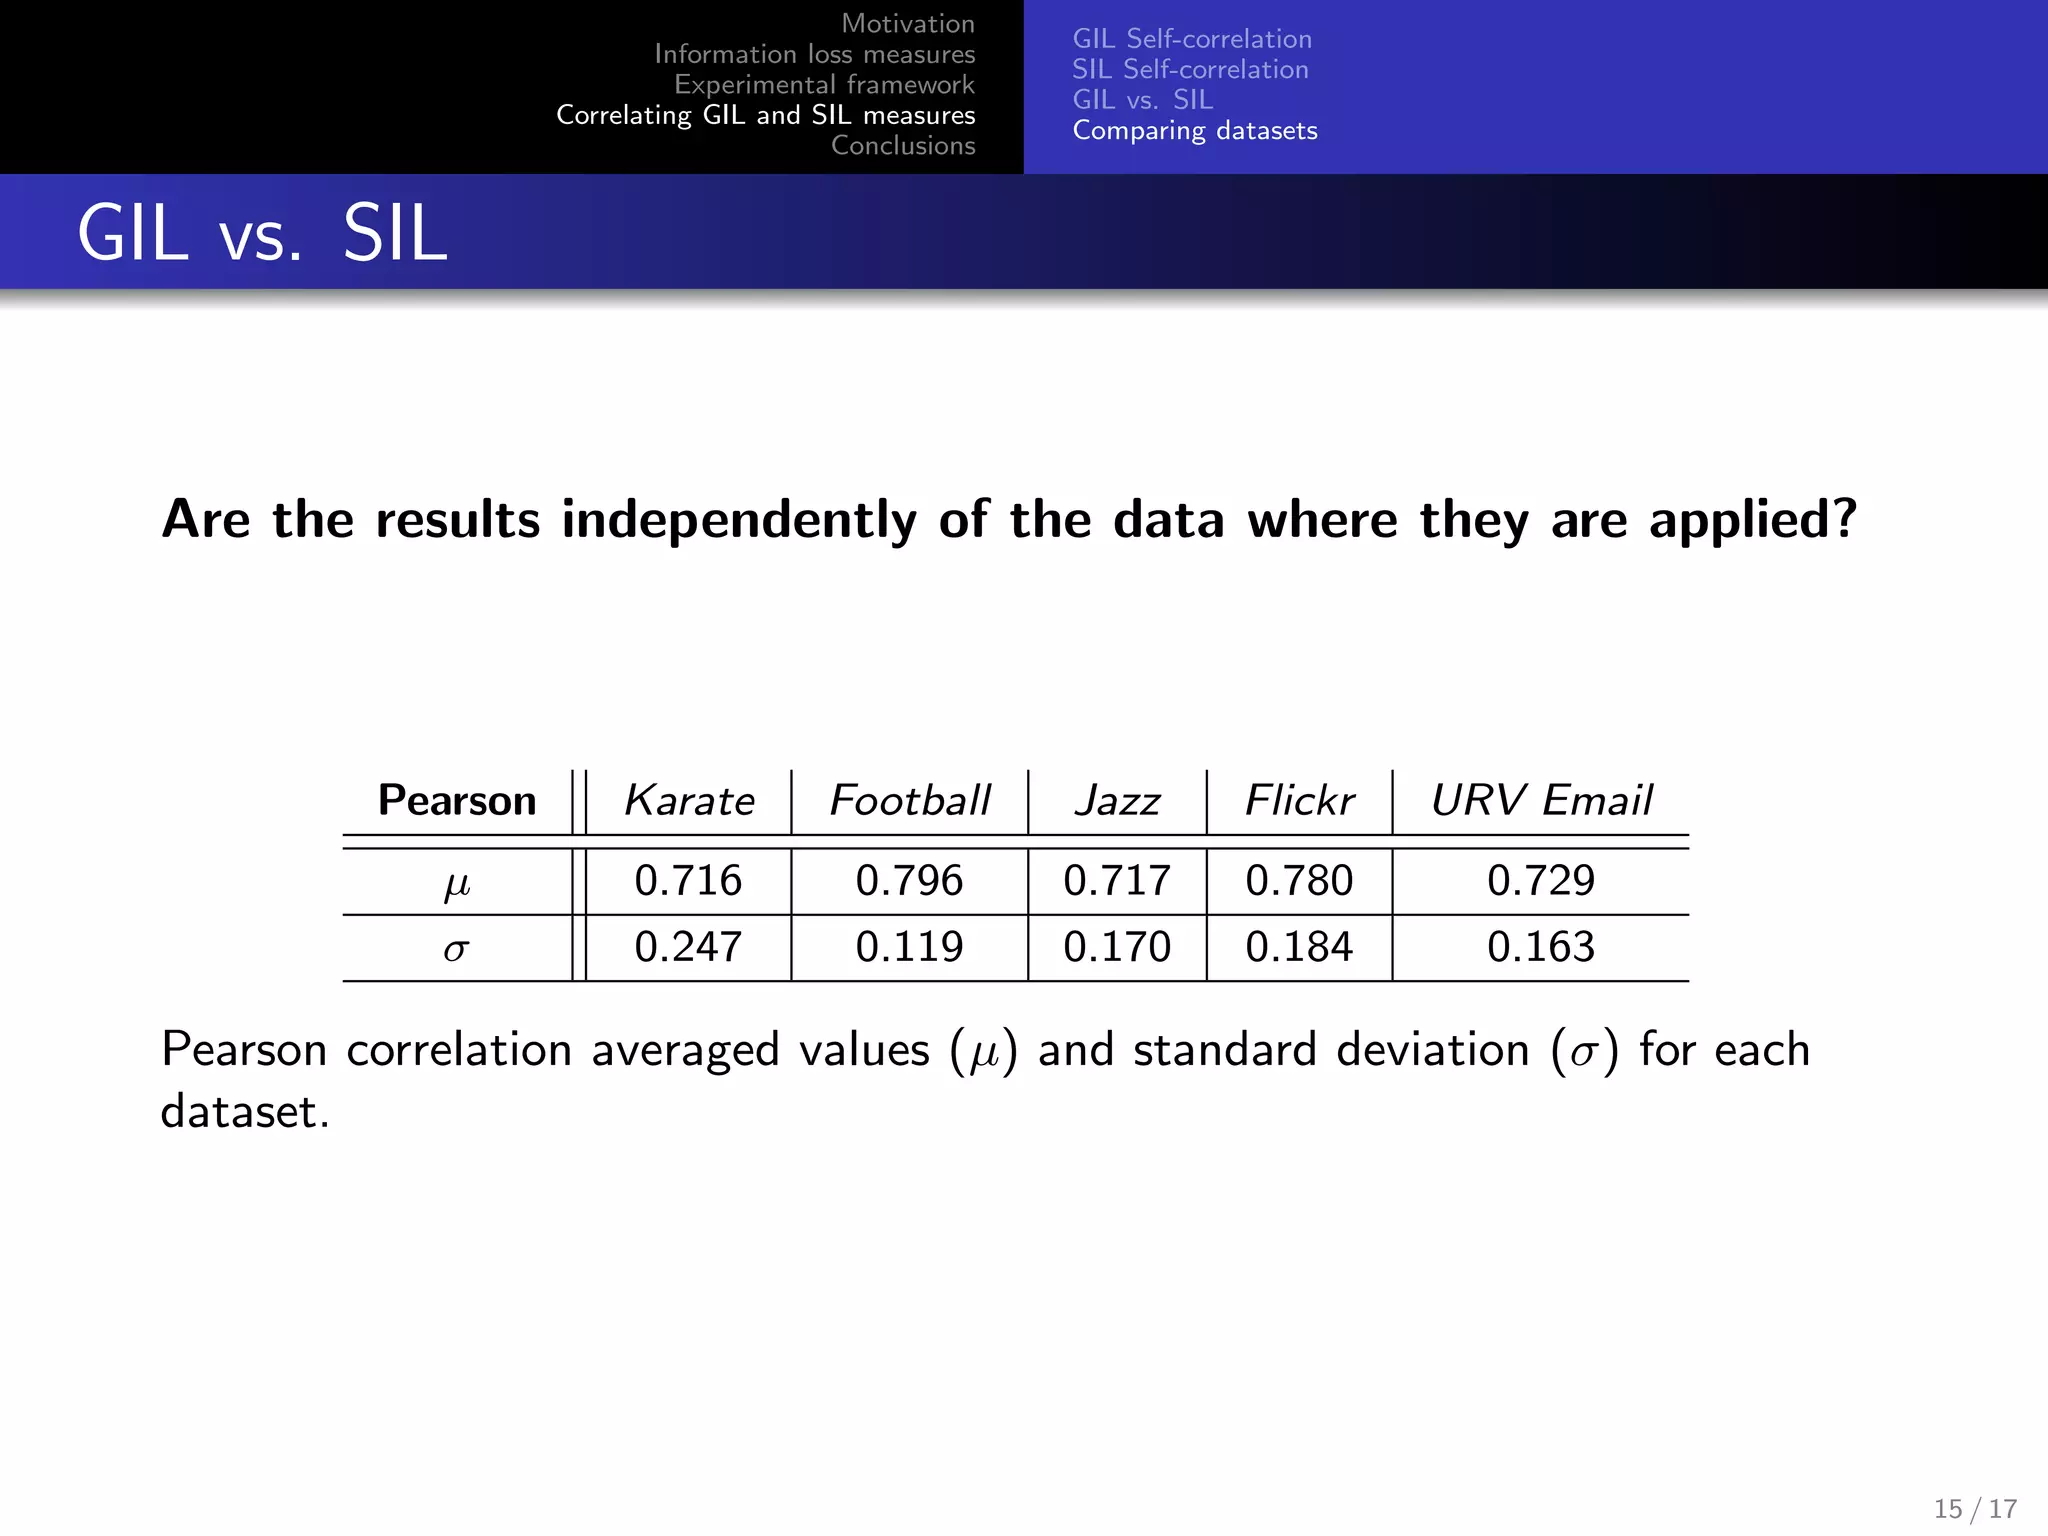
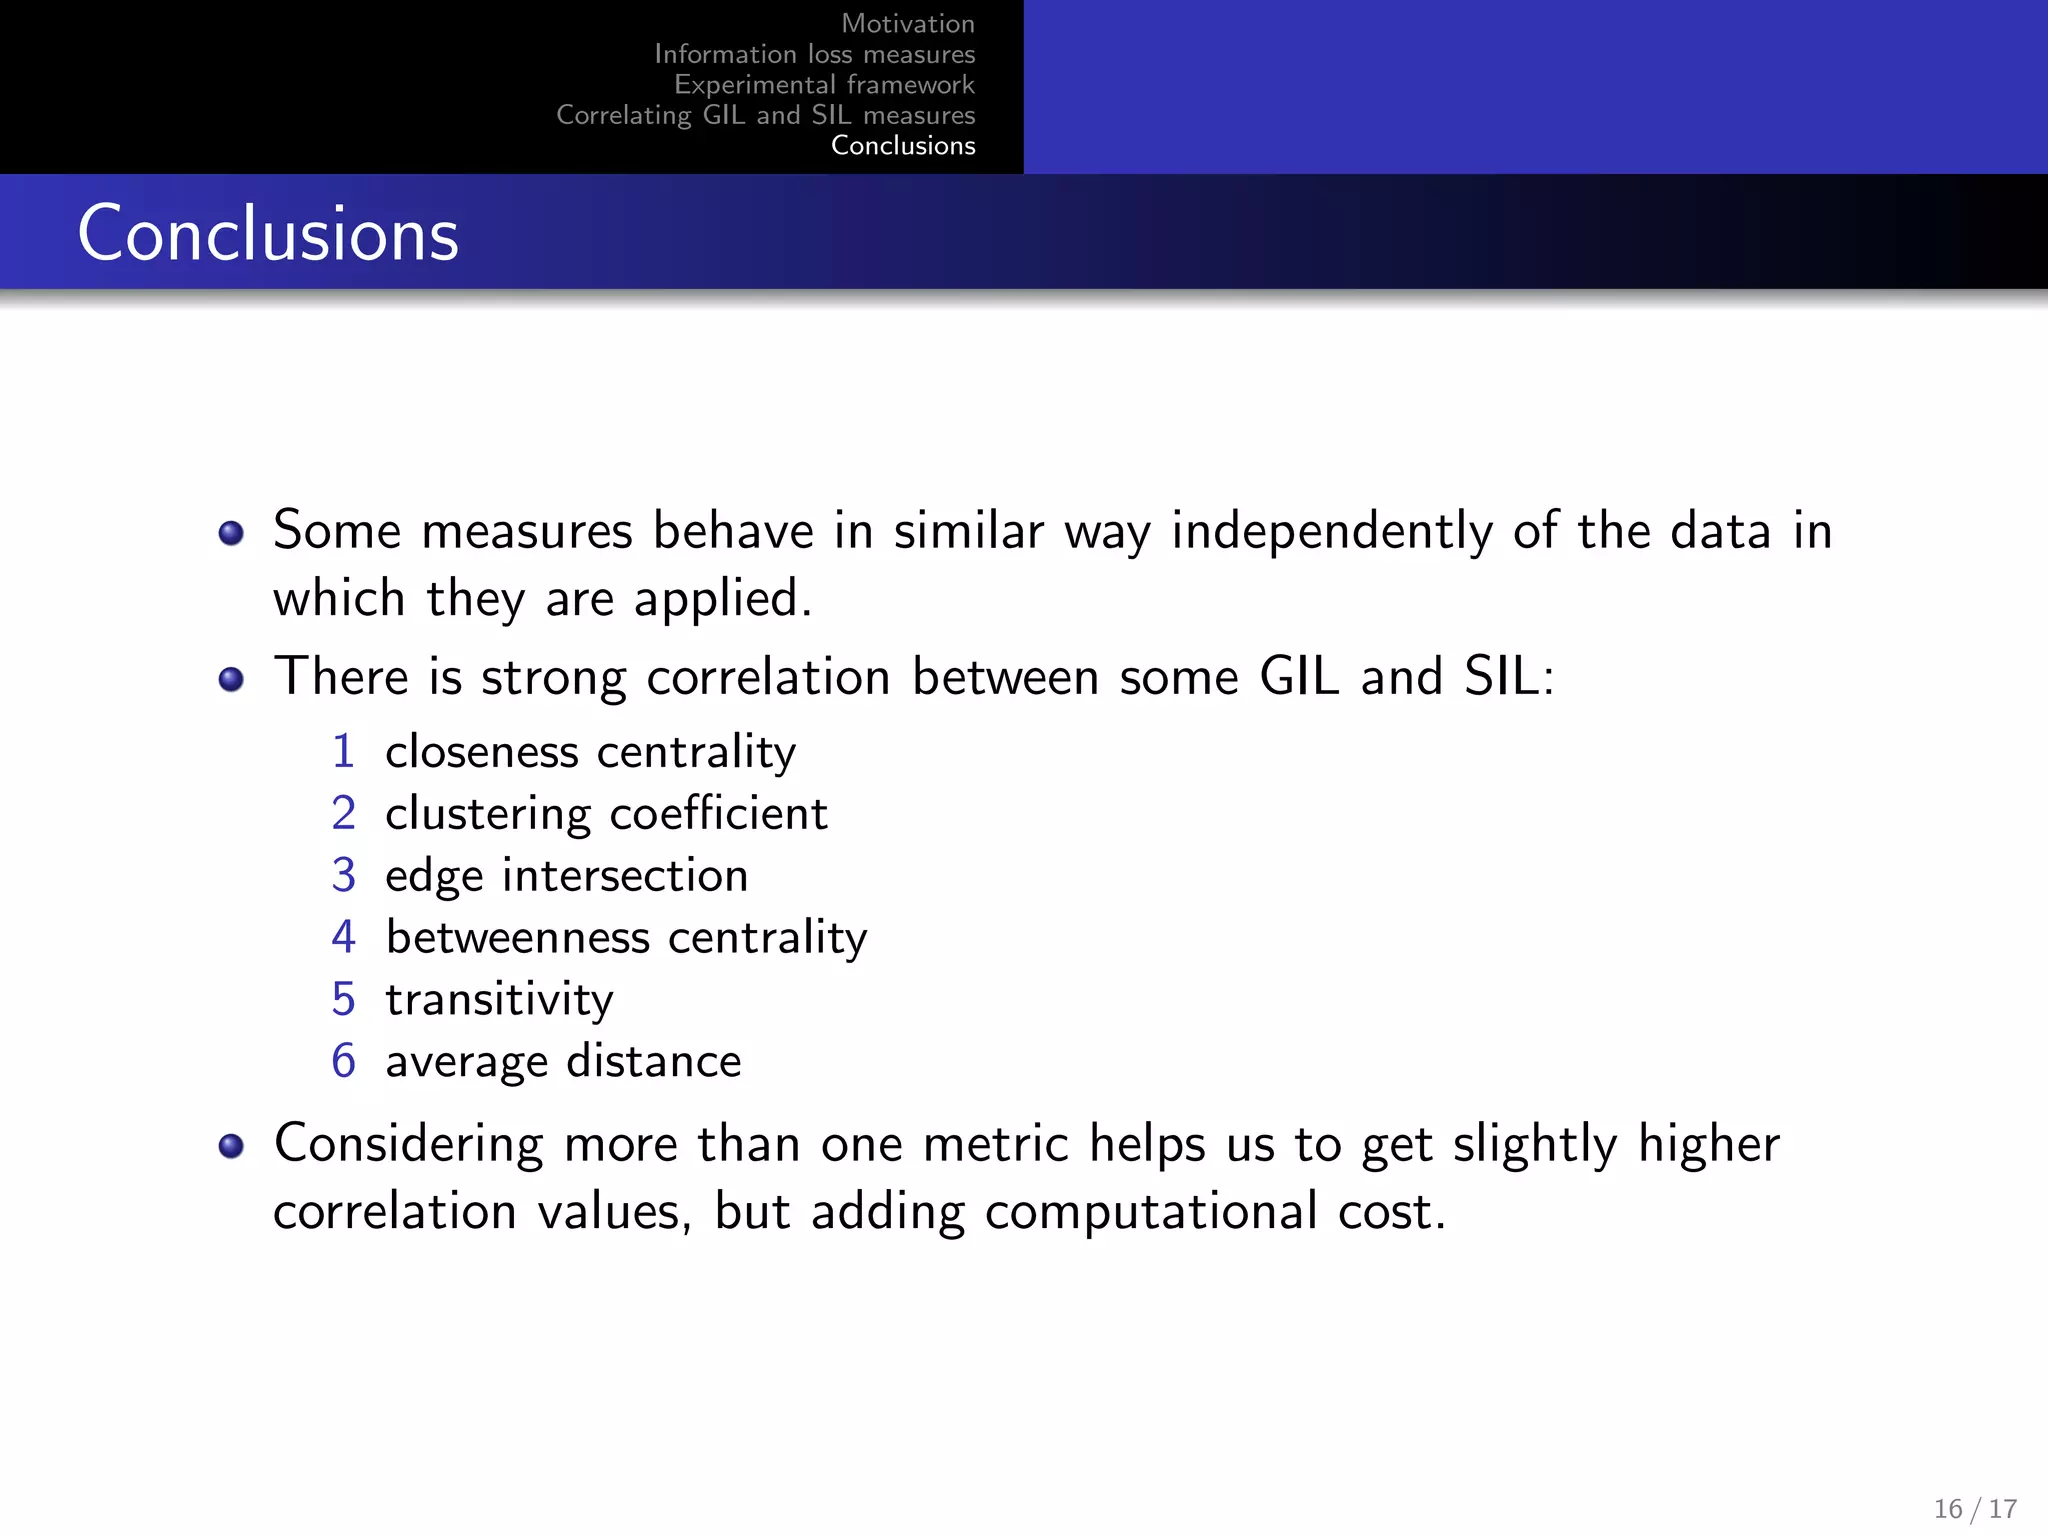

The document presents an experimental framework for evaluating information loss measures, specifically generic information loss (GIL) and specific information loss (SIL) in the context of graph anonymization. It details the correlation between GIL and SIL using various metrics, demonstrating strong relationships, particularly for metrics like closeness centrality and clustering coefficient. The conclusions suggest that certain measures exhibit consistent behavior across datasets and that utilizing multiple metrics can enhance correlation, albeit at a computational cost.