Download to read offline

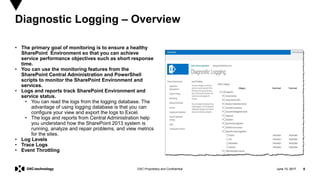
![June 13, 2017 11DXC Proprietary and Confidential
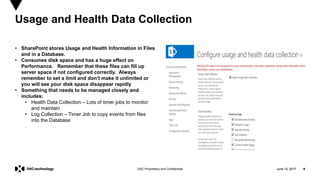
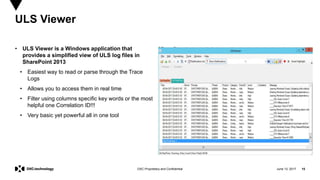
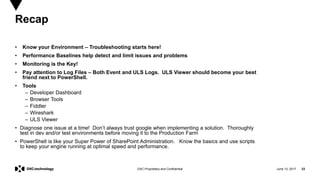
• Don’t be fooled by the name its more a tool to help you
troubleshoot problems and performance issues
• Easily Troubleshoot Problems with Page Rendering
• Three Types of modes that you need to be aware of
• Off - Not Displayed
• On – Rendering on Each and Every Page
• OnDemand – Hidden until you manually click on the
Developer Dashboard Icon
• Granular Control on Visibility provided – Users that
have Customization permissions by default
• Great way to Monitor Custom Code when the Developer
uses the SPMonitoredScope Tag – It’s a great idea to
make your solutions use this tag.
• Use PowerShell to enable DD in SP2013 and 2016.
• $ds= [Microsoft.SharePoint.Administration.SPWebService]::Co
ntentService.DeveloperDashboardSettings
$ds.DisplayLevel = 'OnDemand'
$ds.TraceEnabled = $true
$ds.Update()``
Developer Dashboard](https://image.slidesharecdn.com/spsdc2017-170613150651/85/SharePoint-Troubleshooting-11-320.jpg)
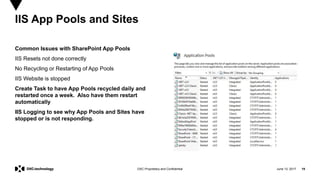
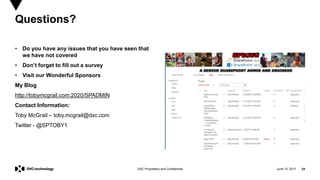
![June 13, 2017 12DXC Proprietary and Confidential
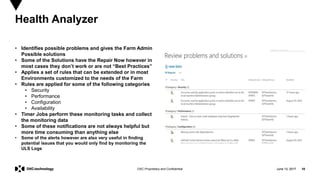
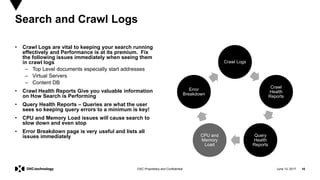
• SharePoint App Pools are part of IIS (By default they
recycle automatically) and Recycling App Pools are
essential to running fast on first load.
• Create a Warm Up Script that runs using Scheduled
tasks every morning.
– Run the task about 30 minutes before the first person
comes in the office. For example I have it run at 530
AM EST.
– Warm up all web applications and site collections for
more reliability
– Customize your script depending on environment and
run with Powershell!
• Sample Script
Warm Up App Pools and Sites
#------------------
# Ensure the SharePoint Snappin has been loaded
#------------------
if ( (Get-PSSnapin -Name "Microsoft.SharePoint.PowerShell" -ErrorAction SilentlyContinue) -eq $null ) {
Add-PSSnapin "Microsoft.SharePoint.PowerShell“
}
#------------------
# Simple method to write status code with a colour
#------------------
function Write-Status([Microsoft.PowerShell.Commands.WebResponseObject] $response) {
$foregroundColor = "DarkRed“
if($response.StatusCode -eq 200) {
$foregroundColor = "DarkGreen“
}
write-host ([string]::Format("{0} (Status code: {1})", $response.StatusDescription, $response.StatusCode)) -ForegroundColor
$foregroundColor }
#------------------
Warm-up all web applications
#------------------
Get-SPWebApplication | ForEach-Object {
write-host ([string]::Format("WebApplication request fired for {0} [{1}]. ", $_.DisplayName, $_.Url)) –NoNewline
Write-Status -response (Invoke-WebRequest $_.url -UseDefaultCredentials -UseBasicParsing) }
#------------------
# Since the root of web applications use different templates then other site collections, also load other sites of different # types.
This ensures their assemblies also get loaded in memory
#------------------
$additionalUrls = @("https://sharepoint.jmlfdc.mil/sites/search" ;, "https://sharepoint.jmlfdc.mil" ;,
,
"https:/sitename.com/sites/blog" ;,
"https://sitename/sites/SPTOBY" ;) $additionalUrls | ForEach-Object {
write-host ([string]::Format("Additional web request fired for Url: {0}. ", $_)) -NoNewline
Write-Status -response (Invoke-WebRequest $_ -UseDefaultCredentials -UseBasicParsing) }](https://image.slidesharecdn.com/spsdc2017-170613150651/85/SharePoint-Troubleshooting-12-320.jpg)


The document discusses various tools and techniques for monitoring and troubleshooting SharePoint environments, including: - Correlation IDs that help trace issues across requests - Diagnostic logging at different log levels (event and trace) to capture varying levels of detail - Tools for monitoring usage data, health analyzer alerts, and the developer dashboard - Ensuring app pools and sites are "warmed up" each morning with a scheduled script - Common tools like the ULS viewer, search logs, IIS manager, and PowerShell for monitoring counters, thresholds and more. The presentation provides an overview of logging, monitoring and debugging SharePoint, emphasizing the importance of using the right tools to efficiently identify and resolve issues