Downloaded 18 times


![89
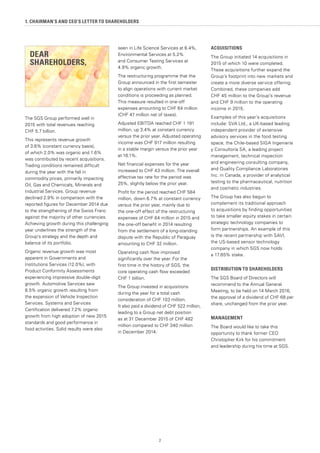
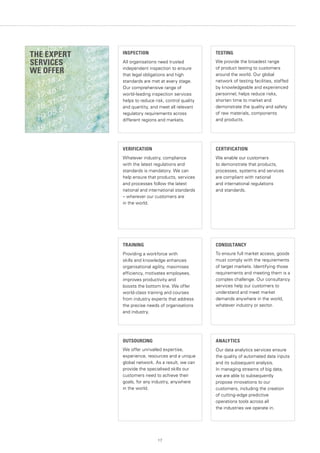
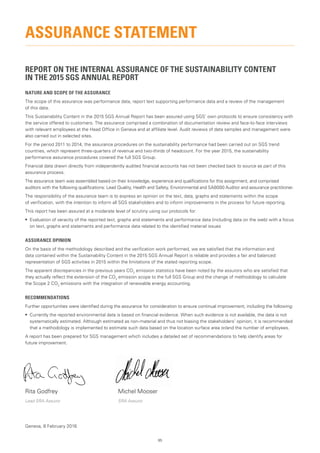
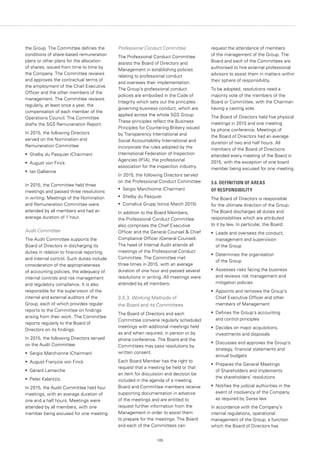
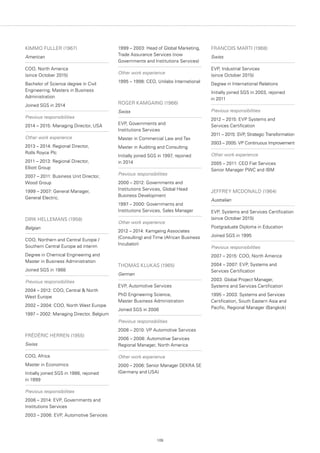
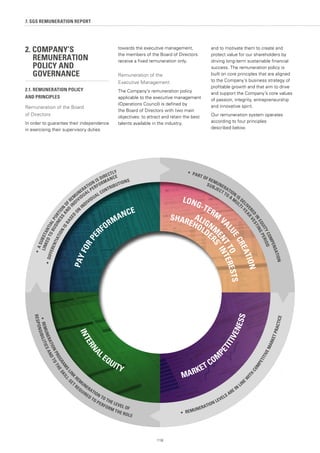
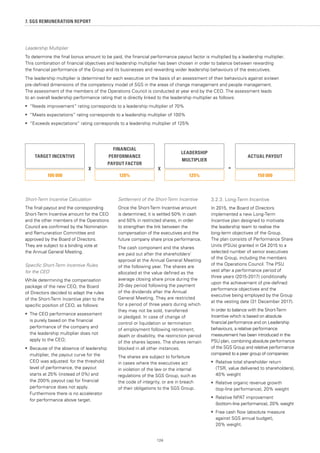
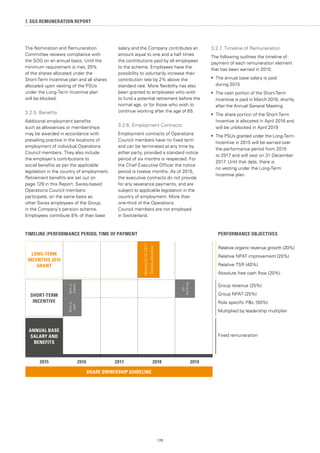
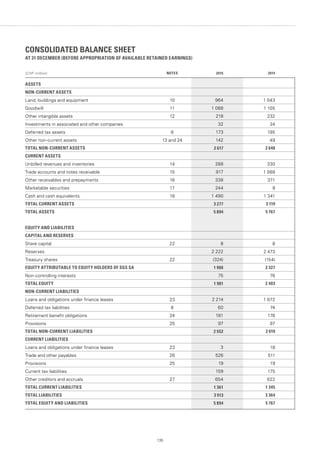
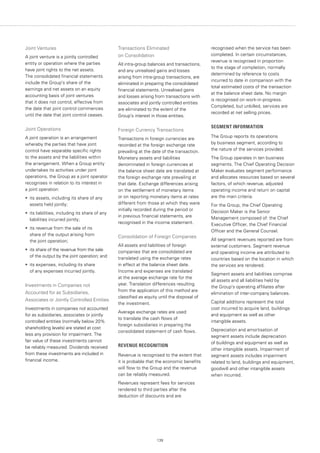
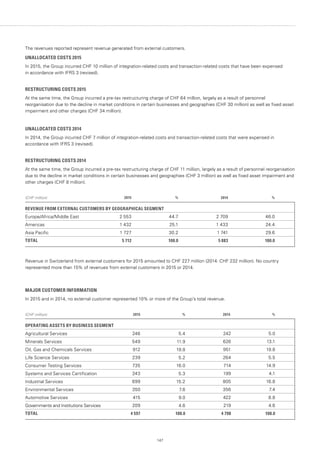
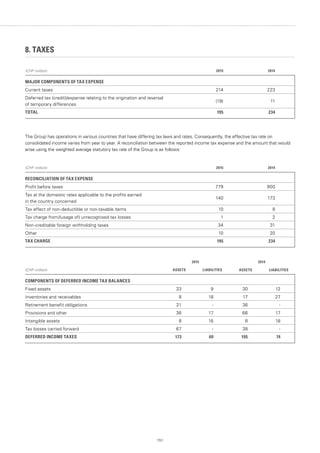
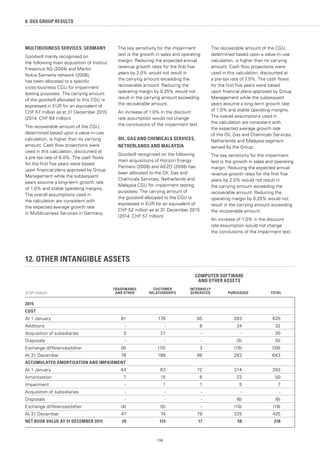
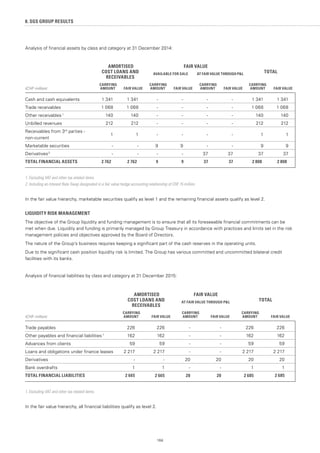
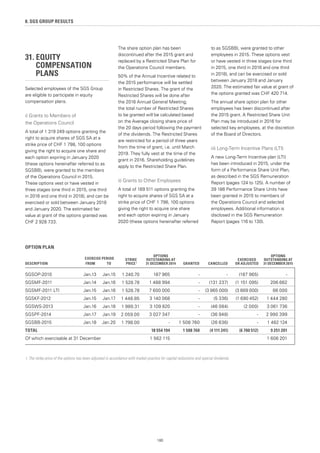
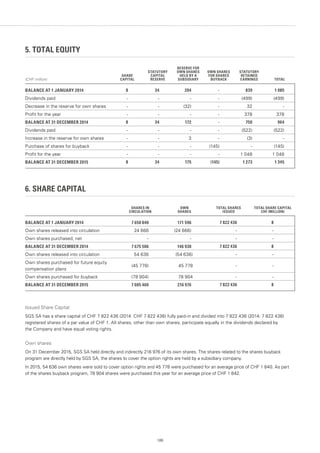
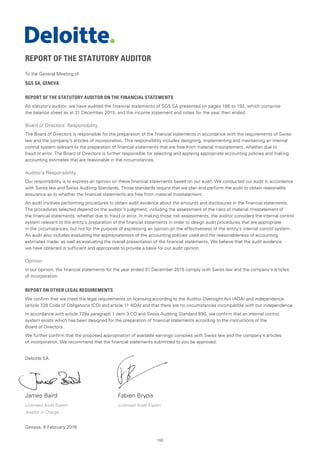
SGS has started a process to understand
our value to society. Value to society is
based on the premise that all business
activities take place within a field
of social capital, which is contained
within the natural environment.
Social capital allows the development
of interpersonal relationships that in
turn enable the combination of human
capital, natural capital and intellectual
capital to produce goods and services
(i.e. manufactured capital). A key
component of the value to society
framework is determining the economic
values for respective capital stocks
and flows.This process of economic
evaluation, often termed monetisation,
is necessary to enable integration of the
full factors of production (i.e. the natural
capital, human capital, manufactured
capital, etc.) into a core financial-based
business decision-making system.
The first stage in the process has
involved the quantification and economic
valuation of the various capital stocks
and flows that comprehensively
represent the necessary inputs and
outputs of our business activities.
First, we identified the entire asset
base that underpins SGS’ operations.
Conceptually supported by the
International Integrated Reporting
Council’s [IRRC] guidelines, operations
require (directly and indirectly)
a complement of:
FINANCIAL CAPITAL
The medium for exchange, a store of
economic value and as a unit of account.
NATURAL CAPITAL
The economic functions
of the natural environment.
HUMAN CAPITAL
The economic functions
of the labour force.
INTELLECTUAL CAPITAL
The economic functions of knowledge.
SOCIAL CAPITAL
The economic functions of trust within
stakeholder networks.
MANUFACTURED (OR BUILT) CAPITAL
The economic functions of property,
plant, equipment, inventory and
intermediate inputs.
In future, we will start reporting around
the six capitals. A significant amount
of work has already been completed,
which indicates that the business
activities of SGS are net positive (which
means that we contribute more value
than we derive). There is further work
to be done to adapt the concept to our
business model using auditable data, but
we expect to be in a position to report
on this in detail in 2016. We are also
focusing on aligning our future reporting
to the IRRC framework. As such,
2016 will be a decisive year involving
high-level stakeholder dialogue and
consultation on our evolved reporting
approach. More details on how we
are measuring our value to society
can be found on our website:
www.sgs.com/cs-report2015
OUR VALUE
TO SOCIETY](https://image.slidesharecdn.com/sgs2015annualreporten-160224131412/85/SGS-2015-Annual-Report-93-320.jpg)


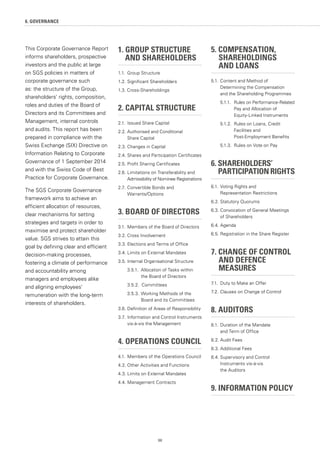
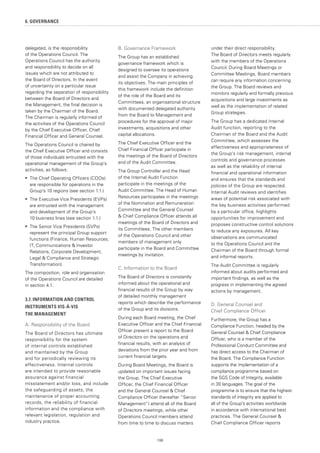
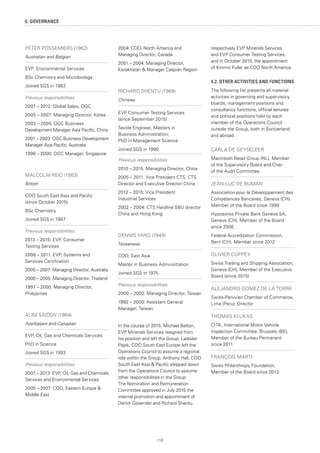
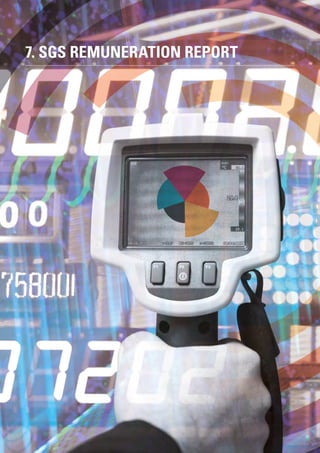

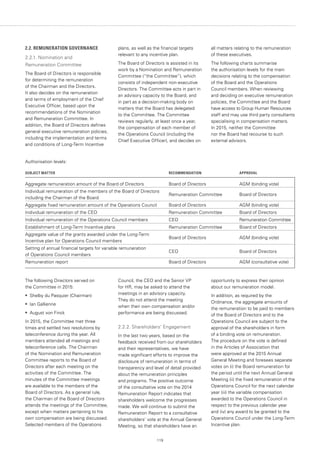
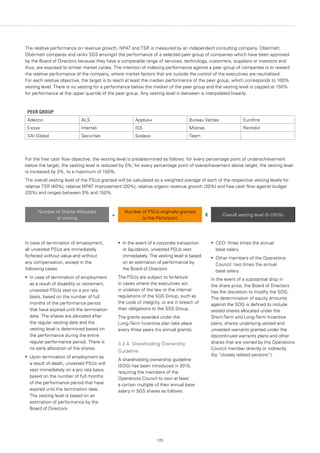
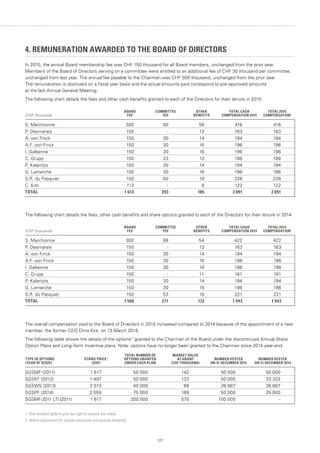

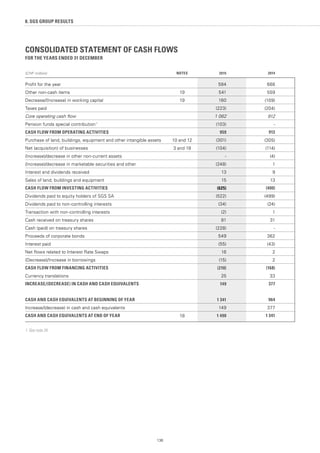
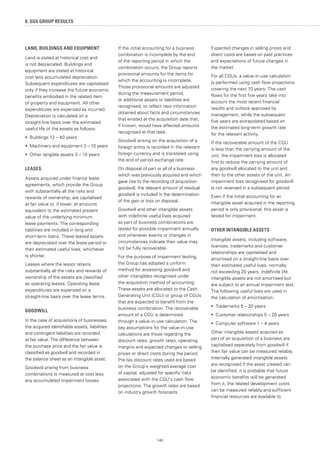
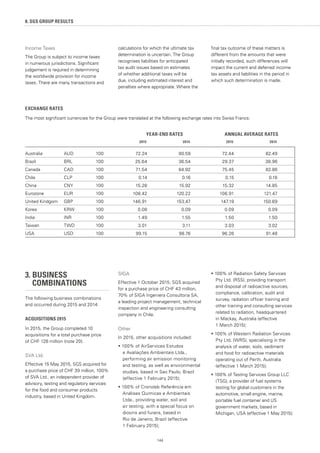
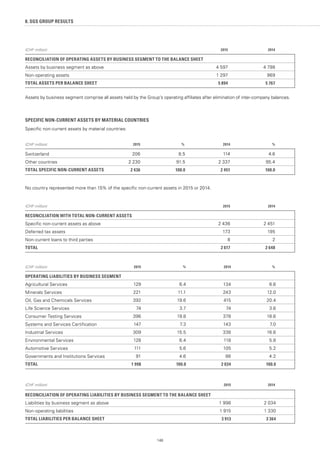
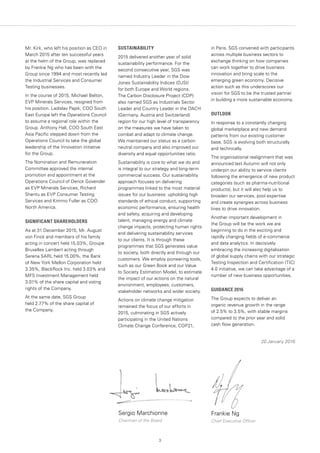
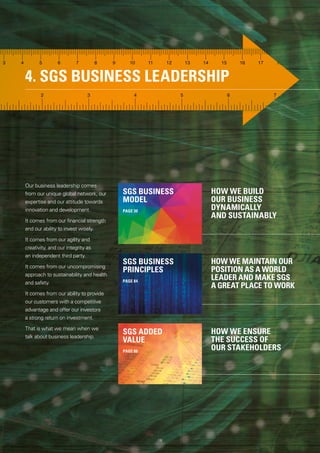
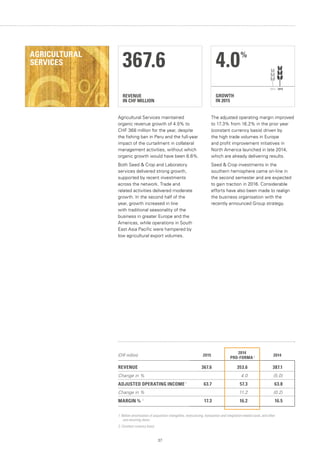
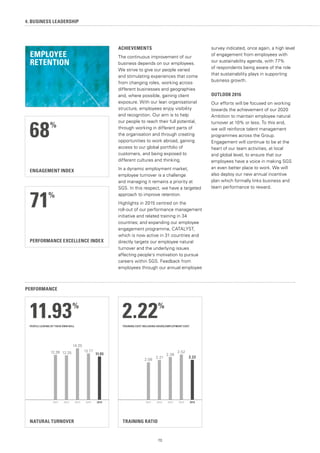
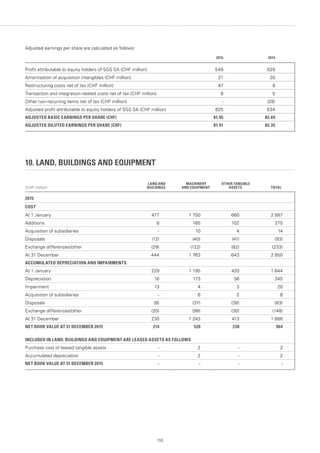
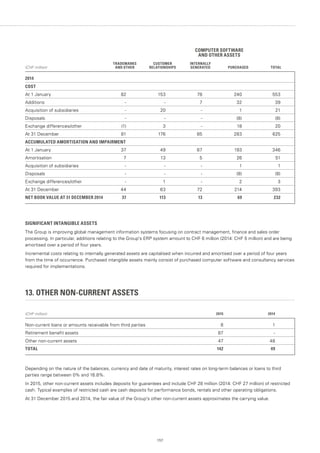
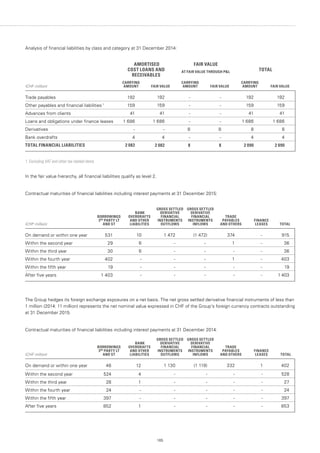
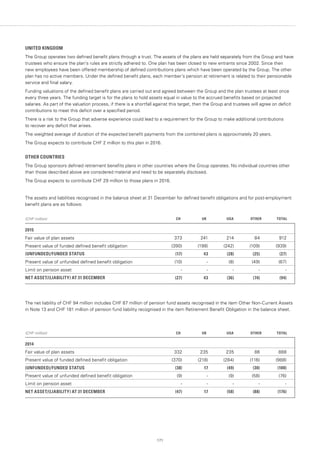
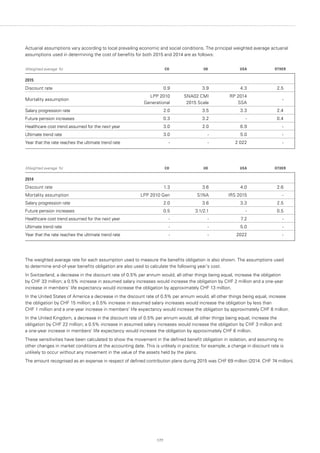
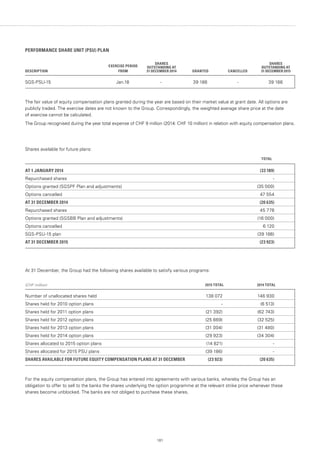
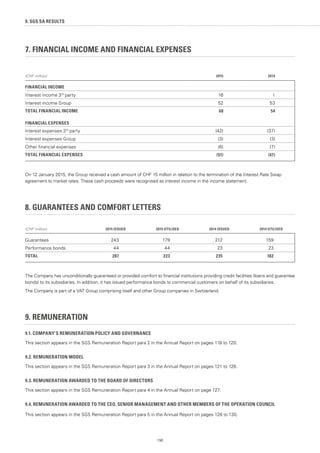
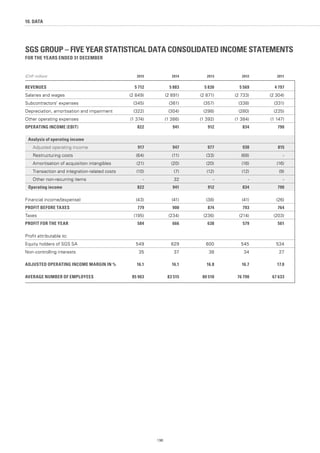
![Net change in deferred tax assets/(liabilities):
(CHF million) TOTAL
NET DEFERRED INCOME TAX ASSET (LIABILITY) AT 1 JANUARY 2014 107
(Charged)/credited to the income statement (11)
Credited/(charged) to the shareholders' equity 1
26
Exchange differences and other (1)
NET DEFERRED INCOME TAX ASSET (LIABILITY) AT 31 DECEMBER 2014 121
Credited/(charged) to the income statement 19
(Charged)/credited to the shareholders' equity 1
(15)
Exchange differences and other (12)
NET DEFERRED INCOME TAX ASSET (LIABILITY) AT 31 DECEMBER 2015 113
1. Relate to remeasurement gains and losses on pensions. (2015: CHF 9 million, 2014: CHF 26 million) and pension funds special contribution [2015: CHF (24) million,
2014: CHF 0 million].
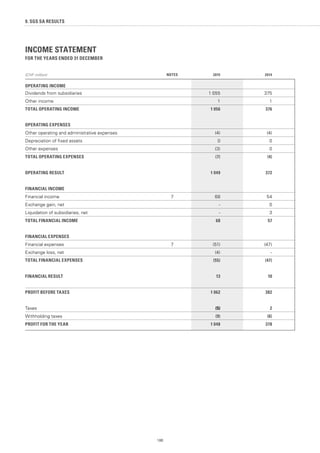
(CHF million) 2015 2014
REFLECTED IN THE BALANCE SHEET AS FOLLOWS:
Deferred tax assets 173 195
Deferred tax liabilities (60) (74)
TOTAL 113 121
The Group has unrecognised tax losses carried forward amounting to CHF 46 million (2014: CHF 49 million) of which none will
expire within the next five years. No tax losses carried forward expired in 2015.
At 31 December 2015, the retained earnings of subsidiaries and foreign incorporated joint ventures consolidated by the Group include
approximately CHF 4 125 million (2014: CHF 3 912 million) of undistributed earnings that may be subject to tax if remitted to the
parent company. As a Group policy, no deferred tax is recognised in respect of these amounts until the point at which the distributable
earnings are determined and foreign statutory requirements, allowing the distribution, are fulfilled. Until that time, the Group is able to
control the reversal of the temporary differences and it is probable that they will not reverse in the foreseeable future.
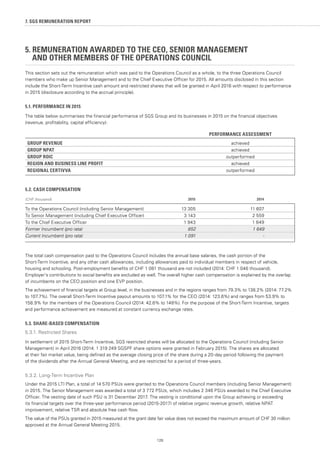
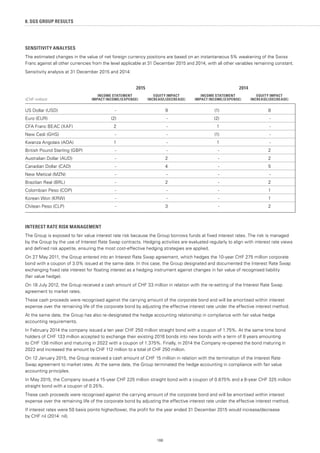
9. EARNINGS PER SHARE
Basic earnings per share are calculated as follows:
2015 2014
Profit attributable to equity holders of SGS SA (CHF million) 549 629
Weighted average number of shares 7 626 002 7 670 752
BASIC EARNINGS PER SHARE (CHF) 71.99 81.99
Diluted earnings per share are calculated as basic earnings per share except that the weighted average number of shares includes
the dilutive effect of the Group’s share option plans (see note 31):
2015 2014
Profit attributable to equity holders of SGS SA (CHF million) 549 629
Diluted weighted average number of shares 7 630 172 7 702 444
DILUTED EARNINGS PER SHARE (CHF) 71.95 81.65
152
8. SGS GROUP RESULTS](https://image.slidesharecdn.com/sgs2015annualreporten-160224131412/85/SGS-2015-Annual-Report-156-320.jpg)


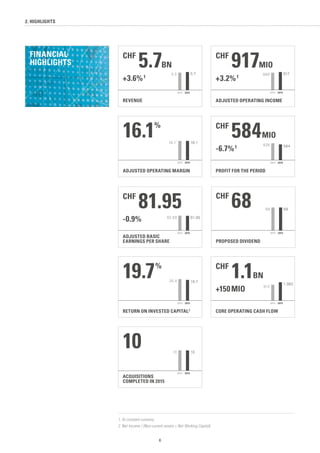
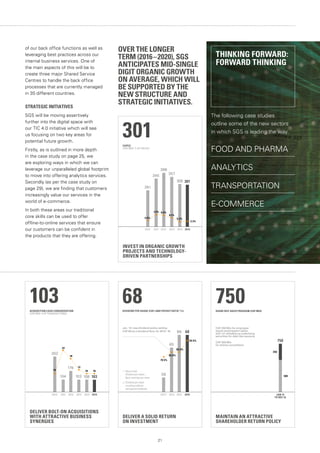
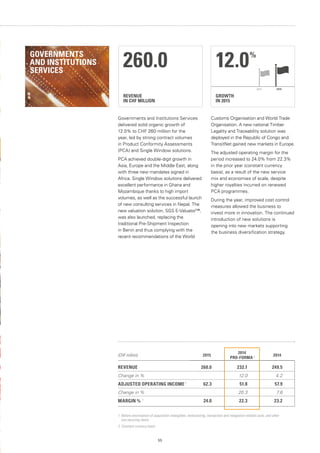
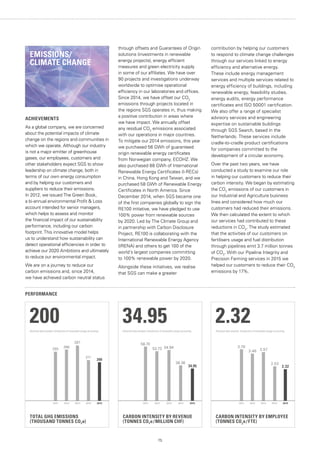
The annual report summarizes SGS's performance in 2015, including financial highlights, business segment highlights, and sustainability performance. It provides an overview of changes to SGS's structure and strategy to take advantage of market opportunities. Organic revenue growth was 2.0% and acquisitions contributed 1.6% growth. Operating cash flow exceeded CHF 1 billion for the first time. SGS remained the leader in sustainability indices and continued initiatives in emissions reductions, achieving carbon neutrality again in 2015. The report outlines SGS's strategic focus on innovation, expertise, and operational excellence across its industries.


