Beginners Guide to TikTok for Search - Rachel Pearson - We are Tilt __ Bright...
SF_AffordableHousingProject_GIS
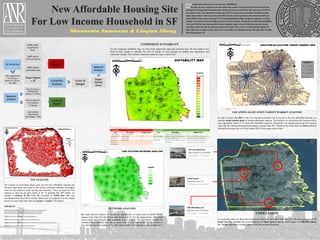
1. Shannenia Sumawan & Linqian Sheng
New Affordable Housing Site
For Low Income Household in SF
Clients : People with minimum income in San Francisco (<$30,000/Year)
Goal : Sky-high rents and a competitive real estate market have created a housing crisis in the San Francisco Bay Area.
According to the Paragon Real Estate market report last May, San Francisco median house sales price soars to $1.5M. This
has created a serious issue, where 48% of homeowners and 57% of renters are cost-burdened. Statistically, personal
finance experts claim it’s ideal to pay no more than 30% of income on housing. However, lower-income households are
paying 50-60% of their income on housing in SF. The housing affordability problem consequently aggravates to a larger
economic issue in terms of financial stability and money for other necessities. Subsequently, we realized that affordability
is only part of the Bay Area’s housing problem because inadequate supply is the real underlying issue here. Housing
construction remains far below the actual units needed in the market, and so there is an undeniably high demand with
short supply. Thus, our group is trying to find the best site to build a new affordable housing, which targets 80% of people
with minimum income in SF.
COMPOSITE SUITABILITY
For the composite suitability map, we union both opportunity map and constraint map. We then added a new
field of total weights to calculate the sum of weights of each polygon by adding total opportunity and
constraint weights. The resulted, composite suitability map is shown here.
LOCATION-ALLOCATION TARGET MARKET ANALYSIS
In order to ensure that 80% of the Low-Income household will be served by the new affordable housing, we
used the target market share in location-allocation analysis. The facilities we selected are the location with a
max opportunity factor of 11 (from the Suitability analysis). Meanwhile, the demand points are the location
where the low-income household percentage is greater than 20%. Based on the result, there are three potential
affordable housing sites in SF that capture 80% of the target market share.
SOURCES
UC Berkeley Geog C188 Lab 3 and Lab 10 (Fire Stations and Transportation)
http://ratt.ced.berkeley.edu/downloads/SanFranciscoGeodatabase.gdb.zip
http://ratt.ced.berkeley.edu/classes/c188/data/lab10/analysis_net_db.zip
USGS (NED/DEM elevation) https://viewer.nationalmap.gov/
Data SF (Salary/Employment and SF Slopes) https://data.sfgov.org
Resilience Bay Area Program (Liquefaction and Landslide) http://resilience.abag.ca.gov/open-data/
Data Gov (SF Crimes 2014-2016) https://catalog.data.gov
CONCLUSION
In conclusion, there are three best locations to build new affordable housing in SF. The first location is in 99
South Van Ness Avenue; the second location is in Inner Sunset; and the third location is in 900-998 Athens
St. The geo map above visually pinpoint the three potential locations.
TIN ANALYSIS
We wanted to avoid steep slopes areas for the new affordable housing site
because steep slope may leads to soil erosion, potential landslide and higher
costs for the extensive earth moving and insurance. Thus, we used the TIN
analysis to map out all steep slopes in SF. To generate this TIN model, we
created a contour of 5m from the elevation of NED1_9arc that was
downloaded from the USGS website. Afterward, we assigned -1 as the weight
factor for areas with slopes that are greater or equal to 20 degrees.
NETWORK ANALYSIS
We used network analysis to weight the opportunities of areas close to BART/MUNI
stations (from Data.SF) and fire stations (from) Lab 10. For the opportunities, we created
service areas and polygons with impedance unit as 1~6min. The opportunity weights are
calculated by 6-ToBreak, thus service areas within 1 min from BART/MUNI stations or
fire stations received weights of +5, while those within 5 to 6 minutes receive weights of 0.