Download to read offline
![© Terra Energy & Resource Technologies, Inc 2
Terra Background
Breakthrough Technologies
Terra Energy & Resource Technologies, Inc. [PINK:TEGR] formed - 2005
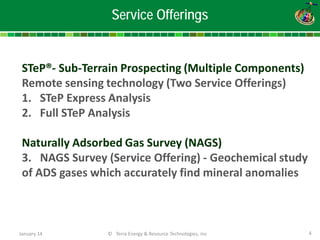
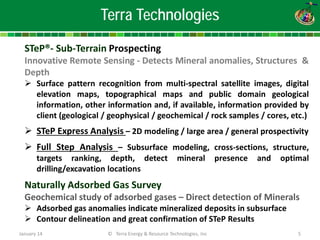
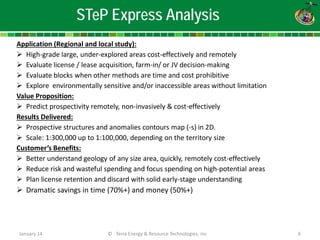
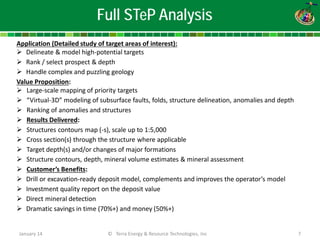
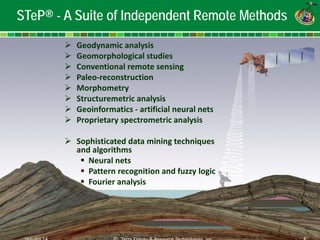
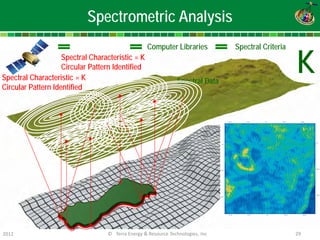
Three (3) innovative exploration service offerings which feature multiple proprietary technologies with superior predictive capabilities and easy data acquisition.
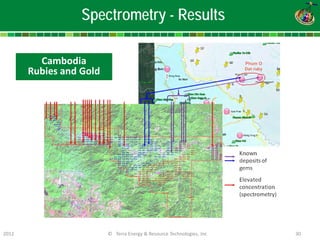
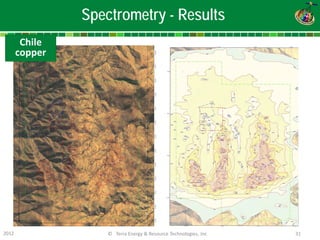
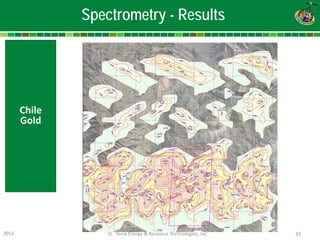
Finds mineral anomalies and depth in early exploration stages.
Geological/Geoscience basis supported by sophisticated algorithms and interpretation by skilled, experienced geoscience professionals.
Each tested/refined in hundreds of applications over the past 30 years (originally academic/military/government sponsored and then later many commercial apps). Company Ideology: Integrate multiple, independent methods/data sets and reduce time, costs & risk. January 14](https://image.slidesharecdn.com/servicespresentationminerals-141130221326-conversion-gate01/85/Services-presentation-minerals-2-320.jpg)
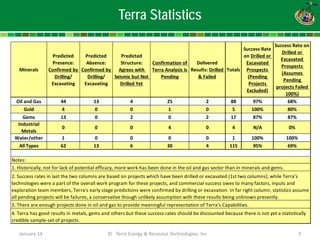


Terra Energy & Resource Technologies, Inc. utilizes innovative exploration services to identify mineral anomalies and depths using advanced algorithms and remote sensing technologies. Their success rates vary across sectors, but oil and gas projects show promising results, while minerals and gems are still being verified. Terra's methodologies offer cost-effective, non-invasive solutions to mine planning, prospect evaluation, and risk reduction in exploration.