Trilogy International Partners Inc. held an investor presentation in September 2019 to provide an overview of the company and its two main operating segments, 2degrees in New Zealand and NuevaTel in Bolivia. The summary discusses:
- 2degrees has seen strong double-digit revenue and subscriber growth in New Zealand in 2019. It operates in a stable three-player mobile market with opportunities for continued growth in postpaid subscribers and data adoption.
- NuevaTel closed a $100 million tower sale-leaseback agreement in Bolivia and launched fixed LTE services. The business is showing signs of stabilizing after pricing pressures and number portability issues impacted results in 2018.
- The presentation evaluates Trilogy


![Trilogy International Partners Inc. confidential information. Not meant for distribution
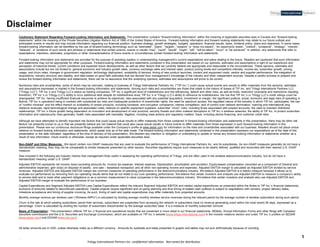
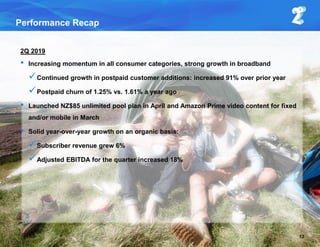
Buying Opportunity: Trilogy Valuation vs. Share Price
5
[1] Based on mid-point of 2019 guidance; as reported which includes benefit of NRS for 2degrees USD$8M and NuevaTel $4M
[2] Market trading comparisons (indicative only)
In US$mm NuevaTel 2degrees HQ Consol.
2019EEBITDA 1)
$45 $105 ($11) $139
Market trading comps 2)
5.0x 8.5x 7.4x 7.4x
Enterprise Value $225 $891 ($78) $1,038
Total Net Debt $27 ($141) ($345) ($459)
Equity Value $252 $750 ($423) $579
Ownership 71.5% 73.3% 100.0%
Pro Rata Eq. Val. $180 $550 ($423) $307
Shares O/S (mm) 84.2Intrinsic Value per Share (US$) $3.65
Intrinsic Value per Share (C$) $4.91
Premium to Current TRL Share Price (%) 128%
2degrees 2019EMultiple
$4.91 / 128% 8.0x 8.5x 9.0x 9.5x
3.0x $3.42 / 59% $3.98 / 85% $4.53 / 111% $5.09 / 137%
4.0x $3.89 / 81% $4.44 / 107% $5.00 / 132% $5.55 / 158%
5.0x $4.35 / 102% $4.91 / 128% $5.46 / 154% $6.02 / 180%
NuevaTel
2019EMultiple
Trilogy Sum-of-the-Parts Valuation and Sensitivity Analysis
Sensitivity Analysis: Intrinsic Value per Share (C$) & Premium to TRL Share Price (%)
Trilogy is trading at a meaningful discount to its intrinsic value](https://image.slidesharecdn.com/september-2019-investor-presentation-200223232107/85/September-2019-Investor-Presentation-6-320.jpg)
![Trilogy International Partners Inc. confidential information. Not meant for distribution
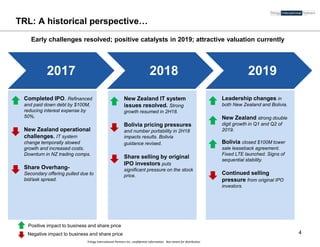
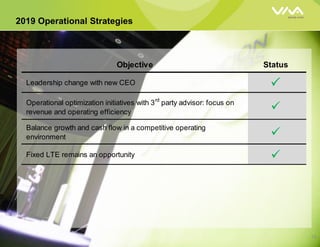
350
423
454 468
2015 2016 2017 2018
NZ Subscriber
Revenue (NZ$M)
43
55
71 73
2015 2016 2017 2018E
Segment FCF ($M)
147
163 162
156
2015 2016 2017 2018
Segment Adj EBITDA
($M)
Solid position in
three-player mobile
markets
Increasing
LTE coverage
Continue to drive
data adoption and
postpaid subscribers
Stable financial
performance
Generate increasing
Segment FCF [1]
Stable Foundation for Growth
Opportunity Investment Results
Positioned for strong Adj. EBITDA and Segment FCF growth [1]
7
[1] Segment FCF = (Segment Adj. EBITDA – Capital Expenditures) see disclaimer for non-GAAP measures.
[2] NZ mobile revenue share from IDC Tracker, Bolivia data from 4Q18 management estimates; other LatAm stats.
[3] Subscriber Revenue = Mobile and fixed subscriber revenue.
[4] FX rate impact USD$2M.
[2]
[2]
[1]
Positioned for Adjusted EBITDA and Segment FCF [1] growth
19% 51% 60% 81% 95%
LTE % of total sites
[3]
[4]](https://image.slidesharecdn.com/september-2019-investor-presentation-200223232107/85/September-2019-Investor-Presentation-8-320.jpg)
![Trilogy International Partners Inc. confidential information. Not meant for distribution
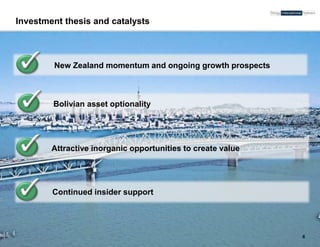
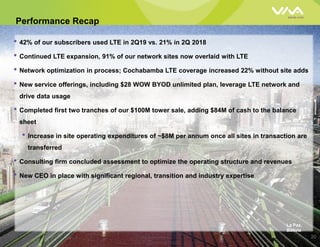
Meaningful Scale in Attractive 3-Player Telecom Markets
Source: Company filings, management analysis and CIA Factbook
[1] Includes operating under Western Wireless International
[2] 97% own network, 99% including roaming agreement with Vodafone
[3] Includes 400 towers which are operated under long term leases
[4] Segmentation % based on FY 2019 Guidance mid-point and excludes HQ related items
.
8
Bolivia
11.3M population
Operating since 2000
[1]
71.5% ownership
Acquired in 2006
Wireless summary (2Q 2019 unaudited)
Wireless Subscribers 1.99M
Wireless Subscriber market share 20%
% Postpaid of wireless subscriber base 17%
Network summary (2Q 2019 unaudited)
Population coverage 69%
Total cell sites 1,248[3]
4G / LTE sites 1,129
% Total cell sites 90%
Concentration[4]
(2019 Guidance)
% of Segment Service Revenue 38%
% of Segment Adjusted EBITDA 30%
62%
70%
99%
32%
97% / 99%
[2]
1,107
1,096
1.41M
23%
New Zealand
4.5M population
Operating since 2009
73.3% ownership
Launched in 2009](https://image.slidesharecdn.com/september-2019-investor-presentation-200223232107/85/September-2019-Investor-Presentation-9-320.jpg)

![Trilogy International Partners Inc. confidential information. Not meant for distribution
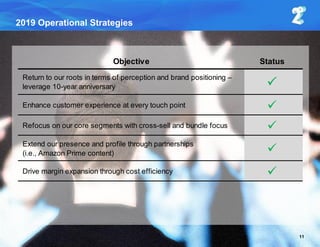
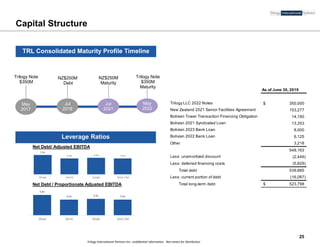
[1] Global Data, December 2018
[2] New Zealand Commerce Commission; Telecom Monitoring Report updated 12/18/18
[3] Revenue includes mobile handset and excludes incoming revenue.
[4] Market share split from IDC Tracker (4Q13 and 1Q19)
[5] Represents other predominantly broadband service providers in market
Strong Economic Fundamentals Drive Telco Market
Growing revenue share of sizeable market
Other
NZD$5.5Bn
telecom
market [3,4]
Continue GDP Growth [1]
NZ Mobile Retail Revenue (NZ$B) [2]
Substantial and growing mobile market
10
2degrees revenue share more than doubled in 6 years
2013
2019
NZD$4.9Bn
telecom
market [3,4]
[5]
Other
[5]](https://image.slidesharecdn.com/september-2019-investor-presentation-200223232107/85/September-2019-Investor-Presentation-11-320.jpg)
![Trilogy International Partners Inc. confidential information. Not meant for distribution
2degrees: Postpaid subscriber growth driving revenue and
segment free cash flow
13
(NZ$M)
Adjusted EBITDA & Margin [1,2,3]
Postpaid Net Additions Wireline Net Additions
[1] See Disclaimer for definitions of non-US GAAP measures -- Adjusted EBITDA, Adjusted EBITDA margin.
[2] Adjusted EBITDA margin by segment is calculated as Adjusted EBITDA by segment divided by service revenues by segment.
[3] Accounting Standards Update (“ASU”) 2014-09, “Revenue from Contracts with Customers (Topic 606)” was implemented on January 1, 2019. Financial information prior to implementation date has not been adjusted.
91% YoY Growth44% YoY Growth
112% YoY Growth69% YoY Growth
US$ $24 $26 $25 $27
Postpaid Churn](https://image.slidesharecdn.com/september-2019-investor-presentation-200223232107/85/September-2019-Investor-Presentation-14-320.jpg)
![Trilogy International Partners Inc. confidential information. Not meant for distribution
[1] Accounting Standards Update (“ASU”) 2014-09, “Revenue from Contracts with Customers (Topic 606)” was implemented on January 1, 2019. Financial information prior to implementation date has not been adjusted.
[2] Foreign currency exchange decline of 6% year over year
[3] These are Non-GAAP measures and do not have standardized meaning under GAAP. Therefore, they are unlikely to be comparable to similar measures presented by other companies
[4] Adjusted EBITDA Margin is calculated as Adjusted EBITDA divided by Service revenues.
[5] Represents purchases of property and equipment excluding purchases of property and equipment acquired through vendor-backed financing and capital lease arrangements.
2Q 2019 New Zealand Results (US$)
14
Financial Results[1] [2]
• Strong postpaid and broadband net
customer additions, with both nearly
doubling over the second quarter of
last year
• Subscriber service revenues
increased 6% over the second quarter
of last year on an organic basis
• Adjusted EBITDA increased 18% year
over year on an organic basis
• Favorable NRS impact for the second
quarter 2019 of US$2.5M
Three Months Ended June 30,
(US dollars in millions unless otherwise noted, unaudited)
2019 2018 % Chg
Revenues
Wireless service revenues 65.3 67.4 (3%)
Wireline service revenues 17.2 15.9 8%
Non-subscriber ILD and other revenues 1.8 3.4 (46%)
Service revenues 84.3 86.7 (3%)
Equipment sales 42.0 49.8 (16%)
Total revenues 126.3 136.5 (7%)
Adjusted EBITDA[3] 27.0 22.0 23%
Adjusted EBITDA margin[3] [4] 32.1% 25.4% n/m
Capital expenditures[5] 16.0 12.8 25%
Capital intensity 19% 15% n/m
Subscriber Results
Three Months Ended June 30,
(Thousands unless otherwise noted) 2019 2018 % Chg
Postpaid
Gross additions 27.0 23.7 14%
Net additions 13.7 7.2 91%
Total postpaid subscribers 451.2 408.3 11%
Prepaid
Net (losses) additions (22.7) 0.9 n/m
Total prepaid subscribers 954.3 983.5 (3%)
Total wireless subscribers 1,405.5 1,391.8 1%
Wireline
Gross additions 11.5 7.7 50%
Net additions 6.2 2.9 112%
Total wireline subscribers 93.4 74.6 25%
Total Subscribers 1,498.8 1,466.4 2%
Monthly blended wireless ARPU ($, not rounded) 15.43 16.20 (5%)
Monthly postpaid wireless ARPU ($, not rounded)
32.07 35.65 (10%)
Monthly prepaid wireless ARPU ($, not rounded) 7.60 7.90 (4%)
Monthly residential wireline ARPU ($, not rounded) 47.53 52.39 (9%)
Blended wireless churn 2.8% 2.3% n/m
Postpaid Churn 1.3% 1.6% n/m
n/m - not meaningful](https://image.slidesharecdn.com/september-2019-investor-presentation-200223232107/85/September-2019-Investor-Presentation-15-320.jpg)
![Trilogy International Partners Inc. confidential information. Not meant for distribution
Increasing Profitability and Free Cash Flow Generation
(NZ$M)(000s)
(NZ$M) (NZ$M)
[1] Adjusted EBITDA margin by segment is calculated as Adjusted EBITDA by segment divided by service revenues by segment.
[2] New Zealand capital expenditures represent purchases of property and equipment from continuing operations as it is presented in US$ in the segment information and which is a component of the total included in the Consolidated Statement of
Cash Flows. Capital expenditures does not include the property and equipment additions which are financed under vendor-backed financing or capital lease arrangements. Capital projects require significant and on-going planning and thus
timing of related cash outflows is subject to negotiations with vendors, project delivery dates, milestone acceptance and timing of supplier invoicing. As such, timing of cash and capital expenditures may differ materially from projected amounts.
[3] Adjusted EBITDA Less Capital Expenditures represents a non-U.S. GAAP measure, please refer to "Non-GAAP reconciliation" in the disclaimer.
[4] 2019E represents mid-point of full year guidance range and includes new revenue standards of reduced service revenue of NZ$5M and increased adjusted EBITDA of NZ$12M. For additional details refer to disclaimer.
[5] Non-core revenue decreased NZ$ 9M from 2017-2018
Adjusted EBITDA & Margin [1]
Ending Subscribers Service Revenue
Adjusted EBITDA Less Capital Expenditures [2,3]
2% 9% 13% 16% 19% 22% 25% 27% 29%
Postpaid % of Total Subs
2018 2G shutdown
reduced subs 37k
15
US$ $71 $127 $178 $216 $247 $254 $316 $345 $339 $346
US$ ($24) ($28) $8 $35 $47 $55 $81 $85 $90 $105
[4]
[4]
$39 $39 $51 $51 $61 $84 $73 $76 $77
Capital Expenditures
US$ ($52) ($59) ($33) ($6) ($4) ($2) $30 $31 $37
[5]](https://image.slidesharecdn.com/september-2019-investor-presentation-200223232107/85/September-2019-Investor-Presentation-16-320.jpg)

![Trilogy International Partners Inc. confidential information. Not meant for distribution
Stable Economic Backdrop and Robust Middle Class
Source: World Bank, Global Data, Fitch Ratings, Moody’s, and Standard & Poor's
[1] Global Data – Bolivia, Sept. 2019; EIU December 2018 – peer group includes Brazil, Mexico, Argentina, Colombia, Chile, Peru, Ecuador, and Uruguay
[2] Global Data – September 2019
Bolivia’s strong GDP growth relative to peers [1]
Growing income across population [2]
Nominal GDP in US$B
Real GDP Growth
Inflation
Low and stable inflation [1]
Stable outlook and attractive country credit profile
• 1.5% CAGR population growth
• 4% CAGR PPP-adjusted GDP per capita growth
Rating agencies affirm a stable outlook for Bolivia
• Fitch Ratings (July 3, 2018): “GDP growth has been above peers in recent years despite the terms of
trade shock.”
• Moody’s (February 28, 2019): “Fiscal strength assessed at “High (-)” to reflect Bolivia’s fiscal savings
and moderate debt levels.”
• S&P (May 24, 2018): “The outlook is stable, reflecting our view that Bolivia’s economy will continue
to grow, underpinned by sustained levels of public investment and consumption, as well as a
recovery in external revenues.”
Bolivia Argentina Brazil Columbia Mexico Peru Chile
Ba3 B2 Ba2 Baa2 A3 A3 A1
BB- B BB- BBB- BBB+ BBB+ A+
BB- B BB- BBB BBB+ BBB+ A
17](https://image.slidesharecdn.com/september-2019-investor-presentation-200223232107/85/September-2019-Investor-Presentation-18-320.jpg)
![Trilogy International Partners Inc. confidential information. Not meant for distribution
Upside relative to LATAM peers
Favorable Business Cycle
LTE Cell Sites & Penetration
LTE Subscribers and % of Total Subscribers
LTE rollout largely complete…
… declining LTE handset prices and network expansion results
in growing base of LTE subscribers…
and increasing data usage.
Data MB per average LTE subscriber [3]
Source: Management reporting and estimates
[1] Sources: 1Q 2019 GSMAi
[2] Bolivia data from 2Q 2019 management estimates; other LatAm stats as of 1Q 2019 GSMAi
[3] Data MB per average LTE subscriber refers to the amount of internet traffic consumed by the average LTE device user; growth expressed in quarterly compounding terms.
Latin America Wireless Penetration 1Q 2019 [1,2]
Subscriber Market Share 2Q 2019 [2]
20192017 2018
20192017 201820192017 2018
18](https://image.slidesharecdn.com/september-2019-investor-presentation-200223232107/85/September-2019-Investor-Presentation-19-320.jpg)
![Trilogy International Partners Inc. confidential information. Not meant for distribution
2Q 2019 Bolivia Results
• Service revenues declined 15% year
over year due to competitive market
pressure as well as elevated customer
churn
• Adjusted EBITDA declined 38% year
over year due primarily to service
revenues decline and negative margin
impact from certain 2019 expenses
• Year over year comparisons impacted
by tower leaseback transaction
• Increase in Q2 site operating
expenditures related to tower
sale impact of ~$1.2M
• Service revenues and ARPU relatively
stable on a sequential basis
Three Months Ended June 30,
(US dollars in millions unless otherwise noted, unaudited) 2019 2018 % Chg
Revenues
Wireless service revenues 50.7 60.3 (16%)
Non-subscriber ILD and other revenues 0.8 0.5 48%
Service revenues 51.5 60.8 (15%)
Equipment sales 1.5 0.7 120%
Total revenues 53.1 61.5 (14%)
Adjusted EBITDA[2]
11.4 18.3 (38%)
Adjusted EBITDA margin[2][3]
22.1% 30.0% n/m
Capital expenditures[4]
5.6 7.9 (29%)
Capital intensity 11% 13% n/m
Subscriber Results
Three Months Ended June 30,
(Thousands unless otherwise noted) 2019 2018 % Chg
Postpaid
Gross additions 16.2 16.0 1%
Net (losses) additions (0.7) 4.0 (119%)
Total postpaid subscribers 332.0 345.8 (4%)
Prepaid
Net (losses) additions (23.3) 18.4 (226%)
Total prepaid subscribers 1,597.2 1,871.8 (15%)
Total Wireless Subscribers[5]
1,987.7 2,277.8 (13%)
Monthly blended wireless ARPU ($, not rounded) 8.46 8.87 (5%)
Monthly postpaid wireless ARPU ($, not rounded) 20.50 23.28 (12%)
Monthly prepaid wireless ARPU ($, not rounded) 5.67 5.88 (4%)
Blended wireless churn 7.0% 8.2% n/m
Postpaid Churn 2.1% 1.7% n/m
n/m - not meaningful
21
Financial Results[1]
[1] Accounting Standards Update (“ASU”) 2014-09, “Revenue from Contracts with Customers (Topic 606)” was implemented on January 1, 2019. Financial information prior to implementation date has not been adjusted.
[2] These are Non-GAAP measures and do not have standardized meaning under GAAP. Therefore, they are unlikely to be comparable to similar measures presented by other companies
[3] Adjusted EBITDA Margin is calculated as Adjusted EBITDA divided by Service revenues.
[4] Represents purchases of property and equipment excluding purchases of property and equipment acquired through vendor-backed financing and capital lease arrangements.
[5] Includes public telephony and other wireless subscribers.](https://image.slidesharecdn.com/september-2019-investor-presentation-200223232107/85/September-2019-Investor-Presentation-22-320.jpg)
![Trilogy International Partners Inc. confidential information. Not meant for distribution
$189 $218
$253 $250
$218
$179
$146
$121 $113
$2
$9
$14 $22
$43
$71
$99
$116
$107
$236
$264
$302 $305 $293 $281 $270
$255
$236
$210
2010 2011 2012 2013 2014 2015 2016 2017 2018 2019E
Data revenues Voice revenues Other
Bolivia Financial Performance
[1] Adjusted EBITDA margin shown as a percent of service revenue
[2] Bolivia capital expenditures represent purchases of property and equipment from continuing operations as it is presented in the segment information and which is a component of the total included in the Consolidated Statement of Cash
Flows. Capital expenditures does not include the property and equipment additions which are financed under vendor-backed financing or capital lease arrangements. Capital projects require significant and on-going planning and thus timing
of related cash outflows is subject to negotiations with vendors, project delivery dates, milestone acceptance and timing of supplier invoicing. As such, timing of cash and capital expenditures may differ materially from projected amounts.
[3] Adjusted EBITDA Less Capital Expenditures represents a non-U.S. GAAP measure, please refer to "Non-GAAP reconciliation" in the disclaimer.
[4] 2019E represents mid-point of full year guidance range and includes new revenue standards of reduced service revenue of $5M and increased adjusted EBITDA of $4M. For additional details refer to disclaimer
[5] Includes incremental expense associated with $100M tower sale leaseback transaction of approximately $5M
Ending Subscribers Mobile Subscriber Revenues
Adjusted EBITDA & Margin [1] Stable Adjusted EBITDA Less Capital Expenditures [2] [3]
(000s)
(US$M)
(US$M)
[4] [5]
[4]
22
(US$M)](https://image.slidesharecdn.com/september-2019-investor-presentation-200223232107/85/September-2019-Investor-Presentation-23-320.jpg)

![Trilogy International Partners Inc. confidential information. Not meant for distribution
2019 Full Year Guidance - Unchanged
[1] The impact on guidance under the new revenue standard as it relates to service revenues primarily reflects the reallocation of revenue from service revenues to equipment sales. The impact on guidance under the new revenue standard as it
relates to Adjusted EBITDA primarily reflects the deferral and amortization of commissions paid to acquire postpaid and prepaid service contracts.
[2] Excludes the impact of foreign exchange rate for New Zealand. Average exchange rate assumes US$0.69 to NZ$1 (2018 actual).
[3] Includes incremental expense associated with $100M tower sale leaseback transaction
24
2018
Actual
2019
Guidance
2019 Guidance with impact of
New Revenue Standard [1]
(USD$ millions)
P Service revenues $339.4 Increase of 2% to 4% Increase of 1% to 3%
P Adjusted EBITDA $90.4 Increase of 6% to 8% Increase of 15% to 17%
P Service revenues $236.3 Decrease of 7% to 11% Decrease of 9% to 13%
P Adjusted EBITDA $65.5 Decrease of 35% to 40% Decrease of 29% to 34%
Business Segment
New Zealand [2]
Bolivia [3]](https://image.slidesharecdn.com/september-2019-investor-presentation-200223232107/85/September-2019-Investor-Presentation-25-320.jpg)
![Trilogy International Partners Inc. confidential information. Not meant for distribution
2Q 2019 Consolidated Results
27
Three Months Ended June 30,
(US dollars in millions unless otherwise noted, unaudited) 2019 2018 % Chg
Revenues
New Zealand 126.3 136.5 (7%)
Bolivia 53.1 61.5 (14%)
Unallocated Corporate & Eliminations 0.3 0.1 114%
Total revenues 179.6 198.1 (9%)
Total service revenues 136.1 147.6 (8%)
Net loss (6.4) (6.3) (1%)
Adjusted EBITDA
New Zealand 27.0 22.0 23%
Bolivia 11.4 18.3 (38%)
Unallocated Corporate & Eliminations (2.6) (2.7) 3%
Adjusted EBITDA[3]
35.7 37.5 (5%)
Adjusted EBITDA margin[3] [4]
26.3% 25.4% n/m
Cash provided by operating activities 3.4 5.2 (35%)
Capital expenditures[5]
21.6 20.8 4%
Capital intensity
16% 14% n/m
n/m - not meaningful
[1] Accounting Standards Update (“ASU”) 2014-09, “Revenue from Contracts with Customers (Topic 606)” was implemented on January 1, 2019. Financial information prior to implementation date has not been adjusted.
[2] Foreign currency exchange decline of 6% year over year
[3] These are Non-GAAP measures and do not have standardized meaning under GAAP. Therefore, they are unlikely to be comparable to similar measures presented by other companies
[4] Adjusted EBITDA Margin is calculated as Adjusted EBITDA divided by Service revenues.
[5] Represents purchases of property and equipment excluding purchases of property and equipment acquired through vendor-backed financing and capital lease arrangements.
Financial Results[1] [2]](https://image.slidesharecdn.com/september-2019-investor-presentation-200223232107/85/September-2019-Investor-Presentation-28-320.jpg)
![Trilogy International Partners Inc. confidential information. Not meant for distribution
50.0
30.0
50.0
1900 MHz 1700 / 2100 MHz 3500 MHz
20.0 19.6
50.0
30.0
700 MHz 900 MHz 1800 MHz 2100 MHz
Strong Spectrum Holdings in Desirable Spectrum Bands
Expiry 2031 2031 2021 2021 Expiry 2019-2028 2029 2024-2027
(in MHz) (in MHz)
New Zealand[1] Bolivia
[2] [3]
[4]
Note: Spectrum holdings as of 2Q2019.
[1] NZ regulator has stated expect to allocate 3.5 MHz spectrum in 2020, but national spectrum rights will not be available until November of 2022, when the rights expire for the current owners of this spectrum. Payment to begin in
mid- 2022.
[2] The 2031 expiration for the 700 MHz spectrum is conditioned on payment of the spectrum license cost in installments by 2019. If the aforementioned criteria are not satisfied, the 700 MHz spectrum license expires in 2020.
[3] The 2031 expiration for the 900 MHz spectrum is conditioned on payment by May 2022 of the price of the spectrum license and satisfying certain New Zealand Commerce Act requirements per the sale offer. If these criteria are
not satisfied, the rights to use the 900 MHz spectrum expire in 2022 except for 4 MHz that expires in 2031.
[4] NZ regulator has priced 1800 and 2100 MHz spectrum renewals at NZD 720K per MHz, implying NZD $50 million for 2degrees’ renewals. Can be paid over five years in equal installments beginning in January 2021 with the last
payment in April of 2026. The regulator has changed renewal allocations of 1800 MHz for all mobile operators to 40 MHz from the current 50 MHz. There is no change to the 2100 MHz spectrum allocations for the renewal.
[5] 30 MHz (15MHz x2) expires in November 2019 and 20MHz (10MHz x2) expires in April 2028.
28
[4] [4]](https://image.slidesharecdn.com/september-2019-investor-presentation-200223232107/85/September-2019-Investor-Presentation-29-320.jpg)
![Trilogy International Partners Inc. confidential information. Not meant for distribution
Corporate structure
Trilogy International
Partners Holdings
(U.S.) Inc.
(Delaware)
Trilogy
Class C Unit
Holders
NuevaTel
(PCS de
Bolivia) S.A
(Bolivia)
Two Degrees
Mobile Limited
(New
Zealand)
2degrees
Minority
Holders
Comteco
100%
68.6%
31.4%
Nominal economic interest
28.5% 26.7%
TIP Inc.
(British Columbia)
Trilogy
International
Partners LLC
(Washington)
(Trilogy LLC Note $350M)
71.5% 73.3%
OpCo Debt at
06/30/2019:
$42M
OpCo Debt at
06/30/2019:
$153M
Note: Details related to wholly owned subsidiaries not shown in the simplified chart above may be found in the Annual Information Form (AIF) of Trilogy International Partners, Inc.
(March 27, 2019) and in the Indenture relating to the Senior Notes due May 2022 of Trilogy International Partners LLC (May 2, 2017). Ownership percentages are as of June 30,
2019
[1] 2degrees debt repaid in $NZD
[1]
29](https://image.slidesharecdn.com/september-2019-investor-presentation-200223232107/85/September-2019-Investor-Presentation-30-320.jpg)


