Download free for 30 days
Sign in
Upload
Language (EN)
Support
Business
Mobile
Social Media
Marketing
Technology
Art & Photos
Career
Design
Education
Presentations & Public Speaking
Government & Nonprofit
Healthcare
Internet
Law
Leadership & Management
Automotive
Engineering
Software
Recruiting & HR
Retail
Sales
Services
Science
Small Business & Entrepreneurship
Food
Environment
Economy & Finance
Data & Analytics
Investor Relations
Sports
Spiritual
News & Politics
Travel
Self Improvement
Real Estate
Entertainment & Humor
Health & Medicine
Devices & Hardware
Lifestyle
Change Language
Language
English
Español
Português
Français
Deutsche
Cancel
Save
EN
Uploaded by
AnhTrnQunh6
273 views
sensor_tower__state_of_mobile_2025__en.pdf
sensor_tower__state_of_mobile_2025__en.pdf
Software
◦
Read more
0
Save
Share
Embed
Embed presentation
Download
Download to read offline
1
/ 95
2
/ 95
3
/ 95
4
/ 95
5
/ 95
6
/ 95
7
/ 95
8
/ 95
Most read
9
/ 95
10
/ 95
Most read
11
/ 95
12
/ 95
13
/ 95
14
/ 95
15
/ 95
16
/ 95
17
/ 95
18
/ 95
Most read
19
/ 95
20
/ 95
21
/ 95
22
/ 95
23
/ 95
24
/ 95
25
/ 95
26
/ 95
27
/ 95
28
/ 95
29
/ 95
30
/ 95
31
/ 95
32
/ 95
33
/ 95
34
/ 95
35
/ 95
36
/ 95
37
/ 95
38
/ 95
39
/ 95
40
/ 95
41
/ 95
42
/ 95
43
/ 95
44
/ 95
45
/ 95
46
/ 95
47
/ 95
48
/ 95
49
/ 95
50
/ 95
51
/ 95
52
/ 95
53
/ 95
54
/ 95
55
/ 95
56
/ 95
57
/ 95
58
/ 95
59
/ 95
60
/ 95
61
/ 95
62
/ 95
63
/ 95
64
/ 95
65
/ 95
66
/ 95
67
/ 95
68
/ 95
69
/ 95
70
/ 95
71
/ 95
72
/ 95
73
/ 95
74
/ 95
75
/ 95
76
/ 95
77
/ 95
78
/ 95
79
/ 95
80
/ 95
81
/ 95
82
/ 95
83
/ 95
84
/ 95
85
/ 95
86
/ 95
87
/ 95
88
/ 95
89
/ 95
90
/ 95
91
/ 95
92
/ 95
93
/ 95
94
/ 95
95
/ 95
More Related Content
PDF
sensor_tower__state_of_mobile_2025__Vietnam.pdf
by
AnhTrnQunh6
PDF
App Annie: The State of Mobile 2021
by
Léo Xavier
PDF
App annie-2015-retrospective-en
by
Eytan Lerba
PDF
App annie-2015-retrospective-en
by
Thomas Pham
PDF
App Annie: The State of the App Economy in 2017
by
krystinedinh
PDF
2020 Mobile Apps Downloads and Usage Statistics
by
SwagSoft
PDF
202111_App_Annie_2022_Mobile_Predictions.pdf
by
ManiSood3
PDF
App annie state of mobile 2022
by
Shereen Badr
sensor_tower__state_of_mobile_2025__Vietnam.pdf
by
AnhTrnQunh6
App Annie: The State of Mobile 2021
by
Léo Xavier
App annie-2015-retrospective-en
by
Eytan Lerba
App annie-2015-retrospective-en
by
Thomas Pham
App Annie: The State of the App Economy in 2017
by
krystinedinh
2020 Mobile Apps Downloads and Usage Statistics
by
SwagSoft
202111_App_Annie_2022_Mobile_Predictions.pdf
by
ManiSood3
App annie state of mobile 2022
by
Shereen Badr
Similar to sensor_tower__state_of_mobile_2025__en.pdf
PDF
2017 Retrospective: A Monumental Year for the App Economy
by
Filipp Paster
PDF
5 Mobile App Predictions
by
Harsha MV
PDF
Sensor tower-q2-2021-data-digest
by
MarketingTrips
PDF
What Mobile Privacy Changes Mean for Your Holiday Strategy
by
Tinuiti
PPTX
Wonk Mobile Future of Mobile
by
Wonk Mobile
DOCX
Global Mobile App Stores Market 2013 – Explosive growth continues till 2017
by
Rajesh Prabhakar
PPTX
Using Market Data to Make Strategic Decisions (Priori Data presentation at th...
by
Priori Data
PPTX
Future of mobile Apps in India & Global market
by
Tapas Das
PDF
R 13-bii appmarketingreport-2013_freeappmkt
by
Centrum Adama Smitha
PDF
Latest Trends in the App Ecosystem
by
AppCoins
PDF
Mobile Trends | October 2013
by
space150
PDF
Annual state of_global_mobile_industry_2012_chetan_sharma_consulting
by
Chetan Sharma
PPTX
157 Mobile App Stats You Should Know About
by
Stuart Dredge
PDF
Mobile applications
by
MyPeepal Technologies Pvt. Ltd.
PDF
The State of App Downloads and Monetization Report : Latin America Q3 2015
by
InMobi
PDF
The State of App Downloads and Monetization Infographic : North America 2015
by
InMobi
PDF
Тенденции мобильных приложений 2021 года.
by
CPAex
PDF
The State of App Downloads and Monetization Report : North America Q2 2015
by
InMobi
PDF
The
by
ReportLinker.com
PDF
Priori Data Global Insights Report for iOS - November 2013
by
Priori Data
2017 Retrospective: A Monumental Year for the App Economy
by
Filipp Paster
5 Mobile App Predictions
by
Harsha MV
Sensor tower-q2-2021-data-digest
by
MarketingTrips
What Mobile Privacy Changes Mean for Your Holiday Strategy
by
Tinuiti
Wonk Mobile Future of Mobile
by
Wonk Mobile
Global Mobile App Stores Market 2013 – Explosive growth continues till 2017
by
Rajesh Prabhakar
Using Market Data to Make Strategic Decisions (Priori Data presentation at th...
by
Priori Data
Future of mobile Apps in India & Global market
by
Tapas Das
R 13-bii appmarketingreport-2013_freeappmkt
by
Centrum Adama Smitha
Latest Trends in the App Ecosystem
by
AppCoins
Mobile Trends | October 2013
by
space150
Annual state of_global_mobile_industry_2012_chetan_sharma_consulting
by
Chetan Sharma
157 Mobile App Stats You Should Know About
by
Stuart Dredge
Mobile applications
by
MyPeepal Technologies Pvt. Ltd.
The State of App Downloads and Monetization Report : Latin America Q3 2015
by
InMobi
The State of App Downloads and Monetization Infographic : North America 2015
by
InMobi
Тенденции мобильных приложений 2021 года.
by
CPAex
The State of App Downloads and Monetization Report : North America Q2 2015
by
InMobi
The
by
ReportLinker.com
Priori Data Global Insights Report for iOS - November 2013
by
Priori Data
Recently uploaded
PDF
Phone Tracker App for Family (2026)_ The Safe, Legit Way to Protect Loved One...
by
Mia Taylor
PDF
2026 Safety Roadmap: Systems, Skills, and Scale for EHS Leaders
by
TECH EHS Solution
PDF
AI-native development: from Prompt to Platform
by
Maxim Salnikov
PDF
Water Delivery App Development Solutions.pdf
by
eSiteWorld TechnoLabs Pvt. Ltd.
PDF
LogiNext Media Kit & Company Overview 2025
by
sanikaroy72
PPTX
Edison MuleSoft Meetup : Vibe Coding | MuleSoft Meetups
by
Sravan Lingam
PPTX
HackYourBrain_JFokusConference_03022026.pptx
by
SimonedeGijt
PDF
Visualizing Your Data Lake with Grafana - Amsterdam
by
Imma Valls Bernaus
PPTX
Best eCommerce Development Agency in USA | The Dataflux
by
Key Medsolutions Inc
PDF
ChampionMATES – Compete With Friends. Predict Sports. Become the Champion.
by
Rafal Ksiazek
PDF
Build a Scalable On-Demand Courier Service App.pdf
by
V3CUBE TECHNOLABS
DOCX
The Rise of Headless CMS in Modern Web Development.docx
by
work4noahmiller
PDF
LogiNext Media Kit & Company Overview 2025
by
nidhisharmaq7184
PDF
LogiNext Media Kit & Company Overview 2025
by
priyajoshi2929
PDF
Windows Server 2025 Administration Fundamentals 4ED
by
raynasolomon136
PDF
Smart ways to se AI in your business , presentation
by
AI n Dot Net
PDF
Why I Volunteer at FOSDEM and You Should Too
by
Imma Valls Bernaus
PDF
Figma systems development services
by
davidjohansen1597
PDF
Artificial Intelligence Planning (Harinath Palavalli)
by
Harinath Palavalli
PDF
LogiNext Media Kit & Company Overview 2025
by
smritipatil055
Phone Tracker App for Family (2026)_ The Safe, Legit Way to Protect Loved One...
by
Mia Taylor
2026 Safety Roadmap: Systems, Skills, and Scale for EHS Leaders
by
TECH EHS Solution
AI-native development: from Prompt to Platform
by
Maxim Salnikov
Water Delivery App Development Solutions.pdf
by
eSiteWorld TechnoLabs Pvt. Ltd.
LogiNext Media Kit & Company Overview 2025
by
sanikaroy72
Edison MuleSoft Meetup : Vibe Coding | MuleSoft Meetups
by
Sravan Lingam
HackYourBrain_JFokusConference_03022026.pptx
by
SimonedeGijt
Visualizing Your Data Lake with Grafana - Amsterdam
by
Imma Valls Bernaus
Best eCommerce Development Agency in USA | The Dataflux
by
Key Medsolutions Inc
ChampionMATES – Compete With Friends. Predict Sports. Become the Champion.
by
Rafal Ksiazek
Build a Scalable On-Demand Courier Service App.pdf
by
V3CUBE TECHNOLABS
The Rise of Headless CMS in Modern Web Development.docx
by
work4noahmiller
LogiNext Media Kit & Company Overview 2025
by
nidhisharmaq7184
LogiNext Media Kit & Company Overview 2025
by
priyajoshi2929
Windows Server 2025 Administration Fundamentals 4ED
by
raynasolomon136
Smart ways to se AI in your business , presentation
by
AI n Dot Net
Why I Volunteer at FOSDEM and You Should Too
by
Imma Valls Bernaus
Figma systems development services
by
davidjohansen1597
Artificial Intelligence Planning (Harinath Palavalli)
by
Harinath Palavalli
LogiNext Media Kit & Company Overview 2025
by
smritipatil055
sensor_tower__state_of_mobile_2025__en.pdf
1.
The industry's leading
report Stateof Mobile2025 Report
2.
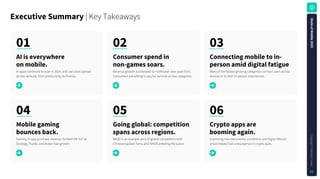
S t a t e o f M o b i l e 2 0 2 5 C o p y r i g h t © S e n s o r T o w e r 02 ExecutiveSummary| Key Takeaways 04 02 05 03 06 Mobilegaming bouncesback. Consumerspendin non-gamessoars. Goingglobal:competition spansacrossregions. Connectingmobiletoin- personamiddigitalfatigue Cryptoappsare boomingagain. Gaming
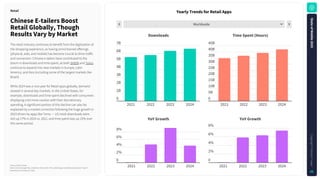
in-app purchase revenue climbed 4% YoY as Strategy, Puzzle, and Action fuel growth. Revenue growth accelerated to +25% year-over-year (YoY). Consumers are willing to pay for services across categories. Retail is an example area of global competition with Chinese-backed Temu and SHEIN entering the space. Many of the fastest growing categories connect users across devices or to their in-person experiences. Improving macroeconomic conditions and higher Bitcoin prices helped fuel a resurgence in crypto apps. 01 AIiseverywhere onmobile. AI apps continued to soar in 2024, and use cases spread across verticals, from productivity to finance.
3.
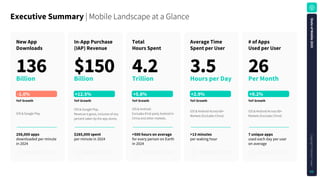
ExecutiveSummary| Mobile Landscape
at a Glance NewApp Downloads YoYGrowth iOS & Google Play 258,000apps downloaded per minute in 2024 136 Billion -1.0% In-AppPurchase (IAP)Revenue $150 Billion YoYGrowth iOS & Google Play. Revenue is gross, inclusive of any percent taken by the app stores. $285,000spent per minute in 2024 +12.5% Total HoursSpent 4.2 Trillion YoYGrowth iOS & Android. Excludes third-party Android in China and other markets. >500hoursonaverage for every person on Earth in 2024 +5.8% AverageTime SpentperUser 3.5 HoursperDay YoYGrowth iOS & Android Across 60+ Markets (Excludes China) >13minutes per waking hour +2.9% #ofApps UsedperUser 26 PerMonth YoYGrowth iOS & Android Across 60+ Markets (Excludes China) 7uniqueapps used each day per user on average +9.2% S t a t e o f M o b i l e 2 0 2 5 C o p y r i g h t © S e n s o r T o w e r 03
4.
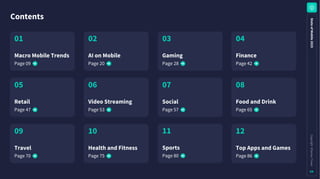
Contents S t a t e o f M o b i l e 2 0 2 5 C o p y r i g h t © S e n s o r T o w e r 04 01 01 MacroMobileTrends Page 09 02 AIonMobile Page 20 03 Gaming Page
28 04 Finance Page 42 01 05 Retail Page 47 06 VideoStreaming Page 53 07 Social Page 57 08 FoodandDrink Page 65 11 Sports Page 80 10 HealthandFitness Page 75 01 09 Travel Page 70 12 TopAppsandGames Page 86
5.
Note: Top publishers
by app store revenue | Source: Sensor Tower SensorTower| Our Customers Top publishers trust Sensor Tower insights to grow their business. S t a t e o f M o b i l e 2 0 2 5 C o p y r i g h t © S e n s o r T o w e r 05
6.
Next level insights. data.aiisnowpart ofSensorTower
7.
Aboutthisdata: Methodology SensorTower’sInsightsteamcompiledthedownloadandIAP revenueestimatesprovidedinthisreportusingtheSensor TowerMobileAppInsightsplatform. FigurescitedinthisreportreflectiOSAppStoreandGoogle PlaydownloadandrevenueestimatesforJanuary1,2014 throughDecember31,2024. Downloadestimatespresentedareonaper-userbasis, meaningthatonlyonedownloadperAppleorGoogle accountiscountedtowardsthetotal. Downloadsofthesameappbythesameusertomultiple devices,updates,orre-installsofthesameappbythesame userarenotcountedtowardsthetotal. Androidappdownloadandrevenueestimatesrepresent downloadsandrevenuefromtheGooglePlayStoreonly. SensorTowerdoesnotprovidedownloadestimatesforthird- partyAndroidstores. In-apppurchase(IAP)revenueestimatesaregross—inclusive ofanypercenttakenbytheappstores.Revenueincludespaid downloads,in-apppurchases,andsubscriptionsfromtheiOS AppStoreandGooglePlay.Thisdoesnotincludeanyrevenue fromadvertisementsorthird-partypurchases. ViewDetailedReportMethodologyHere. S t a t e o f M o b i l e 2 0 2 5 C o p y r i g h t © S e n s o r T o w e r 07
8.
InterestedinourDigital MarketInsightsSolutions? If you want
to learn more about Sensor Tower, please request a demo: Get the latest insights on our blog: sensortower.com/blog Requestafreedemo!
9.
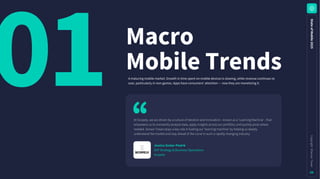
01 S t a t e o f M o b i l e 2 0 2 5 C o p y r i g h t © S e n s o r T o w e r 09 Macro MobileTrends At Scopely, we
are driven by a culture of iteration and innovation - known as a ‘Learning Machine' - that empowers us to constantly analyze data, apply insights across our portfolio, and quickly pivot where needed. Sensor Tower plays a key role in fueling our ‘learning machine’ by helping us deeply understand the market and stay ahead of the curve in such a rapidly changing industry. JessicaZestar-Postrk SVP Strategy & Business Operations Scopely A maturing mobile market. Growth in time spent on mobile devices is slowing, while revenue continues to soar, particularly in non-games. Apps have consumers' attention — now they are monetizing it.
10.
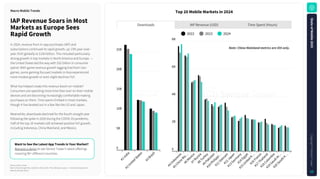
Source: Sensor Tower Note:
iOS and Google Play combined. iOS only for China. Revenue is gross — inclusive of any percent taken by the app stores. Top20MobileMarketsin2024 WanttoSeetheLatestAppTrendsinYourMarket? Request a demo to see Sensor Tower's latest offerings covering 90+ different countries. IAPRevenueSoarsinMost MarketsasEuropeSees RapidGrowth In 2024, revenue from in-app purchases (IAP) and subscriptions continued its rapid growth, up 13% year-over- year (YoY) globally to $150 billion. This included particularly strong growth in top markets in North America and Europe — the United States led the way with $52 billion in consumer spend. With game revenue growth lagging that from non- games, some gaming-focused markets in Asia experienced more modest growth or even slight declines YoY. What has helped create this revenue boom on mobile? Consumers are spending more time than ever on their mobile devices and are becoming increasingly comfortable making purchases on them. Time spent climbed in most markets, though it has leveled out in a few like the US and Japan. Meanwhile, downloads declined for the fourth straight year following the spike in 2020 during the COVID-19 pandemic. Half of the top 10 markets still achieved positive YoY growth, including Indonesia, China Mainland, and Mexico. MacroMobileTrends Downloads IAP Revenue (USD) Time Spent (Hours) Rank 1 25B 20B 15B 10B 5B 0 # 1 I n d i a # 2 U n i t e d S t a t e s # 3 B r a z i l 8B 6B 4B 2B 0 # 4 I n d o n e s i a # 5 C h i n a M a … # 6 M e x i c o # 7 R u s s i a # 8 T u r k e y # 9 P a k i s t a n # 1 0 P h i l i p p i … # 1 1 V i e t n a m # 1 2 J a p a n # 1 3 G e r m a n y # 1 4 E g y p t # 1 5 U n i t e d K … # 1 6 F r a n c e # 1 7 T h a i l a n d # 1 8 C o l o m b i a # 1 9 S a u d i A r … # 2 0 S o u t h K … Note:ChinaMainlandmetricsareiOSonly. 2022 2024 2023 S t a t e o f M o b i l e 2 0 2 5 C o p y r i g h t © S e n s o r T o w e r 10
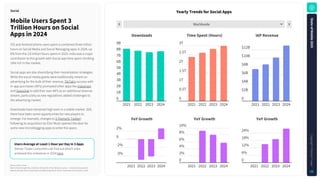
11.
Source: Sensor Tower Note:
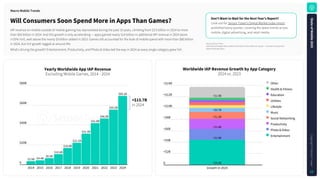
iOS and Google Play combined. iOS only for China. Revenue is gross — inclusive of any percent taken by the app stores. YearlyWorldwideAppIAPRevenue Excluding Mobile Games, 2014 - 2024 WorldwideIAPRevenueGrowthbyAppCategory 2024 vs. 2023 Don'tWanttoWaitfortheNextYear'sReport? Look out for Sensor Tower's Digital Market Index report published every quarter, covering the latest trends across mobile, digital advertising, and retail media. WillConsumersSoonSpendMoreinAppsThanGames? IAP revenue on mobile outside of mobile gaming has skyrocketed during the past 10 years, climbing from $3.5 billion in 2014 to more than $69 billion in 2024. And this growth is only accelerating — apps gained nearly $14 billion in additional IAP revenue in 2024 alone (+25% YoY), well above the nearly $9 billion added in 2023. Games still accounted for the bulk of mobile spend with more than $80 billion in 2024, but YoY growth lagged at around 4%. What's driving the growth? Entertainment, Productivity, and Photo & Video led the way in 2024 as every single category grew YoY. MacroMobileTrends $80B $60B $40B $20B 0 2014 2015 2016 2017 2018 2019 2020 2021 2022 2023 2024 $3.5B $4.4B $6.5B $10.6B $16.8B $22.1B $31.3B $41.8B $46.6B $55.5B $69.2B +$14B +$12B +$10B +$8B +$6B +$4B +$2B 0 Growth in 2024 +$4.4B +$1.9B +$1.8B +$1.2B +$0.7B +$1.9B Other Health&Fitness Education Utilities Lifestyle Music SocialNetworking Productivity Photo&Video Entertainment +$13.7B in 2024 S t a t e o f M o b i l e 2 0 2 5 C o p y r i g h t © S e n s o r T o w e r 11
12.
Source: Sensor Tower Note:
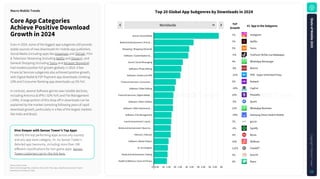
iOS and Google Play combined. iOS only for China. Apps classified using Sensor Tower's taxonomy as of January 5, 2025. Top20GlobalAppSubgenresbyDownloadsin2024 DiveDeeperwithSensorTower'sTopApps Identify the top performing apps across any country and any app store category. Or, try Sensor Tower's detailed app taxonomy, including more than 180 different classifications for non-game apps. Sensor Tower customers can try the link here. CoreAppCategories AchievePositiveDownload Growthin2024 MacroMobileTrends 1% Instagram 7% Netflix 5% Temu -5% TickTock-TikTok Live Wallpaper 4% WhatsApp Messenger -8% Remini -32% VPN - Super Unlimited Proxy 2% Nubank -10% CapCut 10% PhonePe -5% Quark 12% WhatsApp Business -24% Samsung Smart Switch Mobile 7% gov.br -6% Spotify 3% MyJio 10% DDMusic 112% ChatGPT 5% OmeTV 3% fitpro Worldwide Social | Social Media Media & Entertainment | Film &… Shopping | Shopping (General) Software | Customization &… Social | Social Messaging Software | Photo Editing Software | Antivirus & VPN Financial Services | Consumer… Software | Video Editing Financial Services | Digital Wallet… Software | Other Utilities Software | Other Business &… Software | File Management Law & Government | Law &… Media & Entertainment | Music &… Telecom | Telecom Software | Media Players AI | AI Chatbots Media & Entertainment | Dating Health & Wellness | Gyms & Fitness 0 0.5B 1B 1.5B 2B 2.5B 3B 3.5B 4B 4.5B 5B 5.5B 6B YoY Growth #1 AppintheSubgenre Even in 2024, some of the biggest app subgenres still provide stable sources of new downloads for mobile app publishers. Social Media (including apps like Instagram and TikTok), Film & Television Streaming (including Netflix and Disney+), and General Shopping (including Temu and Amazon Shopping) had modest positive YoY growth globally in 2024. A few Financial Services subgenres also achieved positive growth, with Digital Wallet & P2P Payment app downloads climbing 10% and Consumer Banking app downloads up 2% YoY. In contrast, several Software genres saw notable declines, including Antivirus & VPN (-32% YoY) and File Management (-24%). A large portion of this drop off in downloads can be explained by the market correcting following years of rapid download growth, particularly in a few of the largest markets like India and Brazil. S t a t e o f M o b i l e 2 0 2 5 C o p y r i g h t © S e n s o r T o w e r 12
13.
Source: Sensor Tower Note:
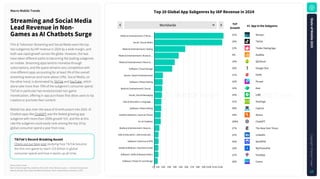
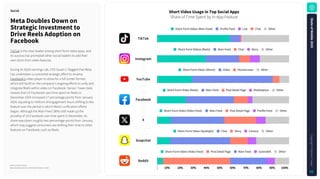
iOS and Google Play combined. iOS only for China. Revenue is gross — inclusive of any percent taken by the app stores. Apps classified using Sensor Tower's taxonomy as of January 5, 2025. Top20GlobalAppSubgenresbyIAPRevenuein2024 TikTok'sRecord-BreakingAscent Check out our blog post studying how TikTok became the first non-game to reach $15 billion in global consumer spend and how it stacks up all-time. StreamingandSocialMedia LeadRevenueinNon- GamesasAIChatbotsSurge MacroMobileTrends 31% Disney+ 29% TikTok 13% Tinder Dating App 9% Audible 18% QQ Music 29% Google One 11% ESPN 16% Picsart 16% Azar 14% LINE 31% Duolingo 59% CapCut 18% Strava 209% ChatGPT 27% The New York Times 22% LinkedIn 20% NordVPN 10% MyFitnessPal 12% FaceApp 26% Canva Worldwide Media & Entertainment | Film &… Social | Social Media Media & Entertainment | Dating Media & Entertainment | Books &… Media & Entertainment | Music &… Software | Cloud Storage Sports | Sports Entertainment Software | Photo Editing Media & Entertainment | Social… Social | Social Messaging Jobs & Education | Language… Software | Video Editing Health & Wellness | Gyms & Fitness AI | AI Chatbots Media & Entertainment | News &… Jobs & Education | Jobs & Educati… Software | Antivirus & VPN Health & Wellness | Nutrition & Diet Software | Selfie & Beauty Editors Software | Poster & Card Design 0 $1B $2B $3B $4B $5B $6B $7B $8B $9B $10B $11B $12B YoY Growth Film & Television Streaming and Social Media were the top two subgenres by IAP revenue in 2024 by a wide margin, and both saw rapid growth across the globe. However, the two have taken different paths to becoming the leading subgenres on mobile. Streaming apps tend to monetize through subscriptions, and the space remains very competitive with nine different apps accounting for at least 3% of the overall streaming revenue (and none above 15%). Social Media, on the other hand, is dominated by TikTok and YouTube, which alone take more than 70% of the subgenre's consumer spend. TikTok in particular has revolutionized non-game monetization, offering in-app purchases that allow users to tip creators or promote their content. Mobile has also risen the wave of AI enthusiasm into 2024. AI Chatbot apps like ChatGPT was the fastest growing app subgenre with more than 200% growth YoY, and the at this rate the subgenre could easily rank among the top 10 by global consumer spend a year from now. #1 AppintheSubgenre S t a t e o f M o b i l e 2 0 2 5 C o p y r i g h t © S e n s o r T o w e r 13
14.
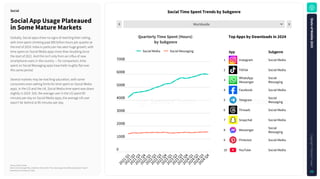
Source: Sensor Tower Note:
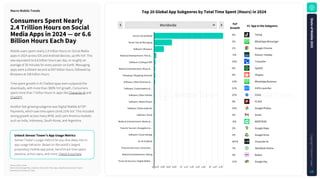
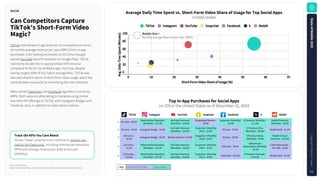
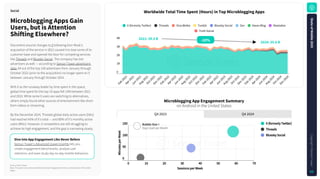
iOS and Google Play combined. iOS only for China. Apps classified using Sensor Tower's taxonomy as of January 5, 2025. Top20GlobalAppSubgenresbyTotalTimeSpent(Hours)in2024 UnlockSensorTower'sAppUsageMetrics Sensor Tower's usage metrics let you dive deep into in- app usage behavior. Based on the world’s largest proprietary mobile app panel, benchmark time spent, sessions, active users, and more. Check it out here. ConsumersSpentNearly 2.4TrillionHoursonSocial MediaAppsin2024—or6.6 BillionHoursEachDay MacroMobileTrends Worldwide Social | Social Media Social | Social Messaging Software | Browsers Media & Entertainment | Film &… Software | Calling & SMS Media & Entertainment | Music &… Shopping | Shopping (General) Software | Other Business &… Software | Customization &… Software | Other Utilities Software | Media Players Software | Photo Galleries Software | Email Media & Entertainment | Books &… Travel & Tourism | Navigation &… Software | Cloud Storage AI | AI Chatbots Financial Services | Consumer… Media & Entertainment | Dating Financial Services | Digital Wallet… 0 0.2T 0.4T 0.6T 0.8T 1T 1.2T 1.4T 1.6T 1.8T 2T 2.2T 2.4T 6% TikTok 2% WhatsApp Messenger 1% Google Chrome -5% Disney+ Hotstar 16% Truecaller 6% Spotify 9% Shopee 15% WhatsApp Business 21% HiOS Launcher 22% Clock 9% PLAYit 14% Google Photos 3% Gmail -8% WEBTOON 2% Google Maps 3% Google Drive 347% Character AI 7% SberBank Online 3% Badoo 21% Google Pay YoY Growth Mobile users spent nearly 2.4 trillion hours on Social Media apps in 2024 across iOS and Android devices, up 6% YoY. This was equivalent to 6.6 billion hours per day, or roughly an average of 50 minutes for every person on Earth. Messaging apps were a distant second at 607 billion hours, followed by Browsers at 330 billion hours. Time spent growth in AI Chatbot apps even outpaced the downloads, with more than 300% YoY growth. Consumers spent more than 7 billion hours in apps like Character AI and ChatGPT. Another fast growing subgenre was Digital Wallets & P2P Payments, which saw time spent climb 21% YoY. This included strong growth across many APAC and Latin America markets such as India, Indonesia, South Korea, and Argentina. #1 AppintheSubgenre S t a t e o f M o b i l e 2 0 2 5 C o p y r i g h t © S e n s o r T o w e r 14
15.
Source: Sensor Tower Note:
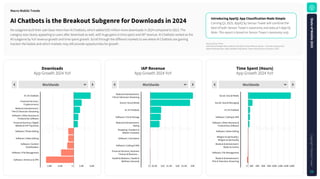
iOS and Google Play combined. iOS only for China. Revenue is gross — inclusive of any percent taken by the app stores. Apps classified using Sensor Tower's taxonomy as of January 5, 2025. Downloads App Growth 2024 YoY IAPRevenue App Growth 2024 YoY TimeSpent(Hours) App Growth 2024 YoY IntroducingAppIQ:AppClassificationMadeSimple Coming Q1 2025, AppIQ by Sensor Tower will combine the best of both Sensor Tower’s taxonomy and data.ai’s App IQ. Note: This report is based on Sensor Tower's taxonomy only. AIChatbotsistheBreakoutSubgenreforDownloadsin2024 No subgenre built their user base more than AI Chatbots, which added 635 million more downloads in 2024 compared to 2023. The category was clearly appealing to users after download as well, with huge gains in time spent and IAP revenue. AI Chatbots ranked as the #3 subgenre by YoY revenue growth and time spent growth. Scroll through the different markets to see where AI Chatbots are gaining traction the fastest and which markets may still provide opportunities for growth. MacroMobileTrends Worldwide AI | AI Chatbots Financial Services | Cryptocurrency Media & Entertainment | Film & Television Streaming Software | Other Business & Productivity Software Financial Services | Digital Wallets & P2P Payments Software | Photo Editing Software | Video Editing Software | Content Downloaders Software | File Management Software | Antivirus & VPN -0.8B -0.4B 0 0.4B 0.8B Worldwide Media & Entertainment | Film & Television Streaming Social | Social Media AI | AI Chatbots Software | Cloud Storage Media & Entertainment | Dating Shopping | Sneakers & Athletic Footwear Software | Calculators Software | Calling & SMS Financial Services | Business Finance & Business… Health & Wellness | Health & Wellness (General) 0 $0.5B $1B $1.5B $2B $2.5B $3B Worldwide Social | Social Media Social | Social Messaging AI | AI Chatbots Software | Calling & SMS Software | Other Business & Productivity Software Software | Video Editing Religion & Spirituality | Religion & Spirituality Media & Entertainment | Books & Comics Software | File Management Media & Entertainment | Film & Television Streaming 0 20B 40B 60B 80B 100B 120B 140B 160B S t a t e o f M o b i l e 2 0 2 5 C o p y r i g h t © S e n s o r T o w e r 15
16.
Source: Sensor Tower Note:
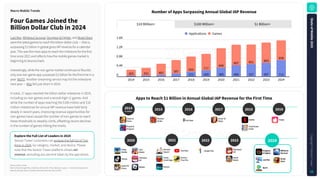
iOS and Google Play combined. iOS only for China. Revenue is gross — inclusive of any percent taken by the app stores. Includes estimates since the start of 2014. NumberofAppsSurpassingAnnualGlobalIAPRevenue ExploretheFullListofLeadersin2024 Sensor Tower customers can explore the full list of Top Apps in 2024, by category, market, and device. Please note that the Sensor Tower platform shows net revenue, excluding any percent taken by the app stores. FourGamesJoinedthe BillionDollarClubin2024 LastWar,WhiteoutSurvival,Dungeon&Fighter,andBrawlStars werethelatestgamestoreachthebilliondollarclub—thatis, surpassing$1billioninglobalgrossIAPrevenueforacalendar year.Thiswasthemostappstoreachthemilestoneforthefirst timesince2021andreflectshowthemobilegamesmarketis beginningtobounceback. Interestingly,whilethenon-gamemarketcontinuestoflourish, onlyonenon-gameappsurpassed$1billionforthefirsttimeina year:WeTV. Another streaming service may hit the milestone next year — Max fell just short in 2024. In total, 17 apps reached the billion dollar milestone in 2024, including six non-games and a record-high 11 games. And while the number of apps reaching the $100 million and $10 million milestones for annual IAP revenue have held fairly steady in recent years, improving revenue opportunities for non-games have caused the number of non-games to reach these thresholds to steadily climb, offsetting recent declines in the number of games hitting the marks. MacroMobileTrends AppstoReach$1BillioninAnnualGlobalIAPRevenuefortheFirstTime $10 Million+ $100 Million+ $1 Billion+ 1.6K 1.2K 0.8K 0.4K 0 2014 2015 2016 2017 2018 2019 2020 2021 2022 2023 2024 265 331 482 587 211 655 269 717 385 848 489 897 537 851 597 883 711 858 Applications Games 2014 orearlier 0NewApps 2015 2016 2017 2019 2018 2020 2021 2022 2023 Clashof Clans Puzzle& Dragons Monster Strike Honorof Kings Fate/Grand Order Netflix Tinder Coin Master PUBG Mobile Pokémon GO TikTok Gamefor Peace Roblox YouTube Genshin Impact Garena FreeFire Candy CrushSaga Disney+ GoogleOne Monopoly GO Royal Match 2024 Whiteout Survival Dungeon &Fighter LastWar Brawl Stars WeTV S t a t e o f M o b i l e 2 0 2 5 C o p y r i g h t © S e n s o r T o w e r 16
17.
Source: Sensor Tower Note:
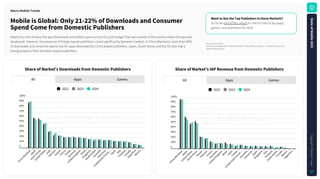
iOS and Google Play combined. iOS only for China. Revenue is gross — inclusive of any percent taken by the app stores. ShareofMarket'sDownloadsfromDomesticPublishers ShareofMarket'sIAPRevenuefromDomesticPublishers MobileisGlobal:Only21-22%ofDownloadsandConsumer SpendComefromDomesticPublishers Nearly four out of every five app downloads and dollars spent across iOS and Goolge Play was outside of the country where the app was developed. However, the presence of foreign-based publishers varied significantly between markets. In China Mainland, more than 90% of downloads and consumer spend was for apps developed by China-based publishers. Japan, South Korea, and the US also had a strong presence from domestic-based publishers. MacroMobileTrends All Apps Games 100% 90% 80% 70% 60% 50% 40% 30% 20% 10% 0 C h i n a M a i n l a n d J a p a n S o u t h K o r e a U n i t e d S t a t e s I n d i a V i e t n a m T a i w a n F r a n c e T u r k e y G e r m a n y U n i t e d K i n g d o m B r a z i l S i n g a p o r e S a u d i A r a b i a A u s t r a l i a I n d o n e s i a U n i t e d A r a b E m i r a t … S p a i n I t a l y T h a i l a n d C a n a d a A r g e n t i n a M e x i c o 2022 2023 2024 All Apps Games 100% 90% 80% 70% 60% 50% 40% 30% 20% 10% 0 C h i n a M a i n l a n d J a p a n U n i t e d S t a t e s S o u t h K o r e a T a i w a n V i e t n a m F r a n c e G e r m a n y U n i t e d K i n g d o m B r a z i l I n d i a T u r k e y U n i t e d A r a b E m i r a t … A u s t r a l i a I n d o n e s i a S p a i n S i n g a p o r e I t a l y T h a i l a n d S a u d i A r a b i a C a n a d a M e x i c o A r g e n t i n a 2022 2023 2024 WanttoSeetheTopPublishersintheseMarkets? Go to the end of this report for the full lists of top apps, games, and publishers for 2024. S t a t e o f M o b i l e 2 0 2 5 C o p y r i g h t © S e n s o r T o w e r 17
18.
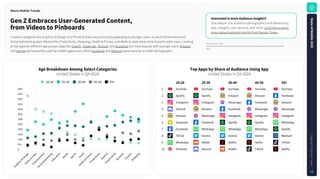
Source: Sensor Tower Note:
Among Android users in the United States. Includes YouTube and excludes other pre-installed apps. AgeBreakdownAmongSelectCategories United States in Q4 2024 InterestedinmoreAudienceInsights? Dive deeper into audience demographics and behavior by app, category, user persona, and more! Click here to learn more about Audience Insights from Sensor Tower. GenZEmbracesUser-GeneratedContent, fromVideostoPinboards Creative categories like Graphics & Design and Photo & Video are particularly appealing to younger users, as are Entertainment and Social Networking apps. Meanwhile, Productivity, Shopping, Health & Fitness, and Medical apps skew more towards older users. Looking at top apps for different age groups, apps like Spotify, Instagram, Discord, and Snapchat are more popular with younger users. Amazon and Venmo are frequently used by middle-aged users, while Facebook and Walmart skew towards an older demographic. MacroMobileTrends TopAppsbyShareofAudienceUsingApp United States in Q4 2024 YouTube YouTube YouTube YouTube YouTube Spotify Spotify Amazon Amazon Facebook Instagram Instagram Messenger Facebook Amazon Discord Amazon Facebook Messenger Messenger Amazon Messenger Instagram Instagram Instagram Snapchat Facebook Spotify Spotify WhatsApp Facebook WhatsApp WhatsApp WhatsApp Spotify TikTok Venmo Venmo Venmo Walmart WhatsApp Reddit Netflix Netflix TikTok Pinterest Discord Reddit TikTok Netflix 1 2 3 4 5 6 7 8 9 10 18-24 25-34 35-44 45-54 55+ 0 5% 10% 15% 20% 25% 30% 35% 40% 45% 50% 55% 60% G r a p h i c s & D e s i g n P h o t o & V i d e o E n t e r t a i n m e n t S o c i a l N e t w o r k i n g E d u c a t i o n B o o k s S p o r t s T r a v e l H e a l t h & F i t n e s s P r o d u c t i v i t y M e d i c a l F o o d & D r i n k B u s i n e s s F i n a n c e S h o p p i n g 18-24 25-34 35-44 45-54 55+ S t a t e o f M o b i l e 2 0 2 5 C o p y r i g h t © S e n s o r T o w e r 18
19.
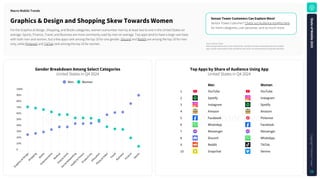
Source: Sensor Tower Note:
Among Android users in the United States. Includes YouTube and excludes other pre-installed apps. Gender represented as Men and Women only and is not representative of all gender identities. GenderBreakdownAmongSelectCategories United States in Q4 2024 S t a t e o f M o b i l e 2 0 2 5 C o p y r i g h t © S e n s o r T o w e r 19 Graphics&DesignandShoppingSkewTowardsWomen For the Graphics & Design, Shopping, and Books categories, women outnumber men by at least two to one in the United States on average. Sports, Finance, Travel, and Business are more commonly used by men on average. Top apps tend to have a large user base with both men and women, but a few apps rank among the top 10 for one gender. Discord and Reddit are among the top 10 for men only, while Pinterest and TikTok rank among the top 10 for women. MacroMobileTrends 0 10% 20% 30% 40% 50% 60% 70% 80% 90% 100% G r a p h i c s & D e s i g n S h o p p i n g B o o k s E n t e r t a i n m e n t M e d i c a l F o o d & D r i n k S o c i a l N e t w o r k i n g H e a l t h & F i t n e s s P r o d u c t i v i t y E d u c a t i o n P h o t o & V i d e o T r a v e l B u s i n e s s F i n a n c e S p o r t s Men Women TopAppsbyShareofAudienceUsingApp United States in Q4 2024 YouTube YouTube Spotify Instagram Instagram Spotify Amazon Amazon Facebook Pinterest WhatsApp Facebook Messenger Messenger Discord WhatsApp Reddit TikTok Snapchat Venmo 1 2 3 4 5 6 7 8 9 10 Men Women SensorTowerCustomersCanExploreMore! Sensor Tower customer? Check out Audience Insights here for more categories, user personas, and so much more.
20.
02 S t a t e o f M o b i l e 2 0 2 5 C o p y r i g h t © S e n s o r T o w e r 20 AIon Mobile AI continued its
rapid ascent on mobile in 2024. Generative AI was the breakout mobile genre, and market leaders across verticals found creative new ways to integrate AI into their mobile solutions. Fetch is America’s Rewards App because we’re obsessed with innovation that delivers real value to both brands and consumers. As mobile apps continue to drive the rise of e-commerce, Fetch is leading the way by expanding our rewards ecosystem into new consumer categories and introducing groundbreaking features like Fetch Play and Fetch Shop. Powered by patented AI and ML integrations, our mobile platform transforms everyday purchases and activities into highly personalized, rewarding experiences. We're redefining how people connect with the brand they love and find new ones to fall in love with, by creating a first-of-its-kind, rewards-based advertising ecosystem that delivers both rational and emotional value. AyoJimoh Chief Product Officer Fetch
21.
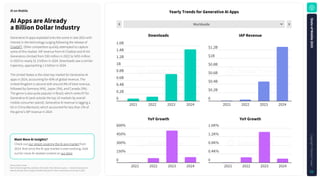
Worldwide 1 Rank Source: Sensor Tower Note:
iOS and Google Play combined. iOS only for China. Revenue is gross — inclusive of any percent taken by the app stores. AI apps classified using Sensor Tower's taxonomy as of January 5, 2025. YearlyTrendsforGenerativeAIApps WantMoreAIInsights? Check out our report covering the AI app market from 2024. And since the AI app market is ever evolving, look out for more AI-related content on our blog. AIAppsareAlready aBillionDollarIndustry Generative AI apps exploded onto the scene in late 2022 with interest in the technology surging following the release of ChatGPT. Other competitors quickly attempted to capture some of this market. IAP revenue from AI Chatbot and AI Art Generators climbed from $30 million in 2022 to $455 million in 2023 to nearly $1.3 billion in 2024. Downloads saw a similar trajectory, approaching 1.5 billion in 2024. The United States is the clear top market for Generative AI apps in 2024, accounting for 45% of global revenue. The United Kingdom is second with around 4% of total revenue, followed by Germany (4%), Japan (3%), and Canada (3%). The genre is also quite popular in Brazil, which ranks #7 for Generative AI (and outside the top 10 markets by overall mobile consumer spend). Generative AI revenue is lagging a bit in China Mainland, which accounted for less than 2% of the genre's IAP revenue in 2024. AIonMobile Downloads IAPRevenue 1.6B 1.4B 1.2B 1B 0.8B 0.6B 0.4B 0.2B 0 2021 2022 2023 2024 $1.2B $1B $0.8B $0.6B $0.4B $0.2B 0 2021 2022 2023 2024 600% 450% 300% 150% 0 2021 2022 2023 2024 YoYGrowth 1.6K% 1.2K% 0.8K% 0.4K% 0 2021 2022 2023 2024 YoYGrowth S t a t e o f M o b i l e 2 0 2 5 C o p y r i g h t © S e n s o r T o w e r 21
22.
Source: Sensor Tower Note:
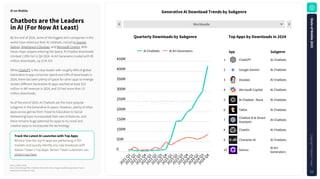
iOS and Google Play combined. iOS only for China. AI apps classified using Sensor Tower's taxonomy as of January 5, 2025. GenerativeAIDownloadTrendsbySubgenre TracktheLatestAILauncheswithTopApps Monitor how the top AI apps are performing in 90+ markets and quickly identify any new breakouts with Sensor Tower's Top Apps. Sensor Tower customers can check it out here. ChatbotsaretheLeaders inAI(ForNowAtLeast) By the end of 2024, some of the biggest tech companies in the world have rolled out their AI chatbots, including Google Gemini, ByteDance's Doubao, and Microsoft Copilot. With these major players entering the space, AI Chatbot downloads climbed 119% YoY in Q4 2024. AI Art Generators trailed with 85 million downloads, up 21% YoY. While ChatGPT is the clear leader with roughly 40% of global Generative AI app consumer spend and 23% of downloads in 2024, there has been plenty of space for other apps to emerge. Sixteen different Generative AI apps reached at least $10 million in IAP revenue in 2024, and 25 had more than 10 million downloads. As of the end of 2024, AI Chatbots are the most popular subgenre in the Generative AI space. However, plenty of other apps across genres from Travel to Education to Social Networking have incorporated their own AI features, and there remains huge potential for apps to try novel and creative ways to incorporate the technology AIonMobile Worldwide 1 Rank 0 50M 100M 150M 200M 250M 300M 350M 400M 450M 2 0 2 1 Q 1 2 0 2 1 Q 2 2 0 2 1 Q 3 2 0 2 1 Q 4 2 0 2 2 Q 1 2 0 2 2 Q 2 2 0 2 2 Q 3 2 0 2 2 Q 4 2 0 2 3 Q 1 2 0 2 3 Q 2 2 0 2 3 Q 3 2 0 2 3 Q 4 2 0 2 4 Q 1 2 0 2 4 Q 2 2 0 2 4 Q 3 2 0 2 4 Q 4 AI Chatbots AI Art Generators ChatGPT AI Chatbots Google Gemini AI Chatbots Doubao AI Chatbots Microsoft Copilot AI Chatbots AI Chatbot - Nova AI Chatbots Talkie AI Chatbots Chatbot AI & Smart Assistant AI Chatbots ChatOn AI Chatbots Character AI AI Chatbots Genius AI Art Generators 1 2 3 4 5 6 7 8 9 10 App Subgenre TopAppsbyDownloadsin2024 QuarterlyDownloadsbySubgenre S t a t e o f M o b i l e 2 0 2 5 C o p y r i g h t © S e n s o r T o w e r 22
23.
Source: Sensor Tower Note:
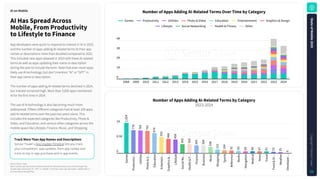
Includes apps with at least 50,000 worldwide all-time downloads across iOS and Google Play. Includes apps mentioning "AI", "GPT", or "OpenAI" in their app name, app description, subtitle (iOS), or short description (Google Play). NumberofAppsAddingAI-RelatedTermsOverTimebyCategory TrackMoreThanAppNamesandDescriptions Sensor Tower's App Update Timeline lets you track your competitors' app updates, from app names and icons to top in-app purchase and in-app events. AIHasSpreadAcross Mobile,FromProductivity toLifestyletoFinance AIonMobile NumberofAppsAddingAI-RelatedTermsbyCategory 2023-2024 4K 3K 2K 1K 0 2008 2009 2010 2011 2012 2013 2014 2015 2016 2017 2018 2019 2020 2021 2022 2023 2024 Games Productivity Utilities Photo & Video Education Entertainment Graphics & Design Lifestyle Social Networking Health & Fitness Other 1K 0.5K 0 G a m e s P r o d u c t i v i … U t i l i t i e s P h o t o & V … E d u c a t i o n E n t e r t a i n … G r a p h i c s & … L i f e s t y l e S o c i a l N e … H e a l t h & F … F i n a n c e B u s i n e s s M u s i c S h o p p i n g S p o r t s R e f e r e n c e B o o k s N a v i g a t i o n M e d i c a l N e w s T r a v e l F o o d & D r … W e a t h e r D e v e l o p e r … 1 , 0 2 4 7 7 8 7 6 3 7 5 2 6 7 4 5 4 3 4 8 4 4 5 9 3 0 3 3 0 2 2 6 5 2 6 4 2 0 8 1 2 2 1 0 4 9 2 8 3 6 9 6 8 6 7 6 1 5 3 3 5 6 App developers were quick to respond to interest in AI in 2023, and the number of apps adding AI-related terms to their app names or descriptions more than doubled compared to 2022. This included new apps released in 2023 with these AI-related terms as well as apps updating their name or description during the year to include the term. Note that even more apps likely use AI technology, but don't mention "AI" or "GPT" in their app name or description. The number of apps adding AI-related terms declined in 2024, but interest remained high. More than 3,000 apps mentioned AI for the first time in 2024. The use of AI technology is also becoming much more widespread. Fifteen different categories had at least 100 apps add AI-related terms over the past two years alone. This includes the expected categories like Productivity, Photo & Video, and Education, and various other categories across the mobile space like Lifestyle, Finance, Music, and Shopping. S t a t e o f M o b i l e 2 0 2 5 C o p y r i g h t © S e n s o r T o w e r 23
24.
Source: Sensor Tower Note:
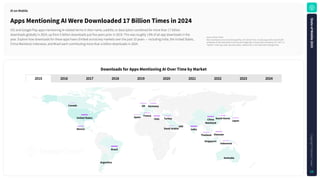
Downloads across iOS and Google Play. iOS only for China. Includes apps with at least 50,000 worldwide all-time downloads across iOS and Google Play. Includes apps mentioning "AI", "GPT", or "OpenAI" in their app name, app description, subtitle (iOS), or short description (Google Play). DownloadsforAppsMentioningAIOverTimebyMarket AppsMentioningAIWereDownloaded17BillionTimesin2024 iOS and Google Play apps mentioning AI-related terms in their name, subtitle, or description combined for more than 17 billion downloads globally in 2024, up from 5 billion downloads just five years prior in 2019. This was roughly 13% of all app downloads in the year. Explore how downloads for these apps have climbed across key markets over the past 10 years — including India, the United States, China Mainland, Indonesia, and Brazil each contributing more than a billion downloads in 2024. AIonMobile 2015 2016 2017 2018 2019 2020 2021 2022 2023 2024 India Brazil Mexico Canada Argentina Italy France Spain UAE SaudiArabia Australia Singapore UnitedStates Germany UK Turkey Indonesia Thailand Vietnam China Mainland Japan SouthKorea S t a t e o f M o b i l e 2 0 2 5 C o p y r i g h t © S e n s o r T o w e r 24
25.
Source: Sensor Tower Note:
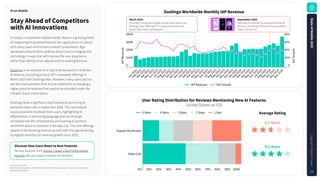
iOS and Google Play combined. iOS only for China. Revenue is gross — inclusive of any percent taken by the app stores. DuolingoWorldwideMonthlyIAPRevenue StayAheadofCompetitors withAIInnovations AIonMobile UserRatingDistributionforReviewsMentioningNewAIFeatures United States on iOS Explain My Answer Video Call 0% 10% 20% 30% 40% 50% 60% 70% 80% 90% 100% 5 Stars 4 Stars 3 Stars 2 Stars 1 Star In today's competitive mobile market, there is a growing trend of integrating AI-powered features into applications to attract tech-savvy users and enhance overall convenience. App developers should think carefully about how to integrate the technology in ways that will improve the user experience, rather than selling minor adjustments to existing features. Duolingo is an example of an app that was quick to embrace AI features, launching several GPT-4 powered offerings in March 2023 with Duolingo Max. However, many users did not see the improvements from AI and viewed this as charging a higher price for features that used to be provided under the cheaper Super subscription. Duolingo took a significant step forward by launching AI- powered video calls in September 2024. This new feature received positive feedback from users, highlighting its effectiveness in enhancing language practice through simulated real-life conversations and leaning on positive sentiment about a character in the app, Lily. The new offerings appear to be boosting revenue as well, with the app achieving its highest monthly YoY revenue growth since 2023. September2024: Duolingo introduced AI-powered features at Duocon, including AI-Powered Conversations: Video Call with Lily 0 $20M $40M $60M $80M 0 20% 40% 60% 80% J a n - 2 0 2 2 F e b - 2 0 2 2 M a r - 2 0 2 2 A p r - 2 0 2 2 M a y - 2 0 2 2 J u n - 2 0 2 2 J u l - 2 0 2 2 A u g - 2 0 2 2 S e p - 2 0 2 2 O c t - 2 0 2 2 N o v - 2 0 2 2 D e c - 2 0 2 2 J a n - 2 0 2 3 F e b - 2 0 2 3 M a r - 2 0 2 3 A p r - 2 0 2 3 M a y - 2 0 2 3 J u n - 2 0 2 3 J u l - 2 0 2 3 A u g - 2 0 2 3 S e p - 2 0 2 3 O c t - 2 0 2 3 N o v - 2 0 2 3 D e c - 2 0 2 3 J a n - 2 0 2 4 F e b - 2 0 2 4 M a r - 2 0 2 4 A p r - 2 0 2 4 M a y - 2 0 2 4 J u n - 2 0 2 4 J u l - 2 0 2 4 A u g - 2 0 2 4 S e p - 2 0 2 4 O c t - 2 0 2 4 N o v - 2 0 2 4 D e c - 2 0 2 4 I A P R e v e n u e Y o Y G r o w t h IAP Revenue YoY Growth March2023: Duolingo introduced a higher-priced subscription tier, Duolingo Max, offering GPT-4 powered features like Explain My Answer and Roleplay DiscoverHowUsersReacttoNewFeatures Review Analysis from Sensor Tower's App Performance Insights lets you search reviews by keyword AverageRating 2.7Stars 4.1Stars S t a t e o f M o b i l e 2 0 2 5 C o p y r i g h t © S e n s o r T o w e r 25
26.
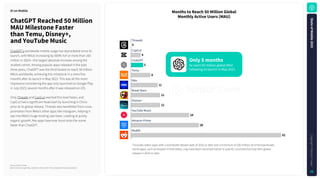
Source: Sensor Tower Note:
iOS and Google Play combined. iOS only for China. Excludes third-party Android. MonthstoReach50MillionGlobal MonthlyActiveUsers(MAU) AIonMobile ChatGPTReached50Million MAUMilestoneFaster thanTemu,Disney+, andYouTubeMusic ChatGPT's worldwide mobile usage has skyrocketed since its launch, with MAUs increasing by 500% YoY or more than 160 million in 3Q24—the largest absolute increase among the studied cohort. Among popular apps released in the past three years, ChatGPT was the third-fastest to reach 50 million MAUs worldwide, achieving this milestone in a mere five months after its launch in May 2023. This was all the more impressive considering the app only launched on Google Play in July 2023, several months after it was released on iOS. Only Threads and CapCut reached this level faster, and CapCut had a significant head start by launching in China prior to its global release. Threads also benefitted from cross- promotion from Meta's other apps like Instagram, helping it tap into Meta's huge existing user base. Looking at purely organic growth, few apps have ever burst onto the scene faster than ChatGPT. Threads CapCut ChatGPT Temu Max Brawl Stars Disney+ YouTube Music Amazon Prime Reddit 0 4 5 8 11 12 12 24 28 62 *Includes select apps with a worldwide release date of 2016 or later and a minimum of 100 million all-time downloads. Some apps, such as Amazon Prime Video, may have been launched earlier in specific countries but had their global release in 2016 or later. S t a t e o f M o b i l e 2 0 2 5 C o p y r i g h t © S e n s o r T o w e r 26 to reach 50 million global MAU following its launch in May 2023 Only5months
27.
Source: Sensor Tower Note:
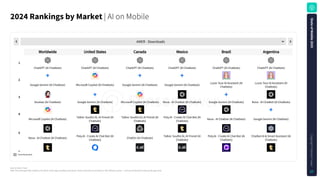
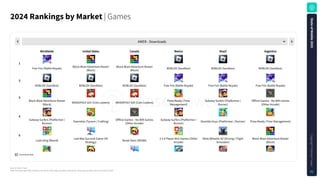
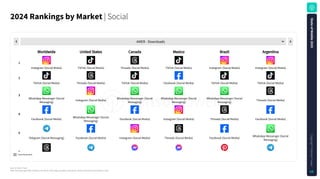
iOS and Google Play combined. iOS only for China. Apps classified using Sensor Tower's taxonomy as of January 5, 2025. Revenue is gross — inclusive of any percent taken by the app stores. 2024RankingsbyMarket| AI on Mobile Download data AMER - Downloads ChatGPT (AI Chatbots) ChatGPT (AI Chatbots) ChatGPT (AI Chatbots) ChatGPT (AI Chatbots) ChatGPT (AI Chatbots) ChatGPT (AI Chatbots) Google Gemini (AI Chatbots) Microsoft Copilot (AI Chatbots) Google Gemini (AI Chatbots) Google Gemini (AI Chatbots) Luzia: Your AI Assistant (AI Chatbots) Luzia: Your AI Assistant (AI Chatbots) Doubao (AI Chatbots) Google Gemini (AI Chatbots) Microsoft Copilot (AI Chatbots) Nova - AI Chatbot (AI Chatbots) Google Gemini (AI Chatbots) Nova - AI Chatbot (AI Chatbots) Microsoft Copilot (AI Chatbots) Talkie: Soulful AI, AI Friend (AI Chatbots) Talkie: Soulful AI, AI Friend (AI Chatbots) Poly.AI - Create AI Chat Bot (AI Chatbots) Nova - AI Chatbot (AI Chatbots) Google Gemini (AI Chatbots) Nova - AI Chatbot (AI Chatbots) Poly.AI - Create AI Chat Bot (AI Chatbots) ChatOn (AI Chatbots) Talkie: Soulful AI, AI Friend (AI Chatbots) Poly.AI - Create AI Chat Bot (AI Chatbots) Chatbot AI & Smart Assistant (AI Chatbots) 1 2 3 4 5 6 Worldwide United States Canada Mexico Brazil Argentina S t a t e o f M o b i l e 2 0 2 5 C o p y r i g h t © S e n s o r T o w e r 27
28.
03 S t a t e o f M o b i l e 2 0 2 5 C o p y r i g h t © S e n s o r T o w e r 28 Gaming Mobile gaming bounced
back with positive year-over-year IAP revenue growth for the first time since 2021. However, the landscape has changed over the past few years, with Strategy and Puzzle driving growth while RPG continued to decline. Data is paramount to everything we do internally at Kwalee, and at gaming companies in general, the sheer amount of data points we capture is mind-boggling. Sensor Tower adds the external dimension which gives us the comparable we need to understand if what we're doing is working? Has a market fit? And equally important, is potential trends for us to innovate on. JohnWright VP of Mobile Games Kwalee
29.
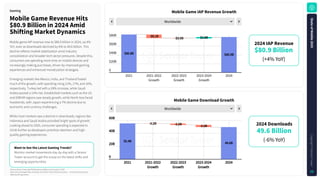
MobileGameIAPRevenueGrowth WanttoSeetheLatestGamingTrends? Monitor market movements
day-by-day with a Sensor Tower account to get the scoop on the latest shifts and emerging opportunities. MobileGameRevenueHits $80.9Billionin2024Amid ShiftingMarketDynamics Mobile game IAP revenue rose to $80.9 billion in 2024, up 4% YoY, even as downloads declined by 6% to 49.6 billion. This decline reflects market stabilization amid industry consolidation and broader tech sector pressures. Despite this, consumers are spending more time on mobile devices and increasingly making purchases, driven by improved gaming experiences and enhanced monetization strategies. Emerging markets like Mexico, India, and Thailand fueled much of the growth, with spending rising 21%, 17%, and 16%, respectively. Turkey led with a 28% increase, while Saudi Arabia posted a 14% rise. Established markets such as the US and EMEAR regions saw steady growth, while North Asia faced headwinds, with Japan experiencing a 7% decline due to economic and currency challenges. While most markets saw a decline in downloads, regions like Indonesia and Saudi Arabia provided bright spots of growth. Looking ahead to 2025, consumer spending is expected to climb further as developers prioritize retention and high- quality gaming experiences. Gaming MobileGameDownloadGrowth Worldwide $80B $60B $40B $20B 0 2021 2021-2022 Growth 2022-2023 Growth 2023-2024 Growth 2024 $86.8B -$8.1B -$0.5B $2.8B $80.9B Worldwide 60B 40B 20B 0 2021 2021-2022 Growth 2022-2023 Growth 2023-2024 Growth 2024 55.4B -0.2B -2.2B -3.3B 49.6B (+4% YoY) $80.9Billion 2024IAPRevenue (-6% YoY) 49.6Billion 2024Downloads Source: Sensor Tower App Performance Insights as of January 5, 2025. Note: iOS and Google Play combined. iOS only for China. Revenue is gross — inclusive of any percent taken by the app stores. S t a t e o f M o b i l e 2 0 2 5 C o p y r i g h t © S e n s o r T o w e r 29
30.
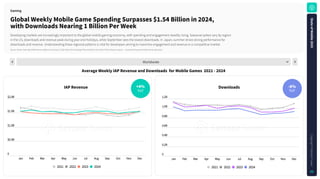
Worldwide 2020 - Dec
1.12 2021 - Jan 1.65 2021 - Feb 1.74 2021 - Mar 1.68 2021 - Apr 1.67 2021 - May 1.63 2021 - Jun 1.62 2021 - Jul 1.64 2021 - Aug 1.72 2021 - Sep 1.63 2021 - Oct 1.56 2021 - Nov 1.63 2021 - Dec 1.7 2022 - Jan 1.69 2022 - Feb 1.63 Week IAP Revenue Downloads Source: Sensor Tower App Performance Insights as of January 5, 2025. Note: iOS and Google Play combined. iOS only for China. Revenue is gross — inclusive of any percent taken by the app stores. GlobalWeeklyMobileGameSpendingSurpasses$1.54Billionin2024, withDownloadsNearing1BillionPerWeek Developing markets are increasingly important to the global mobile gaming economy, with spending and engagement steadily rising. Seasonal spikes vary by region: in the US, downloads and revenue peak during year-end holidays, while September sees the lowest downloads. In Japan, summer drives strong performance for downloads and revenue. Understanding these regional patterns is vital for developers aiming to maximize engagement and revenue in a competitive market. Gaming IAPRevenue AverageWeeklyIAPRevenueandDownloads forMobileGames 2021-2024 -6% +4% YoY YoY 0 $0.5B $1.0B $1.5B $2.0B Jan Feb Mar Apr May Jun Jul Aug Sep Oct Nov Dec 2021 2022 2023 2024 0 0.2B 0.4B 0.6B 0.8B 1.0B 1.2B Jan Feb Mar Apr May Jun Jul Aug Sep Oct Nov Dec 2021 2022 2023 2024 S t a t e o f M o b i l e 2 0 2 5 C o p y r i g h t © S e n s o r T o w e r 30
31.
Source: Sensor Tower.
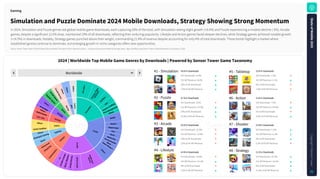
Note: iOS and Google Play combined. iOS only for China. Revenue is gross — inclusive of any percent taken by the app stores. Apps classified using Sensor Tower's Game taxonomy as of January 5, 2025. SimulationandPuzzleDominate2024MobileDownloads,StrategyShowingStrongMomentum In 2024, Simulation and Puzzle genres led global mobile game downloads, each capturing 20% of the total, with Simulation seeing slight growth (+0.4%) and Puzzle experiencing a modest decline (-3%). Arcade games, despite a significant 12.5% drop, maintained 19% of all downloads, reflecting their enduring popularity. Lifestyle and Action genres faced steeper declines, while Strategy games achieved notable growth (+14.5%) in downloads. Notably, Strategy games punched above their weight, commanding 21.4% of revenue despite accounting for only 4% of total downloads. These trends highlight a market where established genres continue to dominate, but emerging growth in niche categories offers new opportunities. Gaming 2024|WorldwideTopMobileGameGenresbyDownloads|PoweredbySensorTowerGameTaxonomy Worldwide S i m u l a t i o n Puzzle A r c a d e Lifestyle Tabletop Action Shooter Strategy S p o r t s R a c i n g R P G C a s i n o S i m u l a t o r D r i v i n g / F l i g h t S i m u l a t o r S a n d b o x Idler Tycoon/Crafting TimeManagement Others Riddle Physics Match Swap Sort Word MatchPair Environmental Block MatchMerge2 Others P l a t f o r m e r / R u n n e r O t h e r A r c a d e A r c a d e D r i v i n g M u s i c / R h y t h m A r c a d e C o m b a t . i o C u s t o m i z a t i o n VirtualPet Ultracasual Board Drawing&Coloring Others Action Sandbox Others FPS/3PS BattleRoyale Others 4XStrategy Others R e a l i s t i c S p o r t s A r c a d e S p o r t s A r c a d e R a c i n g O t h e r s O t h e r s O t h e r s #6 - Action #7 - Shooter #8 - Strategy #5 - Tabletop #2 - Puzzle #3 - Arcade #4 - Lifestyle #1 - Simulation YoY Downloads -7.3% YoY IAP Revenue +1.1% 5% of All Downloads 1.8% of All IAP Revenue 2.4 B in Downloads YoY Downloads -7.9% YoY IAP Revenue +46.0% 5% of All Downloads 4.4% of All IAP Revenue 2.4 B in Downloads YoY Downloads +1.5% YoY IAP Revenue +3.4% 5% of All Downloads 5.3% of All IAP Revenue 2.1 B in Downloads YoY Downloads +14.5% YoY IAP Revenue +16.2% 4% of All Downloads 21.4% of All IAP Revenue 2.6 B in Downloads YoY Downloads +0.4% YoY IAP Revenue +8.8% 20% of All Downloads 7.4% of All IAP Revenue 9.7 B in Downloads YoY Downloads -3.0% YoY IAP Revenue +14.0% 20% of All Downloads 14.9% of All IAP Revenue 9.6 B in Downloads YoY Downloads -12.5% YoY IAP Revenue -22.6% 19% of All Downloads 2.0% of All IAP Revenue 4.0 B in Downloads YoY Downloads -10.0% YoY IAP Revenue +51.4% 8% of All Downloads 2.5% of All IAP Revenue 9.8 B in Downloads S t a t e o f M o b i l e 2 0 2 5 C o p y r i g h t © S e n s o r T o w e r 31
32.
Source: Sensor Tower Note:
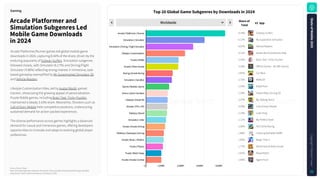
iOS and Google Play combined. iOS only for China. Excludes third-party Android. Apps classified using Sensor Tower's Game taxonomy as of January 5, 2025. Top20GlobalGameSubgenresbyDownloadsin2024 ArcadePlatformerand SimulationSubgenresLed MobileGameDownloads in2024 Arcade Platformer/Runner games led global mobile game downloads in 2024, capturing 8.34% of the share, driven by the enduring popularity of Subway Surfers. Simulation subgenres followed closely, with Simulator (6.17%) and Driving/Flight Simulator (4.98%) reflecting strong interest in immersive, task- based gameplay exemplified by My Supermarket Simulator 3D and Vehicle Masters. Lifestyle Customization titles, led by Avatar World, gained traction, showcasing the growing appeal of personalization. Puzzle Riddle games, including Brain Test: Tricky Puzzles, maintained a steady 3.43% share. Meanwhile, Shooters such as Call of Duty: Mobile held competitive positions, underscoring sustained demand for action-packed experiences. The diverse performance across genres highlights a balanced demand for casual and immersive games, offering developers opportunities to innovate and adapt to evolving global player preferences. Gaming Worldwide Arcade | Platformer / Runner Simulation | Simulator Simulation | Driving / Flight Simulator Lifestyle | Customization Puzzle | Riddle Arcade | Other Arcade Racing | Arcade Racing Simulation | Sandbox Sports | Realistic Sports Action | Action Sandbox Lifestyle | Virtual Pet Shooter | FPS / 3PS Tabletop | Board Simulation | Idler Arcade | Arcade Driving Tabletop | Drawing & Coloring Arcade | Music / Rhythm Puzzle | Physics Puzzle | Match Swap Arcade | Arcade Combat 0 1,000M 2,000M 3,000M 4,000M 8.34% Subway Surfers 6.17% My Superstore Simulator 4.97% Vehicle Masters 4.11% Avatar World Games for Kids 3.43% Brain Test: Tricky Puzzles 3.39% Offline Games - No Wifi Games 2.81% Car Race 2.72% ROBLOX 2.43% 8 Ball Pool 2.29% Indian Bikes Driving 3D 2.27% My Talking Tom 2 2.25% Call of Duty: Mobile 2.19% Ludo King 2.11% My Perfect Hotel 2.00% Hill Climb Racing 1.88% Coloring Alphabet ASMR 1.85% Magic Tiles 3 1.77% Wood Nuts & Bolts Puzzle 1.61% Royal Match 1.60% Agent Hunt Shareof Total #1 App S t a t e o f M o b i l e 2 0 2 5 C o p y r i g h t © S e n s o r T o w e r 32
33.
Source: Sensor Tower
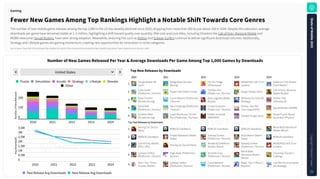
Note: iOS and Google Play combined. iOS only for China. Excludes third-party Android. Apps classified using Sensor Tower's taxonomy as of January 5, 2025. FewerNewGamesAmongTopRankingsHighlightaNotableShiftTowardsCoreGenres The number of new mobile game releases among the top 1,000 in the US has steadily declined since 2020, dropping from more than 200 to just above 100 in 2024. Despite this reduction, average downloads per game have remained stable at 1–2 million, highlighting a shift toward quality over quantity. Mid-core and core titles, including Shooters like Call of Duty: Warzone Mobile and MOBA newcomer Squad Busters, have seen strong adoption. Meanwhile, enduring hits such as Roblox and Subway Surfers continue to deliver significant download volumes. Additionally, Strategy and Lifestyle games are gaining momentum, creating new opportunities for innovation in niche categories. Gaming NumberofNewGamesReleasedPerYear&AverageDownloadsPerGameAmongTop1,000GamesbyDownloads TopNewReleasesbyDownloads United States 200 100 0 2020 2021 2022 2023 2024 N u m b e r o f N e w R e l e a s e s Puzzle Simulation Arcade Strategy Lifestyle Shooter Other 0 0.5M 1M 1.5M 2M 2.5M 3M 3.5M 2020 2021 2022 2023 2024 A v g D o w n l o a d s Past Release Avg Downloads New Release Avg Downloads 1 Tangle Master 3D (Sort) Bridge Race (Arcade Racing) Fill The Fridge (Ultracasual) MONOPOLY GO! (Coin Looters) Pokémon TCG Pocket (Card Battler) 2 Cube Surfer (Platformer / Runner) Paper Fold (Other Puzzle) Tall Man Run (Platformer / Runner) Burger Please (Idler) Call of Duty: Warzone (Battle Royale) 3 Draw Climber (Arcade Racing) Count Masters (Platformer / Runner) Apex Legends (Battle Royale) Whiteout Survival (4X Strategy) Perfect Tidy (Ultracasual) 4 Spiral Roll (Platformer / Runner) Hair Challenge (Platformer / Runner) Crowd Evolution (Platformer / Runner) Honkai: Star Rail (Turn-based RPG) Squad Busters (MOBA) 5 Scribble Rider (Arcade Racing) Crash Bandicoot: On the Run (Platformer / Runner) Diablo Immortal (MMORPG) Twisted Tangle (Sort) Screw Puzzle: Wood Nut & Bolt (Physics) Top Past Releases by Downloads 1 Among Us! (Social Party) ROBLOX (Sandbox) ROBLOX (Sandbox) ROBLOX (Sandbox) Block Blast Adventure Master (Block) 2 ROBLOX (Sandbox) Project Makeover (Match Swap) Subway Surfers (Platformer / Runner) Royal Match (Match Swap) ROBLOX (Sandbox) 3 Call of Duty: Mobile (FPS / 3PS) Among Us! (Social Party) Wordle by Goldfinch Studios (Word) Subway Surfers (Platformer / Runner) MONOPOLY GO! (Coin Looters) 4 Subway Surfers (Platformer / Runner) High Heels (Platformer / Runner) Stumble Guys (Platformer / Runner) Block Blast Adventure Master (Block) Township (Tycoon / Crafting) 5 Brain Test: Tricky Puzzles (Riddle) Subway Surfers (Platformer / Runner) Count Masters (Platformer / Runner) Magic Tiles 3 (Music / Rhythm) Last War:Survival Game (4X Strategy) 2020 2021 2022 2023 2024 S t a t e o f M o b i l e 2 0 2 5 C o p y r i g h t © S e n s o r T o w e r 33
34.
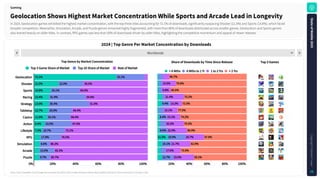
Worldwide 1 Rank Source: Sensor TowerNote:
iOS and Google Play combined. iOS only for China. Excludes third-party Android. Apps classified using Sensor Tower's taxonomy as of January 5, 2025. GeolocationShowsHighestMarketConcentrationWhileSportsandArcadeLeadinLongevity Gaming 2024|TopGenrePerMarketConcentrationbyDownloads Geolocation Shooter Sports Racing Strategy Tabletop Casino Action Lifestyle RPG Simulation Arcade Puzzle 0% 20% 40% 60% 80% 100% 72.1% 72.1% 72.1% 25.1% 25.1% 25.1% 21.5% 21.5% 21.5% 22.0% 22.0% 22.0% 56.5% 56.5% 56.5% 14.8% 14.8% 14.8% 25.1% 25.1% 25.1% 60.0% 60.0% 60.0% 13.4% 13.4% 13.4% 31.9% 31.9% 31.9% 54.8% 54.8% 54.8% 13.0% 13.0% 13.0% 35.4% 35.4% 35.4% 51.6% 51.6% 51.6% 12.7% 12.7% 12.7% 20.9% 20.9% 20.9% 66.4% 66.4% 66.4% 11.5% 11.5% 11.5% 20.1% 20.1% 20.1% 68.4% 68.4% 68.4% 9.4% 9.4% 9.4% 23.5% 23.5% 23.5% 67.0% 67.0% 67.0% 7.3% 7.3% 7.3% 19.7% 19.7% 19.7% 73.1% 73.1% 73.1% 17.9% 17.9% 17.9% 76.5% 76.5% 76.5% 8.6% 8.6% 8.6% 86.2% 86.2% 86.2% 13.0% 13.0% 13.0% 82.3% 82.3% 82.3% 9.7% 9.7% 9.7% 85.7% 85.7% 85.7% Top 3 Game Share of Market Top 20 Share of Market Rest of Market Top3Games 20% 40% 60% 80% 100% 86.7% 15.0% 79.6% 9.8% 85.0% 21.4% 70.2% 9.4% 13.2% 72.5% 15.1% 77.5% 8.4% 15.1% 74.2% 20.2% 70.5% 8.6% 22.0% 66.9% 11.5% 19.9% 20.7% 47.9% 10.1% 21.7% 62.9% 17.0% 73.9% 12.7% 23.0% 59.2% < 6 Mths 6 Mths to 1 Yr 1 to 2 Yrs > 2 Yrs ShareofDownloadsbyTimeSinceRelease TopGenrebyMarketConcentration In 2024, Geolocation games exhibited the highest market concentration, with the top three titles accounting for 72.1% of downloads, significantly outpacing Shooter (21.5%) and Sports (14.8%), which faced broader competition. Meanwhile, Simulation, Arcade, and Puzzle genres remained highly fragmented, with more than 80% of downloads distributed across smaller games. Geolocation and Sports genres also leaned heavily on older titles. In contrast, RPG games saw less than 50% of downloads driven by older titles, highlighting the competitive momentum and appeal of newer releases. S t a t e o f M o b i l e 2 0 2 5 C o p y r i g h t © S e n s o r T o w e r 34
35.
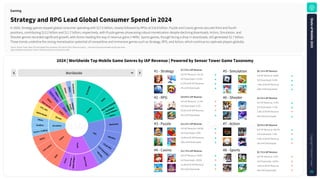
Gaming 2024|WorldwideTopMobileGameGenresbyIAPRevenue|PoweredbySensorTowerGameTaxonomy Worldwide S t r a t e g y RPG P u z z l e Casino Simulation Shooter Action S p o r t s L i f e s t y l e A r c a d e T a b l e t o p 4 X S t r a t e g y MOBA Real-TimeStrategy CardBattler TowerDefense Others Squad RPG MMORPG PuzzleRPG Turn-basedRPG I d l e R P G M a t c h S w a p M a t c h M e r g e 2 M a t c h P a i r O t h e r s S l o t s CoinLooters Others Tycoon /
Crafting Sandbox Others BattleRoyale FPS/3PS Beat'emUp Others R e a l i s t i c S p o r t s O t h e r s I n t e r a c t i v e S t o r y O t h e r s O t h e r s G e o l o c a t i o n StrategyandRPGLeadGlobalConsumerSpendin2024 In 2024, Strategy games topped global consumer spending with $17.5 billion, closely followed by RPGs at $16.8 billion. Puzzle and Casino genres secured third and fourth positions, contributing $12.2 billion and $11.7 billion, respectively, with Puzzle games showcasing robust monetization despite declining downloads. Action, Simulation, and Shooter genres recorded significant growth, with Action leading the way in revenue gains (+46%). Sports games, though facing a drop in downloads, still generated $2.7 billion. These trends underline the strong monetization potential of competitive and immersive genres such as Strategy, RPG, and Action, which continue to captivate players globally. #2 - RPG #3 - Puzzle #4 - Casino #1 - Strategy #6 - Shooter #7 - Action #8 - Sports #5 - Simulation YoY IAP Revenue +16.2% YoY Downloads +14.5% 21.4% of All IAP Revenue 4% of All Downloads $16.8 B in IAP Revenue YoY IAP Revenue -17.3% YoY Downloads -6.1% 20.5% of All IAP Revenue 3% of All Downloads $12.2 B in IAP Revenue YoY IAP Revenue +14.0% YoY Downloads -3.0% 14.9% of All IAP Revenue 20% of All Downloads $11.7 B in IAP Revenue YoY IAP Revenue +8.9% YoY Downloads -39.6% 14.3% of All IAP Revenue 2% of All Downloads $17.5 B in IAP Revenue YoY IAP Revenue +8.8% YoY Downloads +0.4% 7.4% of All IAP Revenue 20% of All Downloads $4.3 B in IAP Revenue YoY IAP Revenue +3.4% YoY Downloads +1.5% 5.3% of All IAP Revenue 5% of All Downloads $3.6 B in IAP Revenue YoY IAP Revenue +46.0% YoY Downloads -7.9% 4.4% of All IAP Revenue 5% of All Downloads $2.7 B in IAP Revenue YoY IAP Revenue -6.3% YoY Downloads -10.6% 3.4% of All IAP Revenue 4% of All Downloads $6.1 B in IAP Revenue Source: Sensor Tower. Note: iOS and Google Play combined. iOS only for China. Revenue is gross — inclusive of any percent taken by the app stores. Apps classified using Sensor Tower's Game taxonomy as of January 5, 2025. S t a t e o f M o b i l e 2 0 2 5 C o p y r i g h t © S e n s o r T o w e r 35
36.
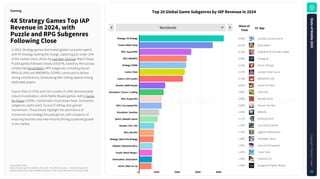
Source: Sensor Tower. Note:
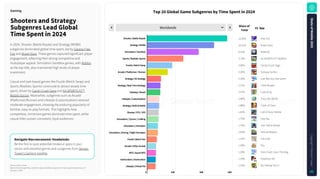
iOS and Google Play combined. iOS only for China. Revenue is gross — inclusive of any percent taken by the app stores. Apps classified using Sensor Tower's Game taxonomy as of January 5, 2025. Top20GlobalGameSubgenresbyIAPRevenuein2024 4XStrategyGamesTopIAP Revenuein2024,with PuzzleandRPGSubgenres FollowingClose In 2024, Strategy games dominated global consumer spend, with 4X Strategy leading the charge, capturing just under 10% of the market share, driven by Last War: Survival. Match Swap Puzzle games followed closely at 8.67%, fueled by the success of titles like Royal Match. RPG subgenres, including Squad RPGs (6.14%) and MMORPGs (5.59%), continued to deliver strong contributions, showcasing their lasting appeal among dedicated players. Casino Slots (5.37%) and Coin Looters (5.14%) demonstrated robust monetization, while Battle Royale games, led by Game for Peace (3.05%), maintained a loyal player base. Simulation subgenres, particularly Tycoon/Crafting, also gained momentum. These trends highlight the dominance of immersive and strategy-focused genres, with a balance of enduring favorites and new entrants driving sustained growth in the market. Gaming Worldwide Strategy | 4X Strategy Puzzle | Match Swap RPG | Squad RPG RPG | MMORPG Strategy | MOBA Casino | Slots Casino | Coin Looters Shooter | Battle Royale Simulation | Tycoon / Crafting RPG | Puzzle RPG RPG | Turn-based RPG Simulation | Sandbox Sports | Realistic Sports Shooter | FPS / 3PS RPG | Idle RPG Strategy | Real-Time Strategy Lifestyle | Interactive Story Puzzle | Match Merge 2 Geolocation | Geolocation Action | Beat 'em Up 0 $2KM $4KM $6KM $8KM 9.98% Last War:Survival Game 8.67% Royal Match 6.14% GODDESS OF VICTORY: NIKKE 5.59% Lineage M 5.52% Honor of Kings 5.37% Jackpot Party Casino 5.14% MONOPOLY GO! 3.05% Game For Peace 2.86% Township 2.66% Monster Strike 2.62% Honkai: Star Rail 2.34% ROBLOX 2.17% eFootball 2024 1.76% Call of Duty: Mobile 1.72% Legend of Mushroom 1.68% Teamfight Tactics 1.55% Love and Deepspace 1.50% Travel Town 1.48% Pokémon GO 1.44% Dungeon & Fighter Mobile Shareof Total #1 App S t a t e o f M o b i l e 2 0 2 5 C o p y r i g h t © S e n s o r T o w e r 36
37.
Source: Sensor Tower.
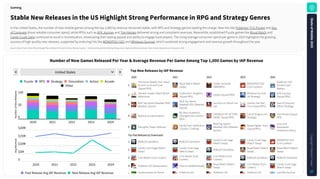
Note: iOS and Google Play combined. iOS only for China. Revenue is gross — inclusive of any percent taken by the app stores. Apps classified using Sensor Tower's Game taxonomy as of January 5, 2025. StableNewReleasesintheUSHighlightStrongPerformanceinRPGandStrategyGenres In the United States, the number of new mobile games among the top 1,000 by revenue remained stable, with RPG and Strategy genres leading the charge. New hits like Pokémon TCG Pocket and Sea of Conquest drove notable consumer spend, while RPGs such as AFK Journey and Top Heroes delivered strong and consistent revenues. Meanwhile, established Puzzle games like Royal Match and Candy Crush Saga continued to excel in monetization, showcasing their lasting appeal and ability to engage loyal players. The rising average consumer spend per game in 2023 highlights the growing success of high-quality new releases, supported by enduring hits like MONOPOLY GO! and Whiteout Survival, which sustained strong engagement and revenue growth throughout the year. Gaming NumberofNewGamesReleasedPerYear&AverageRevenuePerGameAmongTop1,000GamesbyIAPRevenue TopNewReleasesbyIAPRevenue United States 100 50 0 2020 2021 2022 2023 2024 N u m b e r o f N e w R e l e a s e s Puzzle RPG Strategy Simulation Action Arcade Other 0 $5M $10M $15M $20M 2020 2021 2022 2023 2024 A v g R e v e n u e Past Release Avg IAP Revenue New Release Avg IAP Revenue 1 The Seven Deadly Sins: Hikari to Yami no Grand Cross (Squad RPG) Royal Match (Match Swap) Diablo Immortal (MMORPG) MONOPOLY GO! (Coin Looters) Pokémon TCG Pocket (Card Battler) 2 Genshin Impact (Open World Adventure) Cookie Run: Kingdom (Squad RPG) Dislyte (Squad RPG) Whiteout Survival (4X Strategy) AFK Journey (Squad RPG) 3 MLB Tap Sports Baseball 2020 (Realistic Sports) MLB Tap Sports Baseball 2021 (Realistic Sports) Survivor!.io (Shoot 'em Up) Honkai: Star Rail (Turn-based RPG) Sea of Conquest (Other Strategy) 4 Redecor (Customization) My Hero Academia: Strongest Hero (Action RPG) GODDESS OF VICTORY: NIKKE (Squad RPG) Call of Dragons (4X Strategy) Top Heroes (Squad RPG) 5 Arknights (Tower Defense) Family Farm Adventure (Tycoon / Crafting) MLB Tap Sports Baseball 2022 (Realistic Sports) Street Fighter: Duel (Squad RPG) Love and Deepspace (Interactive Story) Top Past Releases by Downloads 1 ROBLOX (Sandbox) ROBLOX (Sandbox) Candy Crush Saga (Match Swap) Candy Crush Saga (Match Swap) MONOPOLY GO! (Coin Looters) 2 Candy Crush Saga (Match Swap) Candy Crush Saga (Match Swap) ROBLOX (Sandbox) Royal Match (Match Swap) Royal Match (Match Swap) 3 Coin Master (Coin Looters) Coin Master (Coin Looters) Coin Master (Coin Looters) ROBLOX (Sandbox) ROBLOX (Sandbox) 4 Pokémon GO (Geolocation) Free Fire (Battle Royale) Royal Match (Match Swap) Coin Master (Coin Looters) Candy Crush Saga (Match Swap) 5 Gardenscapes by Playrix Pokémon GO Pokémon GO Pokémon GO Last War:Survival 2020 2021 2022 2023 2024 S t a t e o f M o b i l e 2 0 2 5 C o p y r i g h t © S e n s o r T o w e r 37
38.
Worldwide 1 Rank Source: Sensor Tower Note:
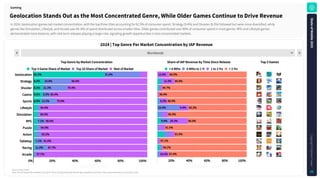
iOS and Google Play combined. iOS only for China. Excludes third-party Android. Apps classified using Sensor Tower's game taxonomy as of January 5, 2025. GeolocationStandsOutastheMostConcentratedGenre,WhileOlderGamesContinuetoDriveRevenue Gaming 2024|TopGenrePerMarketConcentrationbyIAPRevenue Geolocation Strategy Shooter Casino Sports Lifestyle Simulation RPG Puzzle Action Tabletop Racing Arcade 0% 20% 40% 60% 80% 100% 62.5% 31.6% 9.4% 23.8% 66.8% 8.3% 21.3% 70.4% 8.0% 6.5% 85.4% 6.9% 13.2% 79.9% 94.4% 94.5% 7.1% 89.6% 94.0% 93.2% 7.1% 91.6% 11.0% 87.7% 97.7% Top 3 Game Share of Market Top 20 Share of Market Rest of Market Top3Games 20% 40% 60% 80% 100% 12.6% 86.9% 12.3% 80.9% 94.7% 98.4% 8.5% 88.9% 24.4% 9.9% 65.3% 88.3% 9.9% 20.3% 66.0% 91.5% 81.0% 97.1% 94.1% 10.2% 87.4% < 6 Mths 6 Mths to 1 Yr 1 to 2 Yrs > 2 Yrs ShareofIAPRevenuebyTimeSinceRelease TopGenrebyMarketConcentration In 2024, Geolocation games led market concentration, with the top three titles accounting for 62.5% of consumer spend. Strategy (9.4%) and Shooter (8.3%) followed but were more diversified, while genres like Simulation, Lifestyle, and Arcade saw 94–8% of spend distributed across smaller titles. Older games contributed over 80% of consumer spend in most genres. RPG and Lifestyle games demonstrated more balance, with mid-term releases playing a larger role, signaling growth opportunities in less concentrated markets. S t a t e o f M o b i l e 2 0 2 5 C o p y r i g h t © S e n s o r T o w e r 38
39.
Source: Sensor Tower. Note:
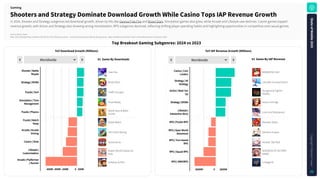
iOS and Google Play combined. iOS only for China. Revenue is gross — inclusive of any percent taken by the app stores. Apps classified using Sensor Tower's Game taxonomy as of January 5, 2025. ShootersandStrategyDominateDownloadGrowthWhileCasinoTopsIAPRevenueGrowth TopBreakoutGamingSubgenres:2024vs2023 Worldwide Shooter | Battle Royale Strategy | MOBA Puzzle | Sort Simulation | Time Management Puzzle | Physics Puzzle | Match Swap Arcade | Arcade Driving Casino | Slots Lifestyle | Customization Arcade | Platformer / Runner -600M -400M -200M 0 200M Free Fire Brawl Stars Traffic Escape! Pizza Ready Wood Nuts & Bolts Puzzle Royal Match Hill Climb Racing Slotomania Avatar World Games for Kids Subway Surfers #1 GameByDownloads YoYDownloadGrowth(Millions) #1 GameByIAPRevenue YoYIAPRevenueGrowth(Millions) Worldwide Casino | Coin Looters Strategy | 4X Strategy Action | Beat 'em Up Strategy | MOBA Lifestyle | Interactive Story RPG | Puzzle RPG RPG | Open World Adventure RPG | Turn-based RPG RPG | Squad RPG RPG | MMORPG -$600M 0 $600M In 2024, Shooter and Strategy subgenres led download growth, driven by hits like Garena Free Fire and Brawl Stars. Simulation games also grew, while Arcade and Lifestyle saw declines. Casino games topped revenue growth, with Action and Strategy also showing strong monetization. RPG subgenres declined, reflecting shifting player spending habits and highlighting opportunities in competitive and casual genres. Gaming MONOPOLY GO! Last War:Survival Game Dungeon & Fighter Mobile Honor of Kings Love and Deepspace Monster Strike Genshin Impact Honkai: Star Rail GODDESS OF VICTORY: NIKKE Lineage M S t a t e o f M o b i l e 2 0 2 5 C o p y r i g h t © S e n s o r T o w e r 39
40.
Source: Sensor Tower Note:
iOS and Google Play combined. Apps classified using Sensor Tower's game taxonomy as of January 5, 2025. Top20GlobalGameSubgenresbyTimeSpentin2024 NavigateMacroeconomicHeadwinds: Be the first to spot potential breakout apps in your sector with detailed genres and subgenres from Sensor Tower's Gaming Insights. ShootersandStrategy SubgenresLeadGlobal TimeSpentin2024 In 2024, Shooter (Battle Royale) and Strategy (MOBA) subgenres dominated global time spent, led by Garena Free Fire and Brawl Stars. These genres captured significant player engagement, reflecting their strong competitive and multiplayer appeal. Simulation Sandbox games, with Roblox as the top title, also maintained high levels of player investment. Casual and task-based genres like Puzzle (Match Swap) and Sports (Realistic Sports) continued to attract steady time spent, driven by Candy Crush Saga and EA SPORTS FC™ Mobile Soccer. Meanwhile, subgenres such as Arcade (Platformer/Runner) and Lifestyle (Customization) retained moderate engagement, showing the enduring popularity of familiar, easy-to-play formats. This highlights how competitive, immersive games dominate time spent, while casual titles sustain consistent, loyal audiences. Gaming Worldwide Shooter | Battle Royale Strategy | MOBA Simulation | Sandbox Sports | Realistic Sports Puzzle | Match Swap Arcade | Platformer / Runner Strategy | 4X Strategy Strategy | Real-Time Strategy Tabletop | Board Lifestyle | Customization Strategy | Build & Battle Shooter | FPS / 3PS Simulation | Tycoon / Crafting Simulation | Simulator Simulation | Driving / Flight Simulator Puzzle | Match Pair Arcade | Other Arcade RPG | Squad RPG Geolocation | Geolocation Lifestyle | Virtual Pet 0 20B 40B 60B 12.69% Free Fire 10.61% Brawl Stars 8.16% ROBLOX 5.73% EA SPORTS FC™ MOBILE 3.96% Candy Crush Saga 3.26% Subway Surfers 2.18% Last War:Survival Game 2.11% Clash Royale 2.07% Ludo King 1.90% Toca Life: World 1.88% Clash of Clans 1.82% Call of Duty: Mobile 1.79% Hay Day 1.70% Hair Tattoo Master 1.69% Vehicle Masters 1.52% Tile Club 1.40% Pou 1.38% Hero Clash: Save The Dog 1.34% Pokémon GO 1.32% My Talking Tom 2 Shareof Total #1 App S t a t e o f M o b i l e 2 0 2 5 C o p y r i g h t © S e n s o r T o w e r 40
41.
Source: Sensor Tower Note:
iOS and Google Play combined. iOS only for China. Apps classified using Sensor Tower's game taxonomy as of January 5, 2025. S t a t e o f M o b i l e 2 0 2 5 C o p y r i g h t © S e n s o r T o w e r 41 2024RankingsbyMarket| Games Download data AMER - Downloads Free Fire (Battle Royale) Block Blast Adventure Master (Block) Block Blast Adventure Master (Block) ROBLOX (Sandbox) ROBLOX (Sandbox) ROBLOX (Sandbox) ROBLOX (Sandbox) ROBLOX (Sandbox) ROBLOX (Sandbox) Free Fire (Battle Royale) Free Fire (Battle Royale) Free Fire (Battle Royale) Block Blast Adventure Master (Block) MONOPOLY GO! (Coin Looters) MONOPOLY GO! (Coin Looters) Pizza Ready (Time Management) Subway Surfers (Platformer / Runner) Offline Games - No Wifi Games (Other Arcade) Subway Surfers (Platformer / Runner) Township (Tycoon / Crafting) Offline Games - No Wifi Games (Other Arcade) Subway Surfers (Platformer / Runner) Stumble Guys (Platformer / Runner) Pizza Ready (Time Management) Ludo King (Board) Last War:Survival Game (4X Strategy) Brawl Stars (MOBA) 2 3 4 Player Mini Games (Other Arcade) Moto Wheelie 3D (Driving / Flight Simulator) Block Blast Adventure Master (Block) 1 2 3 4 5 Worldwide United States Canada Mexico Brazil Argentina
42.
04 S t a t e o f M o b i l e 2 0 2 5 C o p y r i g h t © S e n s o r T o w e r 42 Finance Finance apps bounce
back as global economic conditions improve. Digital Wallet & P2P Payments and Consumer Banking had a strong year, and Cryptocurrency surged again.
43.
Worldwide 1 Rank Source: Sensor Tower Note:
iOS and Google Play combined. iOS only for China..Finance apps classified using Sensor Tower's taxonomy as of January 5, 2025. YearlyTrendsforFinanceApps FindMoreFinanceInsights Want more insights? Download our State of Mobile Finance Apps 2024 report to see the latest in cryptocurrency, advertising, and more. S t a t e o f M o b i l e 2 0 2 5 C o p y r i g h t © S e n s o r T o w e r 43 ConsumersContinuedto FlocktoFinanceAppsasa ConvenientOption Finance Downloads TimeSpent(Hours) YoYGrowth YoYGrowth 8B 7B 6B 5B 4B 3B 2B 1B 0 2021 2022 2023 2024 20B 16B 12B 8B 4B 0 2021 2022 2023 2024 12% 9% 6% 3% 0 2021 2022 2023 2024 16% 12% 8% 4% 0 2021 2022 2023 2024 Global Finance app downloads exceeded 7 billion in 2024, up 8% YoY. This was an acceleration from the already strong growth in recent years as consumers continue to find mobile alternatives for their finance needs, from banking to payments to crypto. The genre has also maintained double-digit YoY growth for time spent, indicating that consumers are also relying on these apps more than ever before. In the United States, downloads and time spent in Finance apps declined in 2022 as consumers became more comfortable with in-person interactions following the pandemic (though it's worth noting downloads were still well above pre-pandemic levels even if below their pandemic peak). Positive growth returned in 2024, highlighting the potential for mobile options even post-pandemic.
44.
Worldwide 1 Rank Source: Sensor Tower Note:
iOS and Google Play combined. iOS only for China..Finance apps classified using Sensor Tower's taxonomy as of January 5, 2025. FinanceDownloadTrendsbySubgenre PaymentandBankingApps LedtheFinanceGenreWhile CryptocurrencySoared Finance TopAppsbyDownloadsin2024 QuarterlyDownloadsbySubgenre 0 50M 100M 150M 200M 250M 300M 350M 400M 450M 500M 2 0 2 1 Q 1 2 0 2 1 Q 2 2 0 2 1 Q 3 2 0 2 1 Q 4 2 0 2 2 Q 1 2 0 2 2 Q 2 2 0 2 2 Q 3 2 0 2 2 Q 4 2 0 2 3 Q 1 2 0 2 3 Q 2 2 0 2 3 Q 3 2 0 2 3 Q 4 2 0 2 4 Q 1 2 0 2 4 Q 2 2 0 2 4 Q 3 2 0 2 4 Q 4 Consumer Banking Digital Wallets & P2P Payments Lending Cryptocurrency Investing & Financial Management Insurance PhonePe Digital Wallets & P2P Payments Google Pay Digital Wallets & P2P Payments PayPal Digital Wallets & P2P Payments Paytm Digital Wallets & P2P Payments DANA Digital Wallets & P2P Payments Binance Cryptocurrency Nubank Consumer Banking ShopeePay Digital Wallets & P2P Payments Tonkeeper Cryptocurrency Bajaj Finserv Lending 1 2 3 4 5 6 7 8 9 10 App Subgenre The top two Finance subgenres (Digital Wallet & P2P Payments and Consumer Banking) both had a strong year for worldwide downloads, climbing 10% and 3% YoY, respectively. Meanwhile, Cryptocurrency apps saw a resurgence in 2024 with app downloads slightly above the previous peak from 2021. The ceiling for downloads is highest for Digital Wallet & P2P Payment apps, with seven of these apps among the top 10 by global downloads in 2024. And these apps may be incentivized to become even more global — a Sensor Tower analysis revealed that P2P apps specializing in international transfers are outperforming domestic P2P apps in the US. Cryptocurrency apps can also have global appeal, with Binance and Tonkeeper ranking among the top 10. Consumer Banking tends to be more regional. Consumer Banking apps topped the download charts in several markets including Australia, Brazil, and Turkey. S t a t e o f M o b i l e 2 0 2 5 C o p y r i g h t © S e n s o r T o w e r 44
45.
Source: Sensor Tower Note:
iOS and Google Play combined. iOS only for China..Cryptocurrency apps classified using Sensor Tower's taxonomy as of January 5, 2025. Bitcoin price data in this report is from Investing.com. IndexedCryptocurrencyAppSessionsvs. AverageQuarterlyBitcoinPrice FindtheLatestTrendsonOurBlog Feel free to check our blog for regular updates in the Finance app market, such as this detailed look at crypto apps from 2024. CryptocurrencyAppUsage ontheRisein2024 The cryptocurrency market is recovering from the downturn caused by the FTX collapse. As inflation eases and the global economy expands, investor confidence is returning, leading to increased engagement in the cryptocurrency ecosystem. According to Sensor Tower data, the global total session count for cryptocurrency apps increased by 37% YoY in 2024. This upward trend has been consistent, with positive YoY growth in each quarter throughout the year, showing a strong correlation with Bitcoin's price. In 2024, Germany stood out as the fastest-growing market for cryptocurrency app usage, with a 91% YoY growth in total sessions. This was followed by significant increases in Indonesia (54%), Brazil (47%), and France (47%), reflecting a broad global uptick in cryptocurrency engagement. Finance Year-over-YearCryptocurrencyAppSessionsGrowthin2024 Among the Top 10 Markets by Cryptocurrency App Sessions 100% 80% 60% 40% 20% 0 South Korea India Turkey United States Vietnam Indonesia Germany Brazil United Kingdom France 36% 26% 10% 36% 31% 54% 91% 47% 22% 47% -30% 0 30% 60% 90% 0 $25K $50K $75K $100K 2 0 2 1 Q 1 2 0 2 1 Q 2 2 0 2 1 Q 3 2 0 2 1 Q 4 2 0 2 2 Q 1 2 0 2 2 Q 2 2 0 2 2 Q 3 2 0 2 2 Q 4 2 0 2 3 Q 1 2 0 2 3 Q 2 2 0 2 3 Q 3 2 0 2 3 Q 4 2 0 2 4 Q 1 2 0 2 4 Q 2 2 0 2 4 Q 3 2 0 2 4 Q 4 81% 22% 69% 22% 9% -8% -19% -8% -15% -20% -2% 21% 9% 9% 45% r y p t o c u r r e n c y A p p S e s s i o n s G r o w t h v s . 2 0 2 1 Q A v g . B i t c o i n P r i c e ( U S D ) Cryptocurrency App Sessions Growth vs. 2021 Q1 Avg. Bitcoin Price (USD) S t a t e o f M o b i l e 2 0 2 5 C o p y r i g h t © S e n s o r T o w e r 45
46.
Download data AMER -
Downloads PhonePe (Digital Wallets & P2P Payments) Cash App (Digital Wallets & P2P Payments) RBC Mobile (Consumer Banking) BBVA (Consumer Banking) Nubank (Consumer Banking) Mercado Pago (Digital Wallets & P2P Payments) Google Pay (Digital Wallets & P2P Payments) PayPal (Digital Wallets & P2P Payments) PayPal (Digital Wallets & P2P Payments) Mercado Pago (Digital Wallets & P2P Payments) PicPay (Digital Wallets & P2P Payments) Naranja X (Digital Wallets & P2P Payments) PayPal (Digital Wallets & P2P Payments) Venmo (Digital Wallets & P2P Payments) TD (Consumer Banking) Nubank (Consumer Banking) Caixa Tem (Consumer Banking) World App - Worldcoin Wallet (Cryptocurrency) Paytm (Digital Wallets & P2P Payments) Zelle (Digital Wallets & P2P Payments) CIBC Banking (Business Finance & Business Solutions) Banco del Bienestar Movil (Consumer Banking) SerasaConsumidor (Credit Reports & Reporting Services) BNA (Consumer Banking) DANA (Digital Wallets & P2P Payments) Capital One (Consumer Banking) Wealthsimple (Financial Services (General)) Banco Azteca (Consumer Banking) Mercado Pago (Digital Wallets & P2P Payments) MODO (Digital Wallets & P2P Payments) 1 2 3 4 5 Worldwide United States Canada Mexico Brazil Argentina Source: Sensor Tower Note: iOS and Google Play combined. iOS only for China. Apps classified using Sensor Tower's taxonomy as of January 5, 2025. 2024RankingsbyMarket| Finance S t a t e o f M o b i l e 2 0 2 5 C o p y r i g h t © S e n s o r T o w e r 46
47.
05 S t a t e o f M o b i l e 2 0 2 5 C o p y r i g h t © S e n s o r T o w e r 47 Retail Some of the
biggest shopping app markets have become saturated with rising competition from Chinese e- tailers like Temu and SHEIN. As a result, retail apps are going global: top apps look to expand to new regions. After using Sensor Tower to conduct a comprehensive analysis of competitors' promotional content, we developed specialized campaigns tailored to sports seasons, holiday themes, and local styles during Q2 and Q3. This allowed us to successfully plan the back-to-school season, the European Cup, and hot sales in Mexico by aligning with local trends. Throughout this process, our visual and copywriting solutions became more refined and localized than ever before, gaining favor from both Google and Apple platforms. This approach not only secured free exposure during major promotion seasons but also significantly enhanced market visibility. JinLiang User Growth Product Team Leader AliExpress
48.
Worldwide 1 Rank Source: Sensor Tower Note:
iOS and Google Play combined. iOS only for China..Retail apps classified using Sensor Tower's taxonomy as of January 5, 2025. YearlyTrendsforRetailApps ChineseE-tailersBoost RetailGlobally,Though ResultsVarybyMarket Retail Downloads TimeSpent(Hours) YoYGrowth YoYGrowth 7B 6B 5B 4B 3B 2B 1B 0 2021 2022 2023 2024 45B 40B 35B 30B 25B 20B 15B 10B 5B 0 2021 2022 2023 2024 8% 6% 4% 2% 0 2021 2022 2023 2024 8% 6% 4% 2% 0 2021 2022 2023 2024 The retail industry continues to benefit from the digitization of the shopping experience, as having omnichannel offerings (physical, web, and mobile) has become crucial to drive traffic and conversion. Chinese e-tailers have contributed to the boom in downloads and time spent, as both SHEIN and Temu continue to expand into new markets in Europe, Latin America, and Asia (including some of the largest markets like Brazil). While 2024 was a nice year for Retail apps globally, demand slowed in several key markets. In the United States, for example, downloads and time spent declined with consumers displaying a bit more caution with their discretionary spending. A significant portion of this decline can also be explained by a market correction following the huge growth in 2023 driven by apps like Temu — US retail downloads were still up 17% in 2024 vs. 2021, and time spent was up 15% over this same period. S t a t e o f M o b i l e 2 0 2 5 C o p y r i g h t © S e n s o r T o w e r 48
49.
Worldwide 1 Rank Source: Sensor Tower Note:
iOS and Google Play combined. iOS only for China..Retail apps classified using Sensor Tower's taxonomy as of January 5, 2025. RetailDownloadTrendsbySubgenre TemuLeadsaCompetitive ShoppingAppMarket Retail TopAppsbyDownloadsin2024 QuarterlyDownloadsbySubgenre 0 100M 200M 300M 400M 500M 600M 700M 800M 900M 2 0 2 1 Q 1 2 0 2 1 Q 2 2 0 2 1 Q 3 2 0 2 1 Q 4 2 0 2 2 Q 1 2 0 2 2 Q 2 2 0 2 2 Q 3 2 0 2 2 Q 4 2 0 2 3 Q 1 2 0 2 3 Q 2 2 0 2 3 Q 3 2 0 2 3 Q 4 2 0 2 4 Q 1 2 0 2 4 Q 2 2 0 2 4 Q 3 2 0 2 4 Q 4 Shopping (General) Apparel (General) Coupons & Rebates Grocery Stores Buy & Sell Women's Apparel Temu Shopping (General) SHEIN Women's Apparel Meesho Shopping (General) Amazon Shopping Shopping (General) Shopee Shopping (General) Flipkart Shopping (General) Alibaba.com Shopping (General) AliExpress Shopping (General) Shopsy Shopping (General) Mercado Libre Shopping (General) 1 2 3 4 5 6 7 8 9 10 App Subgenre General Shopping apps like Temu and Amazon take the bulk of Retail downloads. Looking closer at the other top subgenres (tip: click the Shopping (General) label at the top of the chart to hide this subgenre), Coupon & Rebate apps are on the rise as shoppers become more cost conscious following a period of high inflation. Grocery Stores are also embracing mobile as a way to boost customer loyalty. Temu led global downloads in 2024, followed by SHEIN and other general marketplaces. Consumers increasingly look for platforms they can shop across sectors — from grocery to apparel — and who offer fulfillment services, such as two-day shipping or same-day delivery. These apps also benefit as consumers usually have them set up with payment options, making the transition from browsing to buying seamless and lessening cart abandonment. Notably, this is a strength of the Chinese e-tailers, whose supply chain advantage allows them to offer free shipping and bargain pricing has resonated globally as consumers grapple with inflation, interest rates, and an uncertain geopolitical environment. S t a t e o f M o b i l e 2 0 2 5 C o p y r i g h t © S e n s o r T o w e r 49
50.
Source: Sensor Tower Note:
iOS and Google Play combined. iOS only for China..Retail apps classified using Sensor Tower's taxonomy as of January 5, 2025. ShareofDownloadsbyPublisherCountryforShoppingApps SensorTowerDataintheNews Look out for Sensor Tower data cited in The Wall Street Journal, TechCrunch, CNBC and more. For example, see coverage on Temu's US performance in Forbes. RetailApps areGoingGlobal The retail app market as a whole is still quite regional, with most of the biggest markets getting a large share of downloads from domestic publishers. China Mainland, Japan, and India are some examples with at least 70% of downloads coming from local-based publishers. Globally, the United States leads the way with top apps like Temu and Amazon (Temu is headquartered in the United States, though its parent company, PDD Holdings, is based in China). Most markets are seeing increasing competitive from foreign retail apps. Domestic-based publishers accounted for their lowest share of downloads in the past four years in most of the included markets, including Brazil, India, and the United States. Retail ShareofDownloadsbyPublisherCountry(TemuandSHEINCountedSeparately) 2 0 2 1 2 0 2 2 2 0 2 3 2 0 2 4 0 10% 20% 30% 40% 50% 60% 70% 80% 90% 100% United States India China Singapore Temu SHEIN Other Worldwide 2 0 2 1 2 0 2 2 2 0 2 3 2 0 2 4 0 10% 20% 30% 40% 50% 60% 70% 80% 90% 100% United States India China Singapore Other S t a t e o f M o b i l e 2 0 2 5 C o p y r i g h t © S e n s o r T o w e r 50
51.
Source: Sensor Tower Note:
Active users are iOS and Android combined. Retail media channels include display, video, mobile, OTT, and paid social. AverageMobileMonthlyActiveUsers(MAU)vs.RetailMediaImpressionsAcrossAllDevices January - November 2024, United States TopRetailersLeverageAll ToolsAvailable,From MobiletoRetailMedia Retail Top US retailers like Walmart and Target are leaders in both retail media and mobile app usage as they use every opportunity available to connect customers with the products they are searching for. Unsurprisingly, mobile-first food delivery companies like Uber Eats and DoorDash have relatively high app usage compared to traditional brick and mortar retailers. On the other side, Pet Stores lean heavily on retail media but have yet to invest as much in boosting mobile app adoption, suggesting that mobile could be a nice opportunity for retailers like Chewy and Petco to improve the shopping experience and boost customer loyalty. 0 10M 20M 30M 40M 0 5B 10B 15B 20B 25B 30B 35B 40B 45B 50B 55B A v e r a g e M o b i l e M A U Retail Media Impressions General Retailer Pet Store Other Retailer Food Delivery Retailer:Walmart Product: MacBookAir Co-Branded Advertiser:AppleInc. ExampleRetailMediaCreative WhatisRetailMedia? Sensor Tower's Retail Media Insights provides marketers with complete visibility into the co-branded digital advertising ecosystem and retail media networks. Your customized marketing insights reports empower you with a view into spend, media mix, impressions, and share of voice for display, video, mobile, OTT, and paid social across your selected retail partners and competitors. Click here to learn more or request a demo! Walmart Target Chewy Petco DoorDash UberEats Instacart HomeDepot Sephora Kroger BestBuy Macy's Walgreens Ulta Lowe's S t a t e o f M o b i l e 2 0 2 5 C o p y r i g h t © S e n s o r T o w e r 51
52.
Source: Sensor Tower Note:
iOS and Google Play combined. iOS only for China. Apps classified using Sensor Tower's taxonomy as of January 5, 2025. 2024RankingsbyMarket| Retail Download data AMER - Downloads Temu (Shopping (General)) Temu (Shopping (General)) Temu (Shopping (General)) Temu (Shopping (General)) Temu (Shopping (General)) MercadoLibre (Shopping (General)) SHEIN (Women's Apparel) SHEIN (Women's Apparel) SHEIN (Women's Apparel) SHEIN (Women's Apparel) Shopee (Shopping (General)) Carrefour Argentina (Grocery Stores) Meesho (Shopping (General)) Amazon (Shopping (General)) Amazon (Shopping (General)) MercadoLibre (Shopping (General)) MercadoLibre (Shopping (General)) Alibaba.com (Shopping (General)) Amazon (Shopping (General)) Walmart (Shopping (General)) Shop (Shopping (General)) AliExpress (Shopping (General)) SHEIN (Women's Apparel) Samsung Shop by Samsung Electronics Argentina (Computers & Consumer Electronics) Shopee (Shopping (General)) Shop (Shopping (General)) Walmart (Shopping (General)) Amazon (Shopping (General)) Amazon (Shopping (General)) adidas (Sneakers & Athletic Footwear) 1 2 3 4 5 Worldwide United States Canada Mexico Brazil Argentina S t a t e o f M o b i l e 2 0 2 5 C o p y r i g h t © S e n s o r T o w e r 52
53.
06 S t a t e o f M o b i l e 2 0 2 5 C o p y r i g h t © S e n s o r T o w e r 53 Video Streaming Engagement in streaming
apps is falling as users experience "digital fatigue" and competition from other entertainment apps like TikTok. Monetization is still flourishing despite this, with strong growth in mobile consumer spend and OTT ad spend.
54.
Worldwide 1 Rank Source: Sensor Tower Note:
iOS and Google Play combined. iOS only for China. Revenue is gross — inclusive of any percent taken by the app stores. Video Streaming apps classified using Sensor Tower's taxonomy as of January 5, 2025. YearlyTrendsforVideoStreamingApps QuicklyIdentifyBreakoutPerformers Sensor Tower customers can quickly identify the fastest growing apps, including short-form drama apps like DramaBox and ShortMax. Click here to request a demo! EngagementTrendsReveal aSaturatedStreamingApp Market VideoStreaming Downloads TimeSpent(Hours) YoYGrowth YoYGrowth IAPRevenue 3.5B 3B 2.5B 2B 1.5B 1B 0.5B 0 2021 2022 2023 2024 10% 8% 6% 4% 2% 0 2021 2022 2023 2024 YoYGrowth 80B 70B 60B 50B 40B 30B 20B 10B 0 2021 2022 2023 2024 $12B $10B $8B $6B $4B $2B 0 2021 2022 2023 2024 0 -1% -2% -3% -4% -5% 2021 2022 2023 2024 30% 20% 10% 0 2021 2022 2023 2024 While streaming mobile apps have seen ongoing growth in in- app revenue and downloads, engagement is falling as users experience "digital fatigue", macroeconomic pressure on consumer spending, competition from social apps, and as networks increasingly depend on live events (sports, etc.) and tentpole content to retain users. The lack of switching costs between the various streaming platforms also allows users to churn on and off of the different networks based on programming, making it difficult for newer and smaller platforms to drive loyalty and grow subscribers. Excluding India, time spent on streaming apps was roughly the same in 2024 as it was the previous year, so there are pockets of growth in emerging markets. Time spent still declined in some of the highest revenue markets like the US and China. Some of the rise in IAP revenue may be attributed to consumers becoming more comfortable paying for these services on their mobile devices, even as they split time watching on their TVs, phones, and other devices. S t a t e o f M o b i l e 2 0 2 5 C o p y r i g h t © S e n s o r T o w e r 54
55.
Source: Sensor Tower Note:
Ad spend and impressions estimates as of January 5, 2025. Includes ads on connected TVs, streaming devices (e.g., Apple TV, PlayStation, Roku), and desktop and mobile devices. MonthlyUnitedStatesOTTAdSpend WantMoreAdvertisingInsights? Sensor Tower's State of Digital Advertising 2024: OTT Snapshot report digs into the latest trends in OTT advertising in the United States. UnitedStatesOTTAdSpend Approached$16Billionin 2024,Up10%YoY VideoStreaming MonthlyUnitedStatesOTTAdImpressionsbyStreamingService $1.6B $1.4B $1.2B $1B $0.8B $0.6B $0.4B $0.2B 0 J a n - 2 0 2 2 F e b - 2 0 2 2 M a r - 2 0 2 2 A p r - 2 0 2 2 M a y - 2 0 2 2 J u n - 2 0 2 2 J u l - 2 0 2 2 A u g - 2 0 2 2 S e p - 2 0 2 2 O c t - 2 0 2 2 N o v - 2 0 2 2 D e c - 2 0 2 2 J a n - 2 0 2 3 F e b - 2 0 2 3 M a r - 2 0 2 3 A p r - 2 0 2 3 M a y - 2 0 2 3 J u n - 2 0 2 3 J u l - 2 0 2 3 A u g - 2 0 2 3 S e p - 2 0 2 3 O c t - 2 0 2 3 N o v - 2 0 2 3 D e c - 2 0 2 3 J a n - 2 0 2 4 F e b - 2 0 2 4 M a r - 2 0 2 4 A p r - 2 0 2 4 M a y - 2 0 2 4 J u n - 2 0 2 4 J u l - 2 0 2 4 A u g - 2 0 2 4 S e p - 2 0 2 4 O c t - 2 0 2 4 N o v - 2 0 2 4 D e c - 2 0 2 4 2024:$16.0B (+10%YoY) 2023:$14.5B (+15%YoY) 2022:$12.6B 60B 50B 40B 30B 20B 10B 0 J a n - 2 0 2 2 F e b - 2 0 2 2 M a r - 2 0 2 2 A p r - 2 0 2 2 M a y - 2 0 2 2 J u n - 2 0 2 2 J u l - 2 0 2 2 A u g - 2 0 2 2 S e p - 2 0 2 2 O c t - 2 0 2 2 N o v - 2 0 2 2 D e c - 2 0 2 2 J a n - 2 0 2 3 F e b - 2 0 2 3 M a r - 2 0 2 3 A p r - 2 0 2 3 M a y - 2 0 2 3 J u n - 2 0 2 3 J u l - 2 0 2 3 A u g - 2 0 2 3 S e p - 2 0 2 3 O c t - 2 0 2 3 N o v - 2 0 2 3 D e c - 2 0 2 3 J a n - 2 0 2 4 F e b - 2 0 2 4 M a r - 2 0 2 4 A p r - 2 0 2 4 M a y - 2 0 2 4 J u n - 2 0 2 4 J u l - 2 0 2 4 A u g - 2 0 2 4 S e p - 2 0 2 4 O c t - 2 0 2 4 N o v - 2 0 2 4 D e c - 2 0 2 4 Hulu Peacock Pluto TV Tubi Netflix Paramount+ Other OTT Streaming Services 2024:570B (+8%YoY) 2023:530B (+10%YoY) 2022:480B Hulu remains the largest Over-the-Top (OTT) advertising platform, but rivals, such as Netflix and Disney+ have added ad-supported options to their offerings and are seeing rapid gains in advertising spend and impressions on their networks. As OTT has a broader audience than certain social networks, it's attractive to advertisers who wish to reach a broad and diversified demographic. As the larger networks hit saturation in many markets, they have added ad-supported subscriptions to allow them to monetize their networks and attract consumers at a lower price point than those who can afford to pay for the ad-free service. S t a t e o f M o b i l e 2 0 2 5 C o p y r i g h t © S e n s o r T o w e r 55
56.
Source: Sensor Tower Note:
iOS and Google Play combined. iOS only for China. Apps classified using Sensor Tower's taxonomy as of January 5, 2025. 2024RankingsbyMarket| Video Streaming Download data AMER - Downloads Netflix (Film & Television Streaming) Max: Stream HBO, TV, & Movies (Film & Television Streaming) Amazon Prime Video (Film & Television Streaming) Max: Stream HBO, TV, & Movies (Film & Television Streaming) Max: Stream HBO, TV, & Movies (Film & Television Streaming) Max: Stream HBO, TV, & Movies (Film & Television Streaming) JioCinema (Film & Television Streaming) Netflix (Film & Television Streaming) Disney+ (Film & Television Streaming) VIX (Film & Television Streaming) Netflix (Film & Television Streaming) Disney+ (Film & Television Streaming) Amazon Prime Video (Film & Television Streaming) Peacock TV (Film & Television Streaming) Netflix (Film & Television Streaming) Netflix (Film & Television Streaming) Globo Play (Film & Television Streaming) Netflix (Film & Television Streaming) Max: Stream HBO, TV, & Movies (Film & Television Streaming) Amazon Prime Video (Film & Television Streaming) Tubi TV (Film & Television Streaming) Amazon Prime Video (Film & Television Streaming) Amazon Prime Video (Film & Television Streaming) Amazon Prime Video (Film & Television Streaming) DramaBox - movies and drama (Film & Television Streaming) Paramount+ (Film & Television Streaming) Crave (Film & Television Streaming) DramaBox - movies and drama (Film & Television Streaming) ReelShort (Film & Television Streaming) MOVISTAR+ (Film & Television Streaming) 1 2 3 4 5 Worldwide United States Canada Mexico Brazil Argentina S t a t e o f M o b i l e 2 0 2 5 C o p y r i g h t © S e n s o r T o w e r 56
57.
07 S t a t e o f M o b i l e 2 0 2 5 C o p y r i g h t © S e n s o r T o w e r 57 Social Time spent in
Social Media apps reached an all-time high in 2024. Meanwhile, top apps continued to diversify their monetization with in-app purchase and subscription offerings. Reddit has utilized Sensor Tower over the last year as we've built out our App Ads business and found their data, insights, and trends to be invaluable. Sensor Tower's market insights have allowed us to see not only the trends across our clients' focus areas, but also how that can be paired with Reddit's Community based marketing approach to refine acquisition strategies and move the App ecosystem forward. RyanAngerami Head of App Dev. Reddit
58.
Worldwide 1 Rank Source: Sensor Tower Note:
iOS and Google Play combined. iOS only for China. Revenue is gross — inclusive of any percent taken by the app stores. Social apps classified using Sensor Tower's taxonomy as of January 5, 2025. YearlyTrendsforSocialApps UsersAverageatLeast1HourperDayin3Apps Sensor Tower customers can find out which ones achieved this milestone in 2024 here. MobileUsersSpent3 TrillionHoursonSocial Appsin2024 Social Downloads TimeSpent(Hours) YoYGrowth YoYGrowth IAPRevenue YoYGrowth 3T 2.5T 2T 1.5T 1T 0.5T 0 2021 2022 2023 2024 $12B $10B $8B $6B $4B $2B 0 2021 2022 2023 2024 10% 8% 6% 4% 2% 0 2021 2022 2023 2024 24% 18% 12% 6% 0 2021 2022 2023 2024 9B 8B 7B 6B 5B 4B 3B 2B 1B 0 2021 2022 2023 2024 2% 0 -2% -3% 2021 2022 2023 2024 iOS and Android phone users spent a combined three trillion hours on Social Media and Social Messaging apps in 2024, up 6% from the 2.8 trillion hours spent in 2023. India was a major contributor to this growth with Social app time spent climbing 16% YoY in the market. Social apps are also diversifying their monetization strategies. While the social media giants were traditionally reliant on advertising for the bulk of their revenue, TikTok's success with in-app purchases (IAPs) prompted other apps like Instagram and Snapchat to add their own IAPs as an additional revenue stream, particularly as new regulations added challenges to the advertising market. Downloads have remained high even in a stable market. Still, there have been some opportunities for new players to emerge. For example, changes to X (formerly Twitter) following its acquisition by Elon Musk opened the door for some new microblogging apps to enter the space. S t a t e o f M o b i l e 2 0 2 5 C o p y r i g h t © S e n s o r T o w e r 58
59.
Worldwide 1 Rank Source: Sensor Tower Note:
iOS and Google Play combined. iOS only for China. Social apps classified using Sensor Tower's taxonomy as of January 5, 2025. SocialTimeSpentTrendsbySubgenre SocialAppUsagePlateaued inSomeMatureMarkets Globally, Social apps show no signs of reaching their ceiling, with time spent climbing past 600 billion hours per quarter at the end of 2024. India in particular has seen huge growth, with time spent on Social Media apps more than doubling since the start of 2021. And this isn't only from an influx of new smartphone users in the country — for comparison, time spent on Social Messaging apps have held roughly flat over this same period. Several markets may be reaching saturation, with some consumers even setting limits for time spent on Social Media apps. In the US and the UK, Social Media time spent was down slightly in 2024. Still, the average user in the US spent 90 minutes per day on Social Media apps, the average UK user wasn't far behind at 85 minutes per day. Social TopAppsbyDownloadsin2024 QuarterlyTimeSpent(Hours) bySubgenre 0 100B 200B 300B 400B 500B 600B 700B 2 0 2 1 Q 1 2 0 2 1 Q 2 2 0 2 1 Q 3 2 0 2 1 Q 4 2 0 2 2 Q 1 2 0 2 2 Q 2 2 0 2 2 Q 3 2 0 2 2 Q 4 2 0 2 3 Q 1 2 0 2 3 Q 2 2 0 2 3 Q 3 2 0 2 3 Q 4 2 0 2 4 Q 1 2 0 2 4 Q 2 2 0 2 4 Q 3 2 0 2 4 Q 4 Social Media Social Messaging Instagram Social Media TikTok Social Media WhatsApp Messenger Social Messaging Facebook Social Media Telegram Social Messaging Threads Social Media Snapchat Social Media Messenger Social Messaging Pinterest Social Media YouTube Social Media 1 2 3 4 5 6 7 8 9 10 App Subgenre S t a t e o f M o b i l e 2 0 2 5 C o p y r i g h t © S e n s o r T o w e r 59
60.
Source: Sensor Tower Note:
Demographics and ad impressions for mobile app users on Android in the United States in Q4 2024. Gender represented as Men and Women only and is not representative of all gender identities. SocialAdChannelImpressionsbyAppCategory Share of Impressions, % Difference vs. General Population ReachingyourAudienceShouldn’tBeCostly Audience Insights offers the first of its kind visibility into your existing, competitor, and potential new audiences, across all social and mobile platforms in one place. AdvertisersSelectTheir SocialAdChannelMixto MeetTheirAudience Social AppCategoryDemographicsvs.SocialAppDemographics Category | Books Facebook TikTok Pinterest YouTube LinkedIn Instagram Reddit X (Formerly Twitter) Snapchat +47% +10% -5% -8% -10% -14% -17% -42% -43% 0 50% 100% 0 5 0 % 1 0 0 % % U s e r s A g e < 3 5 % Women Users Facebook Instagram YouTube TikTok LinkedIn Snapchat Pinterest X (formerly Twitter) Reddit 0 50% 100% 0 5 0 % 1 0 0 % % U s e r s A g e < 3 5 % Women Users Category | Books M o r e y o u n g u s e r s Morewomenusers AdvertisingremainsakeyfocusforSocialapps,withsocial medianetworkslikeFacebookandTikTokaccountingfor roughly75%ofdigitaladspendintheUSaccordingtoSensor Tower'slatestDigital Market Index report. Many app categories tailor their social advertising to invest more in channels that have a similar demographic skew. Sports app users, for example, are more likely to be men and thus Sports app advertisers invest more in X, LinkedIn, and Reddit, which also skew more towards male users. There are some exceptions to this trend. Food & Drink apps frequently advertise on LinkedIn and X despite having a user base that skews more towards women and towards older users. This suggests that these ad channels can be a useful way for some Food & Drink apps to expand their user base and appeal to a different demographic. S t a t e o f M o b i l e 2 0 2 5 C o p y r i g h t © S e n s o r T o w e r 60
61.
Source: Sensor Tower Note:
Android phones in the United States in 2024. ShortVideoUsageinTopSocialApps Share of Time Spent by In-App Feature MetaDoublesDownon StrategicInvestmentto DriveReelsAdoptionon Facebook Social Short-Form Video (Main Feed) Profile Feed Live Chat Other Short-Form Videos (Reels) Main Feed Chat Story Other Short-Form Video (Shorts) Video Homescreen Other Short-Form Video (Spotlight) Chat Story Camera Other Short-Form Video (Reels) Main Feed Post Detail Page Marketplace Other Short-Form Video (Video Feed) Main Feed Post Detail Page Profile Feed Other 10% 20% 30% 40% 50% 60% 70% 80% 90% 100% Short-Form Video (Video Feed) Post Detail Page Main Feed Subreddit Other TikTok Instagram YouTube Snapchat Facebook X Reddit TikTok is the clear leader among short-form video apps, and its success has prompted other social leaders to add their own short-form video features. During its 3Q24 earnings call, CFO Susan Li flagged that Meta has undertaken a concerted strategic effort to revamp Facebook’s video player to allow for a full screen format, which will build on the company’s ongoing efforts to unify and integrate Reels within video on Facebook. Sensor Tower data reveals that US Facebook user time spent on Reels in December 2024 increased 17 percentage points from January 2024, equating to millions of engagement hours shifting to the feature over the period in which Meta’s unification efforts began. Although the Main Feed (36%) still made up the plurality of US Facebook user time spent in December, its share was down roughly two percentage points from January, which may suggest consumers are shifting their time to other features on Facebook, such as Reels. S t a t e o f M o b i l e 2 0 2 5 C o p y r i g h t © S e n s o r T o w e r 61
62.
Source: Sensor Tower Note:
iOS and Google Play combined in the United States. Top in-app purchases on iOS only. AverageDailyTimeSpentvs.Short-FormVideoShareofUsageforTopSocialApps United States TracktheKPIsYouCareAbout Sensor Tower customers can continue to monitor key metrics for these apps, including revenue per download (RPD) and average revenue per daily active user (ARPDAU). CanCompetitorsCapture TikTok'sShort-FormVideo Magic? Social 0 20 40 60 80 100 0 10 20 30 40 50 60 70 A v g . D a i l y T i m e S p e n t ( M i n u t e s ) Short-Form Video Share of Usage (%) TikTok Instagram YouTube Snapchat Facebook X Reddit 0 20 40 60 80 100 0 10 20 30 40 50 60 70 A v g . D a i l y T i m e S p e n t ( M i n u t e s ) Short-Form Video Share of Usage (%) TikTok Instagram YouTube Snapchat Facebook X Reddit 65 coins - $0.99 Meta Verified Standard (Monthly) - $14.99 YouTube Premium (Monthly) - $18.99 Snapstreak Restore - $0.99 Supporter (Monthly) - $4.99 X Premium (Monthly) - $11.00 Reddit Premium (Monthly) - $6.99 20 coins - $0.29 Instagram Badge - $4.99 YouTube Premium (Monthly) - $18.99 Snapchat+ (Monthly Plan) - $3.99 99 stars - $0.99 X Premium Plus (Monthly) - $30.00 Reddit Gold - $1.99 330 coins - $4.99 Instagram Badge - $0.99 Movies & Shows - $3.99 Snapchat+ (Monthly Plan) - $3.99 45 stars - $0.99 X Premium Basic (Monthly) - $4.00 Reddit Annual Premium - $59.99 130 coins - $1.99 Meta Verified Standard (Monthly) - $14.99 YouTube Premium (Monthly) - $18.99 Snapchat+ (Monthly Plan) - $3.99 530 stars - $9.99 @elonmusk Subscription (Monthly) - $4.00 Collectible Avatar - Tier 499 - $4.99 1120 coins - $16.99 Meta Verified Standard (Monthly) - $14.99 YouTube Premium (Monthly) - $18.99 Snapchat+ (Monthly Plan) - $3.99 1200 stars - $19.99 X Premium (Annual) - $114.99 Reddit Gold - $5.99 1 2 3 4 5 TikTok Instagram YouTube Snapchat Facebook X Reddit One-Time Purchase Subscription Key: TopIn-AppPurchasesforSocialApps on iOS in the United States as of December 31, 2024 TikTok maintained a huge lead over its competitors in terms of monthly average revenue per user (ARPU) from in-app purchases. Even looking exclusively at iOS (since Google- owned YouTube doesn't monetize on Google Play), TikTok had nearly double the in-app purchase (IAP) revenue compared to the #2 Social Media app, YouTube, despite having roughly 60% of YouTube's average MAU. TikTok was also well ahead in terms of short-form video usage, and it has certainly been successful at monetizing this user attention. Meta-owned Instagram and Facebook lag when it comes to ARPU. Both apps are attempting to monetize using similar one-time IAP offerings to TikTok, with Instagram Badges and Facebook stars, in addition to subscription options. BubbleSize= Monthly Average Revenue per User (ARPU) S t a t e o f M o b i l e 2 0 2 5 C o p y r i g h t © S e n s o r T o w e r 62
63.
Source: Sensor Tower Note:
Time spent across iOS and Android combined. Engagement metrics on Android only in the United States. WorldwideTotalTimeSpent(Hours)inTopMicrobloggingApps DiveintoAppEngagementLikeNeverBefore Sensor Tower's Advanced Usage Insights lets you create engagement benchmarks, analyze user retention, and even study day-to-day mobile behaviors. MicrobloggingAppsGain Users,butisAttention ShiftingElsewhere? Social Q4 2023 Q4 2024 0 50 100 150 0 10 20 30 40 50 60 70 M i n u t e s p e r W e e k Sessions per Week X(formerlyTwitter) Threads BlueskySocial MicrobloggingAppEngagementSummary on Android in the United States 0 1B 2B 3B 4B F e b - 2 0 2 1 A p r - 2 0 2 1 J u n - 2 0 2 1 A u g - 2 0 2 1 O c t - 2 0 2 1 D e c - 2 0 2 1 F e b - 2 0 2 2 A p r - 2 0 2 2 J u n - 2 0 2 2 A u g - 2 0 2 2 O c t - 2 0 2 2 D e c - 2 0 2 2 F e b - 2 0 2 3 A p r - 2 0 2 3 J u n - 2 0 2 3 A u g - 2 0 2 3 O c t - 2 0 2 3 D e c - 2 0 2 3 F e b - 2 0 2 4 A p r - 2 0 2 4 J u n - 2 0 2 4 A u g - 2 0 2 4 O c t - 2 0 2 4 D e c - 2 0 2 4 X (formerly Twitter) Threads Sina Weibo Tumblr Bluesky Social Zen Naver Blog Mastodon Truth Social 2024:35.6B 2021:39.5B -10% Discontent around changes to X following Elon Musk's acquisition of the service in 2022 caused it to lose some of its customer base and opened the door for competing services like Threads and Bluesky Social. The company has lost advertisers as well — according to Sensor Tower advertising data, 64 out of the top 100 advertisers from January through October 2022 (prior to the acquisition) no longer spent on X between January through October 2024. With X as the runaway leader by time spent in the space, global time spent for the top 10 apps fell 10% between 2021 and 2024. While some X users are switching to alternatives, others simply found other sources of entertainment like short- form videos or streaming. By the December 2024, Threads global daily active users (DAU) had reached 45% of X's total — and 85% of X's monthly active users (MAU). However, X competitors are still struggling to achieve its high engagement, and the gap is narrowing slowly. BubbleSize= Days Used per Month S t a t e o f M o b i l e 2 0 2 5 C o p y r i g h t © S e n s o r T o w e r 63
64.
Source: Sensor Tower Note:
iOS and Google Play combined. iOS only for China. Apps classified using Sensor Tower's taxonomy as of January 5, 2025. 2024RankingsbyMarket| Social Download data AMER - Downloads Instagram (Social Media) TikTok (Social Media) Threads (Social Media) TikTok (Social Media) Instagram (Social Media) Instagram (Social Media) TikTok (Social Media) Threads (Social Media) TikTok (Social Media) Facebook (Social Media) TikTok (Social Media) TikTok (Social Media) WhatsApp Messenger (Social Messaging) Instagram (Social Media) WhatsApp Messenger (Social Messaging) WhatsApp Messenger (Social Messaging) WhatsApp Messenger (Social Messaging) Threads (Social Media) Facebook (Social Media) WhatsApp Messenger (Social Messaging) Facebook (Social Media) Instagram (Social Media) Threads (Social Media) Facebook (Social Media) Telegram (Social Messaging) Facebook (Social Media) Instagram (Social Media) Threads (Social Media) Facebook (Social Media) WhatsApp Messenger (Social Messaging) 1 2 3 4 5 6 Worldwide United States Canada Mexico Brazil Argentina S t a t e o f M o b i l e 2 0 2 5 C o p y r i g h t © S e n s o r T o w e r 64
65.
08 S t a t e o f M o b i l e 2 0 2 5 C o p y r i g h t © S e n s o r T o w e r 65 Food &Drink Mobile apps have
become a critical part of the strategy for restaurants and grocery stores alike, improving the customer experience and boosting loyalty.
66.
Worldwide 1 Rank Source: Sensor Tower Note:
iOS and Google Play combined. iOS only for China. Food & Drink apps classified using Sensor Tower's taxonomy as of January 5, 2025. YearlyTrendsforFood&DrinkApps MobileAppsHelp RestaurantsandGrocery StoresImprovethe CustomerExperience Food&Drink Downloads Sessions YoYGrowth YoYGrowth 2B 1.6B 1.2B 0.8B 0.4B 0 2021 2022 2023 2024 300B 250B 200B 150B 100B 50B 0 2021 2022 2023 2024 8% 6% 4% 2% 0 2021 2022 2023 2024 10% 8% 6% 4% 2% 0 2021 2022 2023 2024 Food & Drink app download and session growth accelerated in 2024 as more companies integrated the app into the customer buying experience. Whether it's fast food restaurants offering convenient options like pickup or delivery, or grocery stores giving easy access to coupons as a way to boost customer loyalty, mobile apps connected food providers with customers like never before. While global trends have been fairly consistent, the Food & Drink app space still varies significantly between countries. The market in Latin America has yet to regain the high adoption seen during the pandemic, while countries like Japan and South Korea have seen strong growth return. S t a t e o f M o b i l e 2 0 2 5 C o p y r i g h t © S e n s o r T o w e r 66
67.
Worldwide 1 Rank Source: Sensor Tower Note:
iOS and Google Play combined. iOS only for China. Food & Drink apps classified using Sensor Tower's taxonomy as of January 5, 2025. Food&DrinkDownloadTrendsbySubgenre Q-commerceDemand SurgesinIndia:Zepto's GrowthLeadstheMarket Food&Drink TopAppsbyDownloadsin2024 QuarterlyDownloadsbySubgenre 0 20M 40M 60M 80M 100M 120M 140M 160M 180M 2 0 2 1 Q 1 2 0 2 1 Q 2 2 0 2 1 Q 3 2 0 2 1 Q 4 2 0 2 2 Q 1 2 0 2 2 Q 2 2 0 2 2 Q 3 2 0 2 2 Q 4 2 0 2 3 Q 1 2 0 2 3 Q 2 2 0 2 3 Q 3 2 0 2 3 Q 4 2 0 2 4 Q 1 2 0 2 4 Q 2 2 0 2 4 Q 3 2 0 2 4 Q 4 Fast Food & Fast Casual Restaurants Restaurant Ordering & Delivery Grocery Delivery Other Food Delivery Services Dining Listings, Reviews & Reservations Other Dining & Restaurants McDonald's Fast Food & Fast Casual Restaurants Zepto Grocery Delivery KFC Fast Food & Fast Casual Restaurants Domino's Pizza Fast Food & Fast Casual Restaurants Zomato Dining Listings, Reviews & Reservations Burger King Fast Food & Fast Casual Restaurants Grab Other Food Delivery Services Uber Eats Restaurant Ordering & Delivery Swiggy Restaurant Ordering & Delivery Blinkit Grocery Delivery 1 2 3 4 5 6 7 8 9 10 App Subgenre Between 2021 and 2024, downloads of Fast Food & Fast Casual Restaurant (FFFCR) apps grew by 24%, widening the gap compared to other subgenres. FFFCR apps saw particularly robust adoption in Japan, with an 85% increase, and in Turkey, where downloads surged by 76%. Meanwhile, Restaurant Ordering & Delivery downloads have turned the corner after falling off from the high demand during the pandemic. In the second half of 2024, the Grocery Delivery subgenre's downloads surged, driven primarily by Zepto's nearly 300% growth in India compared to H1 2024. Its introduction of the Postpaid feature in 2024, allowing customers to "buy now, pay later," solidified Zepto's position in India's Q-commerce market. In Q4 2024, Zepto's average MAUs in India surpassed Blinkit's for the first time. S t a t e o f M o b i l e 2 0 2 5 C o p y r i g h t © S e n s o r T o w e r 67
68.
Source: Sensor Tower Note:
iOS and Google Play combined. iOS only for China. Percentage of mobile gamers using Fast Food apps are Android only. FastFoodRestaurantWeeklyDownloadsin2024 ExploreDozensofUserPersonas Understand your target audience like never before with Audience Insights. See overlap with Crypto Traders, Fitness Enthusiasts, Console Gamers, and more! FastFood&MobileGame PartnershipsDriveNewUser Acquisition Food&Drink PercentageofMobileGamersUsingFastFoodApps Quarter Before vs. Quarter After Collaboration KFCinJapan McDonald'sintheUnitedStates 0 0.2M 0.4M 0.6M 0.8M 1M 1.2M 8 - J a n 2 9 - J a n 1 9 - F e b 1 1 - M a r 1 - A p r 2 2 - A p r 1 3 - M a y 3 - J u n 2 4 - J u n 1 5 - J u l 5 - A u g 2 6 - A u g 1 6 - S e p 7 - O c t 2 8 - O c t 0 50K 100K 150K 8 - J a n 2 9 - J a n 1 9 - F e b 1 1 - M a r 1 - A p r 2 2 - A p r 1 3 - M a y 3 - J u n 2 4 - J u n 1 5 - J u l 5 - A u g 2 6 - A u g 1 6 - S e p 7 - O c t 2 8 - O c t 24% 20% 16% 12% 8% 4% 0 McDonald’s X Genshin Impact KFC X Uma Musume KFC X Genshin Impact 15.7% 20.9% 5.5% 9.3% 3.5% 6.6% Quarter Before Quarter After First week of McDonald’s X Genshin Impact First week of KFC X Genshin Impact First week of KFC X Uma Musume 2Q24 vs 3Q24 in the US 2Q24 vs 3Q24 in Japan 3Q24 vs 4Q24 in Japan In 2024, fast food chains are increasingly teaming up with popular games to attract new app users and enhance customer engagement. Notable collaborations include McDonald's partnership with Genshin Impact in the US and KFC's alliance with Uma Musume Pretty Derby and Genshin Impact in Japan. Following their collaboration with Genshin Impact in the US, McDonald's saw a significant WoW app download increase of 105% in the first week. Sensor Tower Audience Insights show that in Q3 2024, 21% of Genshin Impact players used the McDonald's app, a rise of five percentage points from the previous quarter. KFC's partnerships with Uma Musume and Genshin Impact in Japan led to a rise in app engagement, with 9% of Uma Musume players and 6% of Genshin Impact players using the app during the collaboration quarter, marking a four percentage point and three increase QoQ S t a t e o f M o b i l e 2 0 2 5 C o p y r i g h t © S e n s o r T o w e r 68
69.
Source: Sensor Tower Note:
iOS and Google Play combined. iOS only for China. Apps classified using Sensor Tower's taxonomy as of January 5, 2025. 2024RankingsbyMarket| Food & Drink Download data AMER - Downloads McDonald's (Fast Food & Fast Casual Restaurants) McDonald's (Fast Food & Fast Casual Restaurants) McDonald's (Fast Food & Fast Casual Restaurants) DiDi Food (Restaurant Ordering & Delivery) iFood (Restaurant Ordering & Delivery) PedidosYa (Restaurant Ordering & Delivery) Zepto (Grocery Delivery) DoorDash (Restaurant Ordering & Delivery) Too Good To Go (Restaurant Ordering & Delivery) Rappi (Other Food Delivery Services) McDonald's (Fast Food & Fast Casual Restaurants) McDonald's (Fast Food & Fast Casual Restaurants) KFC (Fast Food & Fast Casual Restaurants) Uber Eats (Restaurant Ordering & Delivery) Tim Hortons (Fast Food & Fast Casual Restaurants) Uber Eats (Restaurant Ordering & Delivery) BURGER KING App (Fast Food & Fast Casual Restaurants) Mostaza (Fast Food & Fast Casual Restaurants) Domino's Pizza (Fast Food & Fast Casual Restaurants) Taco Bell (Fast Food & Fast Casual Restaurants) DoorDash (Restaurant Ordering & Delivery) McDonald's (Fast Food & Fast Casual Restaurants) Zé Delivery de Bebidas (Grocery Delivery) Grido (Dine-In Restaurants) Zomato (Dining Listings, Reviews & Reservations) Domino's Pizza (Fast Food & Fast Casual Restaurants) Uber Eats (Restaurant Ordering & Delivery) Domino's Pizza (Fast Food & Fast Casual Restaurants) Entregador (Restaurant Ordering & Delivery) BURGER KING App (Fast Food & Fast Casual Restaurants) 1 2 3 4 5 Worldwide United States Canada Mexico Brazil Argentina S t a t e o f M o b i l e 2 0 2 5 C o p y r i g h t © S e n s o r T o w e r 69
70.
09 S t a t e o f M o b i l e 2 0 2 5 C o p y r i g h t © S e n s o r T o w e r 70 Travel A few years
after travel soared due to pent-up demand post-pandemic, a trend is clear: mobile apps are becoming an increasingly common part of people's travel experience. Today’s travelers are spending more time on phones, presenting new opportunities for brands to leverage all-in- one app offerings to meet customers where they’re shopping. As a leading travel experiences marketplace, Viator is building a best-in-class mobile app that makes planning and booking experiences easier than ever – everything from helping travelers discover more personalized activities and modify bookings on the go, to giving tour operators a seamless way to communicate and share real-time information with their travelers. KrzysztofMarcisz VP of Product Viator
71.
Worldwide 1 Rank Source: Sensor Tower Note:
iOS and Google Play combined. iOS only for China. Travel apps classified using Sensor Tower's taxonomy as of January 5, 2025. YearlyTrendsforTravelApps InterestedinMoreTravelInsights? Download our 2024 Travel Apps and Brands Market Insights report! TravelAppsSoaredPost- PandemicandSustained GainsSince Travel Downloads TimeSpent(Hours) YoYGrowth YoYGrowth 4.5B 4B 3.5B 3B 2.5B 2B 1.5B 1B 0.5B 0 2019 2020 2021 2022 2023 2024 20B 16B 12B 8B 4B 0 2021 2022 2023 2024 30% 15% 0 -15% -30% 2019 2020 2021 2022 2023 2024 24% 18% 12% 6% 0 2021 2022 2023 2024 Travel app downloads have shown stable YoY growth, reaching 4.2 billion in 2024, marking a 3% increase from the previous year. This growth has been fueled by post-pandemic recovery; however, the growth rate has decelerated compared to previous years, partly due to soaring travel costs in 2024. Despite this, the genre has experienced a YoY rise in time spent, indicating that consumers are increasingly embracing mobile tools for planning and booking their trips. S t a t e o f M o b i l e 2 0 2 5 C o p y r i g h t © S e n s o r T o w e r 71
72.
Worldwide 1 Rank Source: Sensor Tower Note:
iOS and Google Play combined. iOS only for China. Travel apps classified using Sensor Tower's taxonomy as of January 5, 2025. TravelDownloadTrendsbySubgenre TransportationandTourism AppsAlikeReachNewHighs As global travel patterns settle in after a few turbulent years, several transportation subgenres have maintained strong growth for mobile adoption. Mobile apps are a convenient way for travelers to plan trips, buy and scan tickets, and more. Bus & Rail Services downloads were up 2% YoY and 44% from 2019 before the pandemic, while Airline apps achieved 5% growth YoY and 51% from 2019. Navigation & Maps maintained its position as the top Travel subgenre by quarterly downloads. The subgenre felt a relatively minor impact from the pandemic and has maintained modest YoY growth since. The Travel app market is also clearly impacted by seasonal patterns. For example, demand spikes in Europe during the summer months, making this time of year particularly important for travel brands to market their services and compete for users. Travel TopAppsbyDownloadsin2024 QuarterlyDownloadsbySubgenre 0 20M 40M 60M 80M 100M 120M 140M 160M 180M 200M 220M 240M 260M 280M 2 0 1 9 Q 2 2 0 1 9 Q 4 2 0 2 0 Q 2 2 0 2 0 Q 4 2 0 2 1 Q 2 2 0 2 1 Q 4 2 0 2 2 Q 2 2 0 2 2 Q 4 2 0 2 3 Q 2 2 0 2 3 Q 4 2 0 2 4 Q 2 2 0 2 4 Q 4 Navigation & Maps Bus & Rail Services Carpooling & Ridesharing Travel Booking Services & Travel Agencies Air Travel Accommodations & Lodging Google Maps Navigation & Maps Uber Carpooling & Ridesharing Where is my Train Bus & Rail Services Waze Navigation & Maps inDrive Carpooling & Ridesharing Airbnb Accommodations & Lodging Booking.com Travel Booking Services & Travel Agencies DiDi Rider Carpooling & Ridesharing Bolt Carpooling & Ridesharing Rapido Carpooling & Ridesharing 1 2 3 4 5 6 7 8 9 10 App Subgenre S t a t e o f M o b i l e 2 0 2 5 C o p y r i g h t © S e n s o r T o w e r 72
73.
Source: Sensor Tower Note:
Travel advertisers classified using Sensor Tower's taxonomy as of January 5, 2025. Persona usage data are Android only in the United States. TravelAdvertisers’VideoAdSpendAllocation OTT vs YouTube in the United States MorethanMobile Sensor Tower provides insights across the digital ecosystem, including digital advertising with Pathmatics by Sensor Tower, and detailed user behavior analysis with Audience Insights. TravelAdvertisersAmplify YouTubeInvestment In 2024, Travel advertisers shifted ad spending from OTT platforms to YouTube, which accounted for 59% of their video ad budget, up 7 percentage points (ppts) from 2023. The Accommodations & Lodging sector notably redirected 14 ppts to YouTube, with major players like Airbnb and Expedia (Vrbo) increasing their investments by 112% and 162%, respectively.This shift highlights YouTube's increasing influence in effectively engaging travel audiences, making it a key platform for advertisers in the sector. Sensor Tower Audience Insights data show that more than 90% of world travelers, hotel hoppers, and frequent flyers in the US accessed YouTube in Q4 2024, far exceeding Netflix (less than 50%), Hulu (less than 25%), and Peacock (less than 20%). This highlights YouTube’s dominance among travel- focused audiences and helps explain the growing ad investment shift from OTT platforms to YouTube. For a much more detailed look at the latest social and OTT advertising trends, check out our free State of Digital Advertising report. Travel %ofSelectedPersonaUsingYouTubevs.SelectStreamingServices in Q4 2024, United States 100% 80% 60% 40% 20% 0 Frequent Flyers Hotel Hoppers World Travelers 9 4 . 2 % 4 8 . 5 % 2 4 . 4 % 1 6 . 9 % 1 4 . 8 % 9 4 . 9 % 4 7 . 9 % 2 2 . 9 % 1 8 . 4 % 1 5 . 7 % 9 2 . 8 % 3 5 . 8 % 1 8 . 5 % 1 0 . 8 % 1 1 . 7 % YouTube Netflix Hulu Peacock Max 0% 20% 40% 60% 80% 100% Q1 2023 Q2 2023 Q3 2023 Q4 2023 Q1 2024 Q2 2024 Q3 2024 Q4 2024 OTT YouTube S t a t e o f M o b i l e 2 0 2 5 C o p y r i g h t © S e n s o r T o w e r 73
74.
Source: Sensor Tower Note:
iOS and Google Play combined. iOS only for China. Apps classified using Sensor Tower's taxonomy as of January 5, 2025. 2024RankingsbyMarket| Travel Download data AMER - Downloads Google Maps (Navigation & Maps) Google Maps (Navigation & Maps) Uber (Carpooling & Ridesharing) DiDi-Mobility (Carpooling & Ridesharing) Uber (Carpooling & Ridesharing) SUBE (Bus & Rail Services) Uber (Carpooling & Ridesharing) Uber (Carpooling & Ridesharing) Google Maps (Navigation & Maps) Uber (Carpooling & Ridesharing) 99Taxis (Other Transportation) Uber (Carpooling & Ridesharing) Where is my Train (Bus & Rail Services) Airbnb (Accommodations & Lodging) Expedia (Travel Booking Services & Travel Agencies) Google Maps (Navigation & Maps) Waze (Navigation & Maps) DiDi-Mobility (Carpooling & Ridesharing) Waze (Navigation & Maps) Lyft (Carpooling & Ridesharing) Airbnb (Accommodations & Lodging) inDrive (Carpooling & Ridesharing) Google Maps (Navigation & Maps) Uber Driver (Carpooling & Ridesharing) inDrive (Carpooling & Ridesharing) Expedia (Travel Booking Services & Travel Agencies) Air Canada (Air Travel) Airbnb (Accommodations & Lodging) Airbnb (Accommodations & Lodging) Cabify (Carpooling & Ridesharing) 1 2 3 4 5 Worldwide United States Canada Mexico Brazil Argentina S t a t e o f M o b i l e 2 0 2 5 C o p y r i g h t © S e n s o r T o w e r 74
75.
10 S t a t e o f M o b i l e 2 0 2 5 C o p y r i g h t © S e n s o r T o w e r 75 Health andFitness Health & Fitness
apps saw a resurgent year in 2024. Consumers have embraced personalized workout and fitness apps for years — now they turn to mobile apps for personalized healthcare too.
76.
Worldwide 1 Rank Source: Sensor Tower Note:
iOS and Google Play combined. iOS only for China. Revenue is gross — inclusive of any percent taken by the app stores. Health & Fitness apps classified using Sensor Tower's taxonomy as of January 5, 2025. YearlyTrendsforHealth&FitnessApps 2024WasaResurgentYear forMobileHealth&Fitness While downloads of Health & Fitness apps have remained stable since 2020, IAP revenue in this category has consistently grown across all major subgenres in recent years. The United States was the top market, capturing over half of global consumer spending in 2024, and there was a significant gap with the second-largest market, the UK, which accounted for an 8% revenue share. Within this category, the top subgenre, Gym & Fitness apps, accounted for 28% of total revenue and achieved 18% YoY growth in 2024. This reflects a broader shift towards digital fitness solutions for outdoor exercise, in addition to the convenience of home gym setups. Health&Fitness Downloads IAPRevenue YoYGrowth YoYGrowth $4B $3.5B $3B $2.5B $2B $1.5B $1B $0.5B 0 2019 2020 2021 2022 2023 2024 50% 40% 30% 20% 10% 0 2019 2020 2021 2022 2023 2024 4B 3.5B 3B 2.5B 2B 1.5B 1B 0.5B 0 2019 2020 2021 2022 2023 2024 60% 40% 20% 0 2019 2020 2021 2022 2023 2024 S t a t e o f M o b i l e 2 0 2 5 C o p y r i g h t © S e n s o r T o w e r 76
77.
Worldwide 1 Rank Source: Sensor Tower Note:
iOS and Google Play combined. iOS only for China. Health & Fitness apps classified using Sensor Tower's taxonomy as of January 5, 2025. Health&FitnessDownloadTrendsbySubgenre MedicalTrackingAppsSee ExplosiveGrowth In 2024, Gyms & Fitness retained its position as the top subgenre by downloads, experiencing moderate global growth with a 3% YoY increase. Seven of the top 10 apps by global downloads were Gyms & Fitness apps. The Medical Tracking app landscape is evolving rapidly, driven by technological advancements and growing consumer awareness of personalized healthcare. In 2024, the Medical Tracking subgenre saw a remarkable 43% increase in downloads YoY. Leading this surge was Health Tracker, released at the end of 2023, which quickly acquired new users, reaching 10 million MAUs just five months post-launch and maintaining over 12 million MAUs each month thereafter. Health&Fitness TopAppsbyDownloadsin2024 QuarterlyDownloadsbySubgenre 0 50M 100M 150M 200M 250M 300M 2 0 2 1 Q 1 2 0 2 1 Q 2 2 0 2 1 Q 3 2 0 2 1 Q 4 2 0 2 2 Q 1 2 0 2 2 Q 2 2 0 2 2 Q 3 2 0 2 2 Q 4 2 0 2 3 Q 1 2 0 2 3 Q 2 2 0 2 3 Q 3 2 0 2 3 Q 4 2 0 2 4 Q 1 2 0 2 4 Q 2 2 0 2 4 Q 3 2 0 2 4 Q 4 Gyms & Fitness Medical Tracking Apps Other Personal Health & Fitness Telehealth Nutrition & Diet Beauty Services & Spas Flo Period Tracking Health Tracker Medical Tracking Apps fitpro Gyms & Fitness Sweatcoin Gyms & Fitness Home Workout Gyms & Fitness Mi Fitness (Xiaomi Wear) Gyms & Fitness Da Fit Gyms & Fitness Strava Gyms & Fitness Step Counter - Pedometer Gyms & Fitness Mobile JKN National Medical Service 1 2 3 4 5 6 7 8 9 10 App Subgenre S t a t e o f M o b i l e 2 0 2 5 C o p y r i g h t © S e n s o r T o w e r 77
78.
Source: Sensor Tower Note:
iOS and Android combined. MAU market share is calculated at the app/user level (double-counts users who use multiple Walk & Run Tracking apps).. Retention is Android only. TopWalk&RunTrackingAppsMAUMarketShare iOS and Android in the United States InterestedinMarketLeadingUsageMetrics? Sensor Tower's Usage data offerings let you benchmark by user retention, active users, time spent, and more! And Advanced Usage offerings provide even more detail, including daily granularity and even hour-by- hour usage patterns. CompetitionHeatingUpfor FitnessRewardsApps Health&Fitness RetentionforTopWalk&RunTrackingApps All-Time on Android in the United States 100% 80% 60% 40% 20% 0% 2021 2022 2023 2024 33% 33% 33% 22% 22% 22% 16% 16% 16% 16% 16% 16% 39% 39% 39% 21% 21% 21% 16% 16% 16% 37% 37% 37% 18% 18% 18% 19% 19% 19% 23% 23% 23% 17% 17% 17% 13% 13% 13% 24% 24% 24% Sweatcoin Nike Run Club CashWalk WeWard Pacer Pedometer ASICS Runkeeper Other 0 20% 40% 60% D a y 1 D a y 2 D a y 3 D a y 4 D a y 5 D a y 6 D a y 7 D a y 8 D a y 9 D a y 1 0 D a y 1 1 D a y 1 2 D a y 1 3 D a y 1 4 D a y 1 5 D a y 1 6 D a y 1 7 D a y 1 8 D a y 1 9 D a y 2 0 D a y 2 1 D a y 2 2 D a y 2 3 D a y 2 4 D a y 2 5 D a y 2 6 D a y 2 7 D a y 2 8 D a y 2 9 D a y 3 0 Fitness tracking apps in the US have experienced significant growth in recent years, driven by increasing health awareness and a desire to stay active. Among them, apps with reward programs such as Sweatcoin, CashWalk, and WeWard, have gained popularity and stand out by incentivizing users to stay active by converting their steps into rewards. Sweatcoin continued to lead the market, holding nearly a quarter of the MAU market share among leading fitness tracking apps. Meanwhile, new entrants in the US such as CashWalk and WeWard are rapidly acquiring new users, with their MAUs increasing by 42% and an astounding 609% YoY in 2024, respectively. These fitness reward apps are also efficiently retaining users, with CashWalk and Sweatcoin's 30-day retention rates remaining at 31% and 20%, respectively, while other competitors struggle to maintain similar levels of user loyalty. S t a t e o f M o b i l e 2 0 2 5 C o p y r i g h t © S e n s o r T o w e r 78 CashWalk WeWard Sweatcoin Other Note: Other walk & Run Tracking Apps include Step Counter - Pedometer, Step Tracker - Pedometer, FitCloudPro, Pedometer - Step Counter
79.
Source: Sensor Tower Note:
iOS and Google Play combined. iOS only for China. Apps classified using Sensor Tower's taxonomy as of January 5, 2025. 2024RankingsbyMarket| Health & Fitness Download data AMER - Downloads Flo by Flo Health (Period Tracking) Planet Fitness Workouts (Gyms & Fitness) Yuka (Nutrition & Diet) Imss Digital (National Medical Service) Conecte SUS (National Medical Service) Sweatcoin (Gyms & Fitness) Health Tracker: BP Hub (Medical Tracking Apps) Yuka (Nutrition & Diet) AllTrails (Team Sports & Outdoor Recreation) Flo by Flo Health (Period Tracking) Flo by Flo Health (Period Tracking) FitPro (Gyms & Fitness) FitPro (Gyms & Fitness) MyChart (Telehealth) Flo by Flo Health (Period Tracking) FitPro (Gyms & Fitness) Health Tracker: BP Hub (Medical Tracking Apps) BetterMe: Workouts (Other Personal Health & Fitness) Sweatcoin (Gyms & Fitness) CVS Pharmacy (Pharmacies) Sleep Sounds Tracker: ShutEye (Meditation & Sleep Trackers) Health Tracker: BP Hub (Medical Tracking Apps) Drogasil (Pharmacies) Prestadores PAMI (National Medical Service) Home Workout - No Equipments (Gyms & Fitness) Flo by Flo Health (Period Tracking) Strava Running and Cycling (Gyms & Fitness) Farmacias Del Ahorro (Pharmacies) Cartão De Todos (Telehealth) Flo by Flo Health (Period Tracking) 1 2 3 4 5 Worldwide United States Canada Mexico Brazil Argentina S t a t e o f M o b i l e 2 0 2 5 C o p y r i g h t © S e n s o r T o w e r 79
80.
11 S t a t e o f M o b i l e 2 0 2 5 C o p y r i g h t © S e n s o r T o w e r 80 Sports Leveraging the most
popular events is the name of the game for Sports apps, from streaming to sports betting. Exclusive content can help you stand out in a competitive market.
81.
Worldwide 1 Rank Source: Sensor Tower Note:
iOS and Google Play combined. iOS only for China. Revenue is gross — inclusive of any percent taken by the app stores. Sports apps classified using Sensor Tower's taxonomy as of January 5, 2025. YearlyTrendsforSportsApps ConsumerSpendonSports AppsClimbsSteadily Sports app revenue on subscriptions and other in-app purchases has shown steady growth YoY as more companies place a growing emphasis on streaming niche sports and events to cater to diverse fan bases and promote inclusivity in sports viewership. Despite steady growth in revenue, sports apps are seeing a slowdown in downloads. A Sensor Tower analysis reveals that apps are struggling to grow downloads as streaming services vie for customers by offering live sports, potentially undermining league-specific apps. In 2024, new downloads for league-specific apps like the NHL fell by 26%, NFL by 17%, NBA by 9%, and MLB by 8% YoY. Sports Downloads IAPRevenue YoYGrowth YoYGrowth $1.6B $1.4B $1.2B $1B $0.8B $0.6B $0.4B $0.2B 0 2019 2020 2021 2022 2023 2024 60% 40% 20% 0 2019 2020 2021 2022 2023 2024 1B 0.8B 0.6B 0.4B 0.2B 0 2019 2020 2021 2022 2023 2024 40% 20% 0 2019 2020 2021 2022 2023 2024 S t a t e o f M o b i l e 2 0 2 5 C o p y r i g h t © S e n s o r T o w e r 81
82.
Worldwide 1 Rank Source: Sensor Tower Note:
iOS and Google Play combined. iOS only for China. Sports apps classified using Sensor Tower's taxonomy as of January 5, 2025. SportsDownloadTrendsbySubgenre SportsBettingApps ContinuedTheirClimbin theUS Sports TopAppsbyDownloadsin2024 QuarterlyDownloadsbySubgenre 0 20M 40M 60M 80M 100M 120M 140M 160M 180M 200M 220M 240M 260M 280M 2 0 2 1 Q 1 2 0 2 1 Q 2 2 0 2 1 Q 3 2 0 2 1 Q 4 2 0 2 2 Q 1 2 0 2 2 Q 2 2 0 2 2 Q 3 2 0 2 2 Q 4 2 0 2 3 Q 1 2 0 2 3 Q 2 2 0 2 3 Q 3 2 0 2 3 Q 4 2 0 2 4 Q 1 2 0 2 4 Q 2 2 0 2 4 Q 3 2 0 2 4 Q 4 Sports Entertainment Sports Betting Fantasy Sports Dream11 Fantasy Sports My11Circle Fantasy Sports Olympics Sports Entertainment Flashscore Sports Entertainment ESPN Sports Entertainment Sofascore Sports Entertainment DAZN Sports Entertainment Cricbuzz Sports Entertainment FanCode Sports Entertainment 365Scores Sports Entertainment 1 2 3 4 5 6 7 8 9 10 App Subgenre Sports Entertainment maintained a wide lead over Sports Betting and Fantasy Sports in terms of global downloads. Sports Entertainment includes apps for sports streaming, news & scores, and various league apps. Unsurprisingly, demand for top Sports apps can fluctuate wildly depending on the timing of different events and seasons. For example, Sports app downloads in India rely heavily on the cricket schedule, and downloads in France surged during the Paris Olympics. Sports Betting app downloads in the US have only gained momentum since sports betting was legalized, climbing 19% YoY to reach 44 million in 2024. And the space is only getting more competitive — another major player entered the market in late 2023 with the launch of ESPN BET. In 2024, 12 different Sports Betting / Daily Fantasy apps had at least one million US downloads. HowDidTopAppsLeveragetheOlympics? Want to learn more about how top players strategize around the world's biggest sporting events? Check out our blog covering the Paris Summer Olympics. S t a t e o f M o b i l e 2 0 2 5 C o p y r i g h t © S e n s o r T o w e r 82
83.
Source: Sensor Tower Note:
Downloads on iOS and Google Play combined. Ad impressions estimates as of January 5, 2025. Includes ads on connected TVs, streaming devices (e.g., Apple TV, PlayStation, Roku), and desktop and mobile devices. CumulativeUnitedStatesDownloadsForSportsBettingAppsSince2020 SportsBetting2024Ads: RidingtheNFLWave To leverage the NFL's vast viewership in 2024, leading Sports Betting apps FanDuel and DraftKings significantly ramped up their marketing efforts around NFL content. Their NFL ad impression shares increased by 3 and 10 percentage points (ppts) on average from 2023, respectively, reaching 67% for FanDuel and 80% for DraftKings. BetMGM shifted its advertising strategy in 2024, reducing its NFL focus to better engage NBA and MLB fans. This change led to a 36 ppt drop in NFL ad impressions, while NBA and MLB impressions grew by 15 and 13 ppts, respectively. This pivot underscores BetMGM's aim to diversify its audience and tap into the rising interest in basketball and baseball. Sports ShareofAdImpressionsbySportforTopSportsBettingApps United States FanDuel Sportsbook & Casino DraftKings Sportsbook & Casino PrizePicks BetMGM DraftKings Fantasy Sports Underdog Fantasy Sports FanDuel Fantasy Sports Caesars Sportsbook ESPN BET Sportsbook Hard Rock Bet 0 2M 4M 6M 8M 10M 12M 14M 16M 18M 20M 22M 24M 26M Dec-2024 2023 2024 100% 80% 60% 40% 20% 0% FanDuel DraftKings BetMGM Hard Rock Bet bet365 Caesars 64% 64% 64% 29% 29% 29% 70% 70% 70% 25% 25% 25% 67% 67% 67% 29% 29% 29% 100% 100% 100% 54% 54% 54% 41% 41% 41% 54% 54% 54% 13% 13% 13% 24% 24% 24% NFL NBA MLB NHL UncovertheLatestMarketingStrategies Pathmatics by Sensor Tower lets you track the latest digital advertising trends for sports betting apps. Discover which ad channels top apps are prioritizing and how creative strategies are evolving. S t a t e o f M o b i l e 2 0 2 5 C o p y r i g h t © S e n s o r T o w e r 83
84.
Source: Sensor Tower Note:
Downloads on iOS and Google Play combined. Share of voice across iOS and Google Play combined among mobile app advertisers on each ad network. MonthlyShareofSportsBettingAppDownloadsfromPaidAds United States ESPNBET'sMeteoric Risein2024 Launched in November 2023, ESPN BET quickly gained users and high engagement, with average MAUs surpassing most Sports Betting apps, trailing only behind industry leaders DraftKings and FanDuel. This success is partly due to its investment in mobile ad networks. In 2024, 16% of ESPN BET's downloads were paid, in contrast to FanDuel's 6%, which relied more on word-of-mouth and its long-established position as a leader in the space. Social media advertising on platforms like Facebook, Instagram, and Snapchat has been crucial to ESPN BET's early success in sports betting. Strong share of voice (SOV) correlations with downloads—0.84 for Snapchat, 0.73 for Facebook, and 0.73 for Instagram—indicate that targeted ads on these platforms significantly drove download growth. Sports ESPNBETWeeklyDownloadsvs.AdvertisingShareofVoice(SOV)AcrossTopSocialNetworks United States 0 5% 10% 15% 20% 25% Jan 2024 Feb 2024 Mar 2024 Apr 2024 May 2024 Jun 2024 Jul 2024 Aug 2024 Sep 2024 Oct 2024 Nov 2024 Dec 2024 ESPN BET DraftKings Sportsbook & Casino BetMGM Caesars Sportsbook bet365 FanDuel Sportsbook & Casino 0 30K 60K 90K 120K 0 0.25% 0.50% 0.75% 1.00% 3 1 - D e c - 2 0 2 3 1 4 - J a n - 2 0 2 4 2 8 - J a n - 2 0 2 4 1 1 - F e b - 2 0 2 4 2 5 - F e b - 2 0 2 4 1 0 - M a r - 2 0 2 4 2 4 - M a r - 2 0 2 4 7 - A p r - 2 0 2 4 2 1 - A p r - 2 0 2 4 5 - M a y - 2 0 2 4 1 9 - M a y - 2 0 … 2 - J u n - 2 0 2 4 1 6 - J u n - 2 0 2 4 3 0 - J u n - 2 0 2 4 1 4 - J u l - 2 0 2 4 2 8 - J u l - 2 0 2 4 1 1 - A u g - 2 0 2 4 2 5 - A u g - 2 0 2 4 8 - S e p - 2 0 2 4 2 2 - S e p - 2 0 2 4 6 - O c t - 2 0 2 4 2 0 - O c t - 2 0 2 4 3 - N o v - 2 0 2 4 1 7 - N o v - 2 0 … 1 - D e c - 2 0 2 4 1 5 - D e c - 2 0 2 4 2 9 - D e c - 2 0 2 4 D o w n l o a d s S h a r e o f V o i c e Facebook SOV Instagram SOV Snapchat SOV YouTube SOV ESPN BET Downloads IsYourCompetitors'GrowthPaidorOrganic? Want to see what share of downloads are from paid vs. organic channels in your space? Sensor Tower customers can try it out for themselves here! Not a customer? Request a demo to see how Sensor Tower data can help your business. S t a t e o f M o b i l e 2 0 2 5 C o p y r i g h t © S e n s o r T o w e r 84
85.
Source: Sensor Tower Note:
iOS and Google Play combined. iOS only for China. Apps classified using Sensor Tower's taxonomy as of January 5, 2025. 2024RankingsbyMarket| Sports Download data AMER - Downloads Dream11 (Fantasy Sports) ESPN (Sports Entertainment) Sportsnet (Sports Entertainment) Caliente Sports (Sports Betting) The Olympics (Sports Entertainment) Copa America Panini Collection (Sports Entertainment) My11Circle (Fantasy Sports) FanDuel Sportsbook (Sports Betting) bet365 Sports (Sports Betting) The Olympics (Sports Entertainment) Sportingbet Livescore Oficial (Sports Entertainment) Incorrecto (Sports Entertainment) The Olympics (Sports Entertainment) fuboTV: Stream Live Sports (Sports Entertainment) TSN GO (Sports Entertainment) Caliente TV (Sports Entertainment) 365Scores (Sports Entertainment) Tv argentina futbol en vivo (Sports Entertainment) FlashScore (Sports Entertainment) DraftKings Sportsbook & Casino (Sports Betting) FanDuel Sportsbook (Sports Betting) betmexico.mx (Sports Betting) FlashScore (Sports Entertainment) The Olympics (Sports Entertainment) ESPN (Sports Entertainment) PrizePicks (Sports Betting) The Olympics (Sports Entertainment) Playdoit (Sports Betting) FFF DA HORA 4.5 (Sports Entertainment) tv argentina en vivo futbol (Sports Entertainment) 1 2 3 4 5 Worldwide United States Canada Mexico Brazil Argentina S t a t e o f M o b i l e 2 0 2 5 C o p y r i g h t © S e n s o r T o w e r 85
86.
12 S t a t e o f M o b i l e 2 0 2 5 C o p y r i g h t © S e n s o r T o w e r 86 TopApps andGames See the mobile
leaders by downloads, IAP revenue, and monthly active users in 2024 across 20+ markets At CrazyLabs, we successfully embraced our transition to hybrid-casual gaming, aligning with evolving market trends. This strategic shift enabled us to craft more engaging player experiences while developing a robust pipeline of innovative titles. Our multiple successful game launches this year demonstrate our team's agility and dedication to delivering compelling content that resonates with today's players. SagiSchliesser CEO & Founder Crazy Labs
87.
Source: Sensor Tower Note:
iOS and Google Play combined. iOS only for China. Apps classified using Sensor Tower's taxonomy as of January 5, 2025. 2024RankingsbyMarket| Top Apps Worldwide App Name Change Taxonomy App Name Change Taxonomy App Name Change Taxonomy 1 Instagram Social Media 1 TikTok Social Media 1 YouTube Social Media 2 TikTok Social Media 2 YouTube Social Media 2 Chrome Browser Browsers 3 WhatsApp Messenger Social Messaging 3 Google One Cloud Storage 3 Facebook Social Media 4 Facebook Social Media 4 Disney+ Film & Television Streaming 4 WhatsApp Messenger Social Messaging 5 Temu Shopping 5 Tinder Dating 5 Google Browsers 6 CapCut Video Editing 6 Tencent Video Film & Television Streaming 6 Instagram Social Media 7 Telegram Social Messaging 7 Max: Stream HBO, TV, & Movies Film & Television Streaming 7 Gmail Email 8 Threads Social Media 8 iQIYI Film & Television Streaming 8 TikTok Social Media 9 Spotify Music & Podcasts 9 LinkedIn Jobs & Education 9 Facebook Messenger Social Messaging 10 ChatGPT AI Chatbots 10 Bumble App Dating 10 Google Photos Photo Galleries DOWNLOADS IAP REVENUE MONTHLY ACTIVE USERS S t a t e o f M o b i l e 2 0 2 5 C o p y r i g h t © S e n s o r T o w e r 87
88.
Source: Sensor Tower Note:
iOS and Google Play combined. iOS only for China. Apps classified using Sensor Tower's game taxonomy as of January 5, 2025. 2024RankingsbyMarket| Top Games S t a t e o f M o b i l e 2 0 2 5 C o p y r i g h t © S e n s o r T o w e r 88 Worldwide App Name Change Taxonomy App Name Change Taxonomy App Name Change Taxonomy 1 Free Fire Shooter | Battle Royale 1 MONOPOLY GO! Casino | Coin Looters 1 ROBLOX Simulation | Sandbox 2 ROBLOX Simulation | Sandbox 2 Honor of Kings Strategy | MOBA 2 Free Fire Shooter | Battle Royale 3 Block Blast Adventure Master Puzzle | Block 3 Royal Match Puzzle | Match Swap 3 Subway Surfers Arcade | Platformer / Runner 4 Subway Surfers Arcade | Platformer / Runner 4 ROBLOX Simulation | Sandbox 4 EA SPORTS FC™ MOBILE Sports | Realistic Sports 5 Ludo King Tabletop | Board 5 Last War:Survival Game Strategy | 4X Strategy 5 Brawl Stars Strategy | MOBA 6 Pizza Ready Simulation | Time Management 6 Candy Crush Saga Puzzle | Match Swap 6 Clash of Clans Strategy | Build & Battle 7 Offline Games - No Wifi Games Arcade | Other Arcade 7 Whiteout Survival Strategy | 4X Strategy 7 Clash Royale Strategy | Real-Time Strategy 8 PUBG MOBILE Shooter | Battle Royale 8 Coin Master Casino | Coin Looters 8 Mobile Legends: Bang Bang Strategy | MOBA 9 Royal Match Puzzle | Match Swap 9 Dungeon & Fighter Mobile Action | Beat 'em Up 9 PUBG MOBILE Shooter | Battle Royale 10 My Talking Tom 2 Lifestyle | Virtual Pet 10 Game For Peace Shooter | Battle Royale 10 Pokémon GO Geolocation | Geolocation DOWNLOADS IAP REVENUE MONTHLY ACTIVE USERS
89.
Source: Sensor Tower
App Performance Insights as of January 5, 2025. Note: iOS and Google Play combined. iOS only for China. 2024RankingsbyMarket| Top Publishers - Apps S t a t e o f M o b i l e 2 0 2 5 C o p y r i g h t © S e n s o r T o w e r 89 Worldwide Publisher Change Top Apps by Downloads Publisher Change Top Apps by IAP Revenue 1 Meta Platforms (formerly Facebook, Inc.) Instagram 1 Bytedance TikTok 2 Google, Inc. YouTube 2 Google, Inc. YouTube 3 Bytedance TikTok 3 Disney Disney+ 4 Microsoft Corporation Microsoft Teams 4 Tencent Tencent Video 5 Amazon Mobile LLC Amazon 5 Match Group, LLC Tinder 6 Temu Temu 6 Amazon Mobile LLC Audible 7 Telegram LLC Telegram 7 Warner Bros. Discovery Max: Stream HBO, TV, & Movies 8 Alibaba AliExpress 8 Microsoft Corporation LinkedIn 9 QR Code Scanner. PDF Reader by QR Code Scanner 9 NAVER Corporation LINE Manga 10 InShot Inc. InShot - Video Editor 10 Bumble Holding Limited Bumble App DOWNLOADS IAP REVENUE
90.
Source: Sensor Tower
App Performance Insights as of January 5, 2025. Note: iOS and Google Play combined. iOS only for China. 2024RankingsbyMarket| Top Publishers - Games S t a t e o f M o b i l e 2 0 2 5 C o p y r i g h t © S e n s o r T o w e r 90 Worldwide Publisher Change Top Apps by Downloads Publisher Change Top Apps by IAP Revenue 1 Azur Interactive Games Limited WormsZone.io 1 Tencent Honor of Kings 2 SUPERSONIC STUDIOS LTD Build A Queen 2 Scopely MONOPOLY GO! 3 SayGames My Perfect Hotel 3 Activision Blizzard Candy Crush Saga 4 Miniclip.com Subway Surfers 4 Playrix Gardenscapes by Playrix 5 iKame Screw Puzzle: Nuts & Bolts 5 NetEase Nishuihan 6 voodoo Hole.io 6 Supercell Brawl Stars 7 Outfit7 My Talking Tom 2 7 Dream Games, Ltd. Royal Match 8 Embracer Group Phone Case DIY 8 Take-Two Interactive Toon Blast 9 BabyBus Group Baby Panda's School Bus 9 Playtika LTD BINGO Blitz 10 ABI Games Studio Wood Nuts & Bolts Puzzle 10 miHoYo Honkai: Star Rail DOWNLOADS IAP REVENUE
91.
S t a t e o f M o b i l e 2 0 2 5 C o p y r i g h t © S e n s o r T o w e r 91 Among Brazilian retailers,
Magalu has the largest app, offering a seamless experience with exclusive purchasing conditions, a broad seller base, and a complete ecosystem, including payments, insurance, media ads, content, and an affiliate platform. Sensor Tower is essential for benchmarking and market data, enabling us to identify opportunities, innovate, and maintain competitiveness. In the fast-paced gaming ecosystem, understanding the competitive landscape is key to success. SensorTower empowers us to uncover creative trends, analyze competitors’ strategies, and monitor market dynamics. Whether launching a new title or optimizing an existing one, it provides invaluable insights to evaluate performance, amplify strengths, and unlock new growth opportunities. Our company continues to achieve significant success in both product development and marketing by embracing data-driven approaches. This commitment has allowed us to refine strategies, enhance key performance metrics, and swiftly adapt to evolving market trends. For example, experiments in User Acquisition have optimized campaign efficiency and supported effective scaling. Tools like SensorTower, combined with our advanced internal analytics solutions, enable us to uncover new opportunities and drive sustainable growth in the highly competitive mobile market. GabrieladeSousa Acquisition Lead Magalu ViktoriyaIvanova UA Lead Wargaming DmitrySeverinets Head of Marketing Analytics, Co-CMO Vizor CustomerTestimonials
92.
S t a t e o f M o b i l e 2 0 2 5 C o p y r i g h t © S e n s o r T o w e r 92 As Fortune Mine
Games, we are a data-obsessed startup, and data fuels everything we do. While we gather vast insights within our domain, Sensor Tower provides a powerful external lens, helping us evaluate our impact, align with product-market fit, and uncover emerging trends ripe for innovation. At AdQuantum, we specialize in scaling mobile applications and web products, helping our clients achieve outstanding results through effective performance marketing strategies. Access to accurate data and analytics plays a critical role in an increasingly competitive and privacy-first landscape. Sensor Tower provides us with valuable insights into market trends, user behavior, data on ad creatives, and app metrics across various verticals. These insights empower us to optimize advertising campaigns, enhance their efficiency, and drive sustainable growth for our partners across both mobile and web segments. Hybrid casual is revolutionizing mobile gaming by blending the best of all game categories: the marketability and sticky core mechanics of hypercasual games with the deep systems of progression and live operations from casual and midcore genres. Only a few years after Homa co-designed the foundation of this category’s definition and pillars with SensorTower, we’ve seen the hybrid casual category accelerate significantly in terms of new launches and revenue in 2024. SensorTower has been instrumental in helping us identify and structure this emerging category, solidifying our position as a leading player while enabling us to adapt our strategies to continue driving innovation and delivering compelling gaming experiences. DenizKorzay CEO Fortune Mine Games PavelBelov Account Director AdQuantum OlivierLeBas Co-founder Homa CustomerTestimonials
94.
AboutSensorTower SensorToweristheleadingsourceofmobileapp,digital advertising,retailmedia,andaudienceinsightsforthelargest brandsandapppublishersacrosstheglobe. Withamissiontomeasuretheworld’sdigitaleconomy,Sensor Tower’saward-winningplatformdeliversunmatchedvisibilityinto themobileappanddigitalecosystem,empoweringorganizations tostayaheadofchangingmarketdynamicsandmakeinformed, strategicdecisions. Foundedin2013,SensorTower’smobileappinsightshave helpedmarketers,app,andgamedevelopersdemystifythe mobileapplandscapewithvisibilityintousage,engagement,and paidacquisitionstrategies.Today,SensorTower’sdigitalmarket insightsplatformhasexpandedtoincludeAudience,RetailMedia, andPathmaticsDigitalAdvertisingInsights,helpingbrandsand advertisersunderstandtheircompetitor’sadvertisingstrategies andaudiencesacrossweb,social,andmobile. PressInquiries:press@sensortower.com S t a t e o f M o b i l e 2 0 2 5 C o p y r i g h t © S e n s o r T o w e r 94
95.
InterestedinourDigital MarketInsightsSolutions? If you want
to learn more about Sensor Tower, please request a demo: Get the latest insights on our blog: sensortower.com/blog Requestafreedemo!
Download