Download as PDF, PPTX
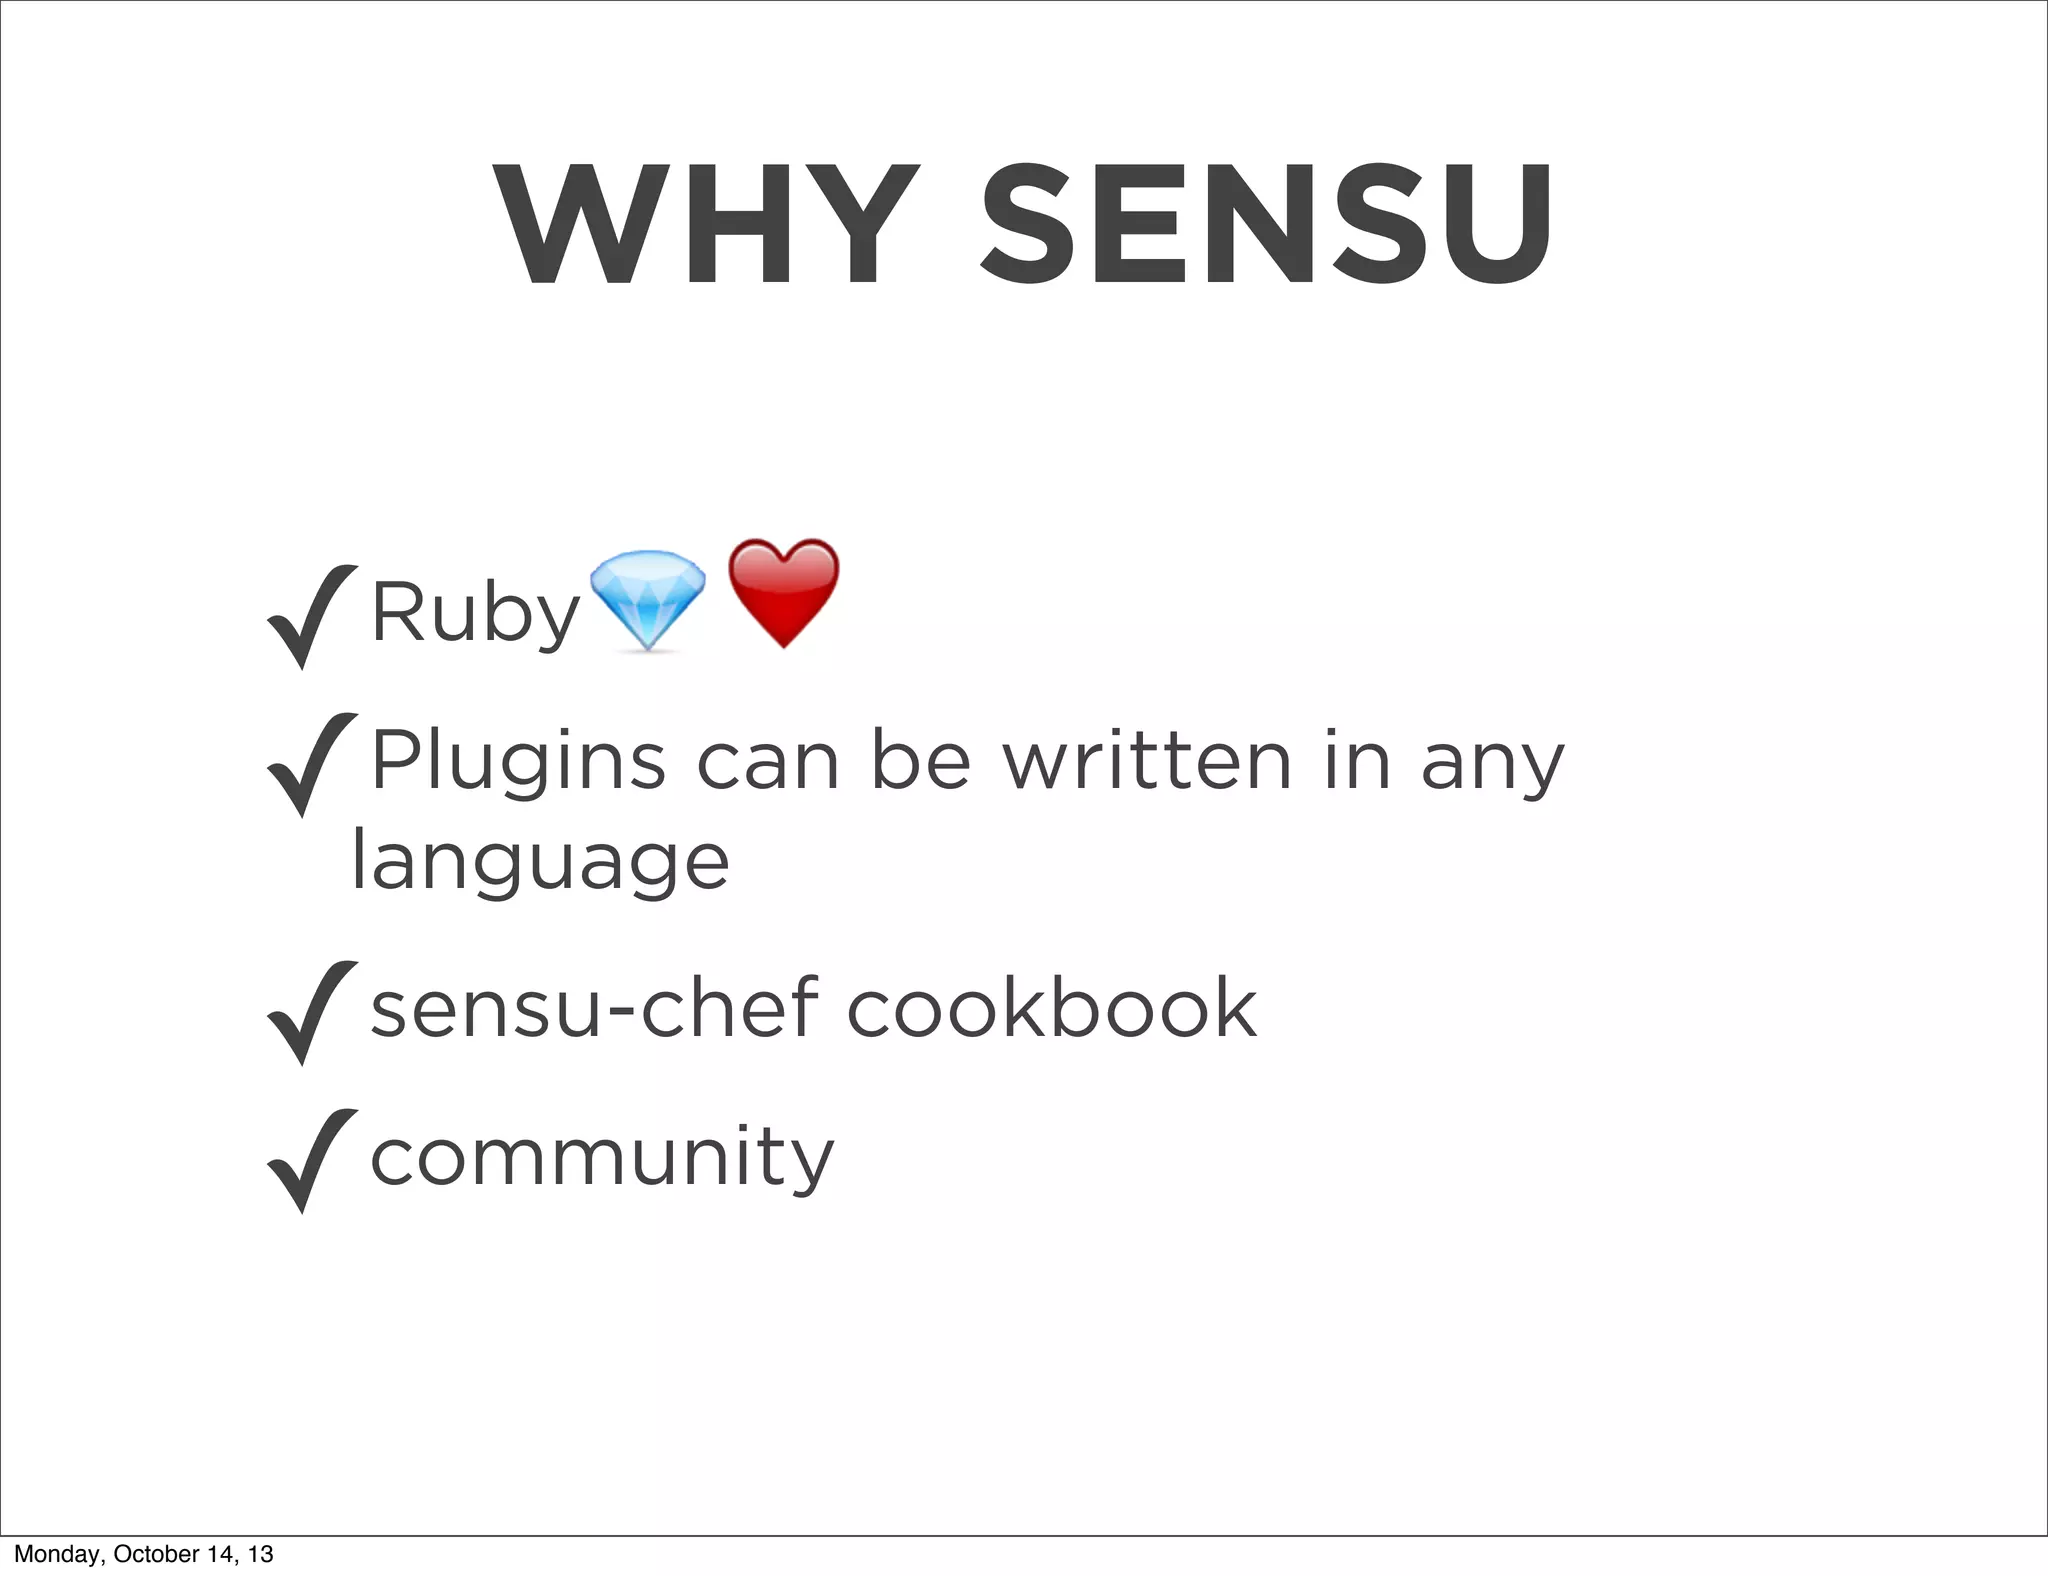
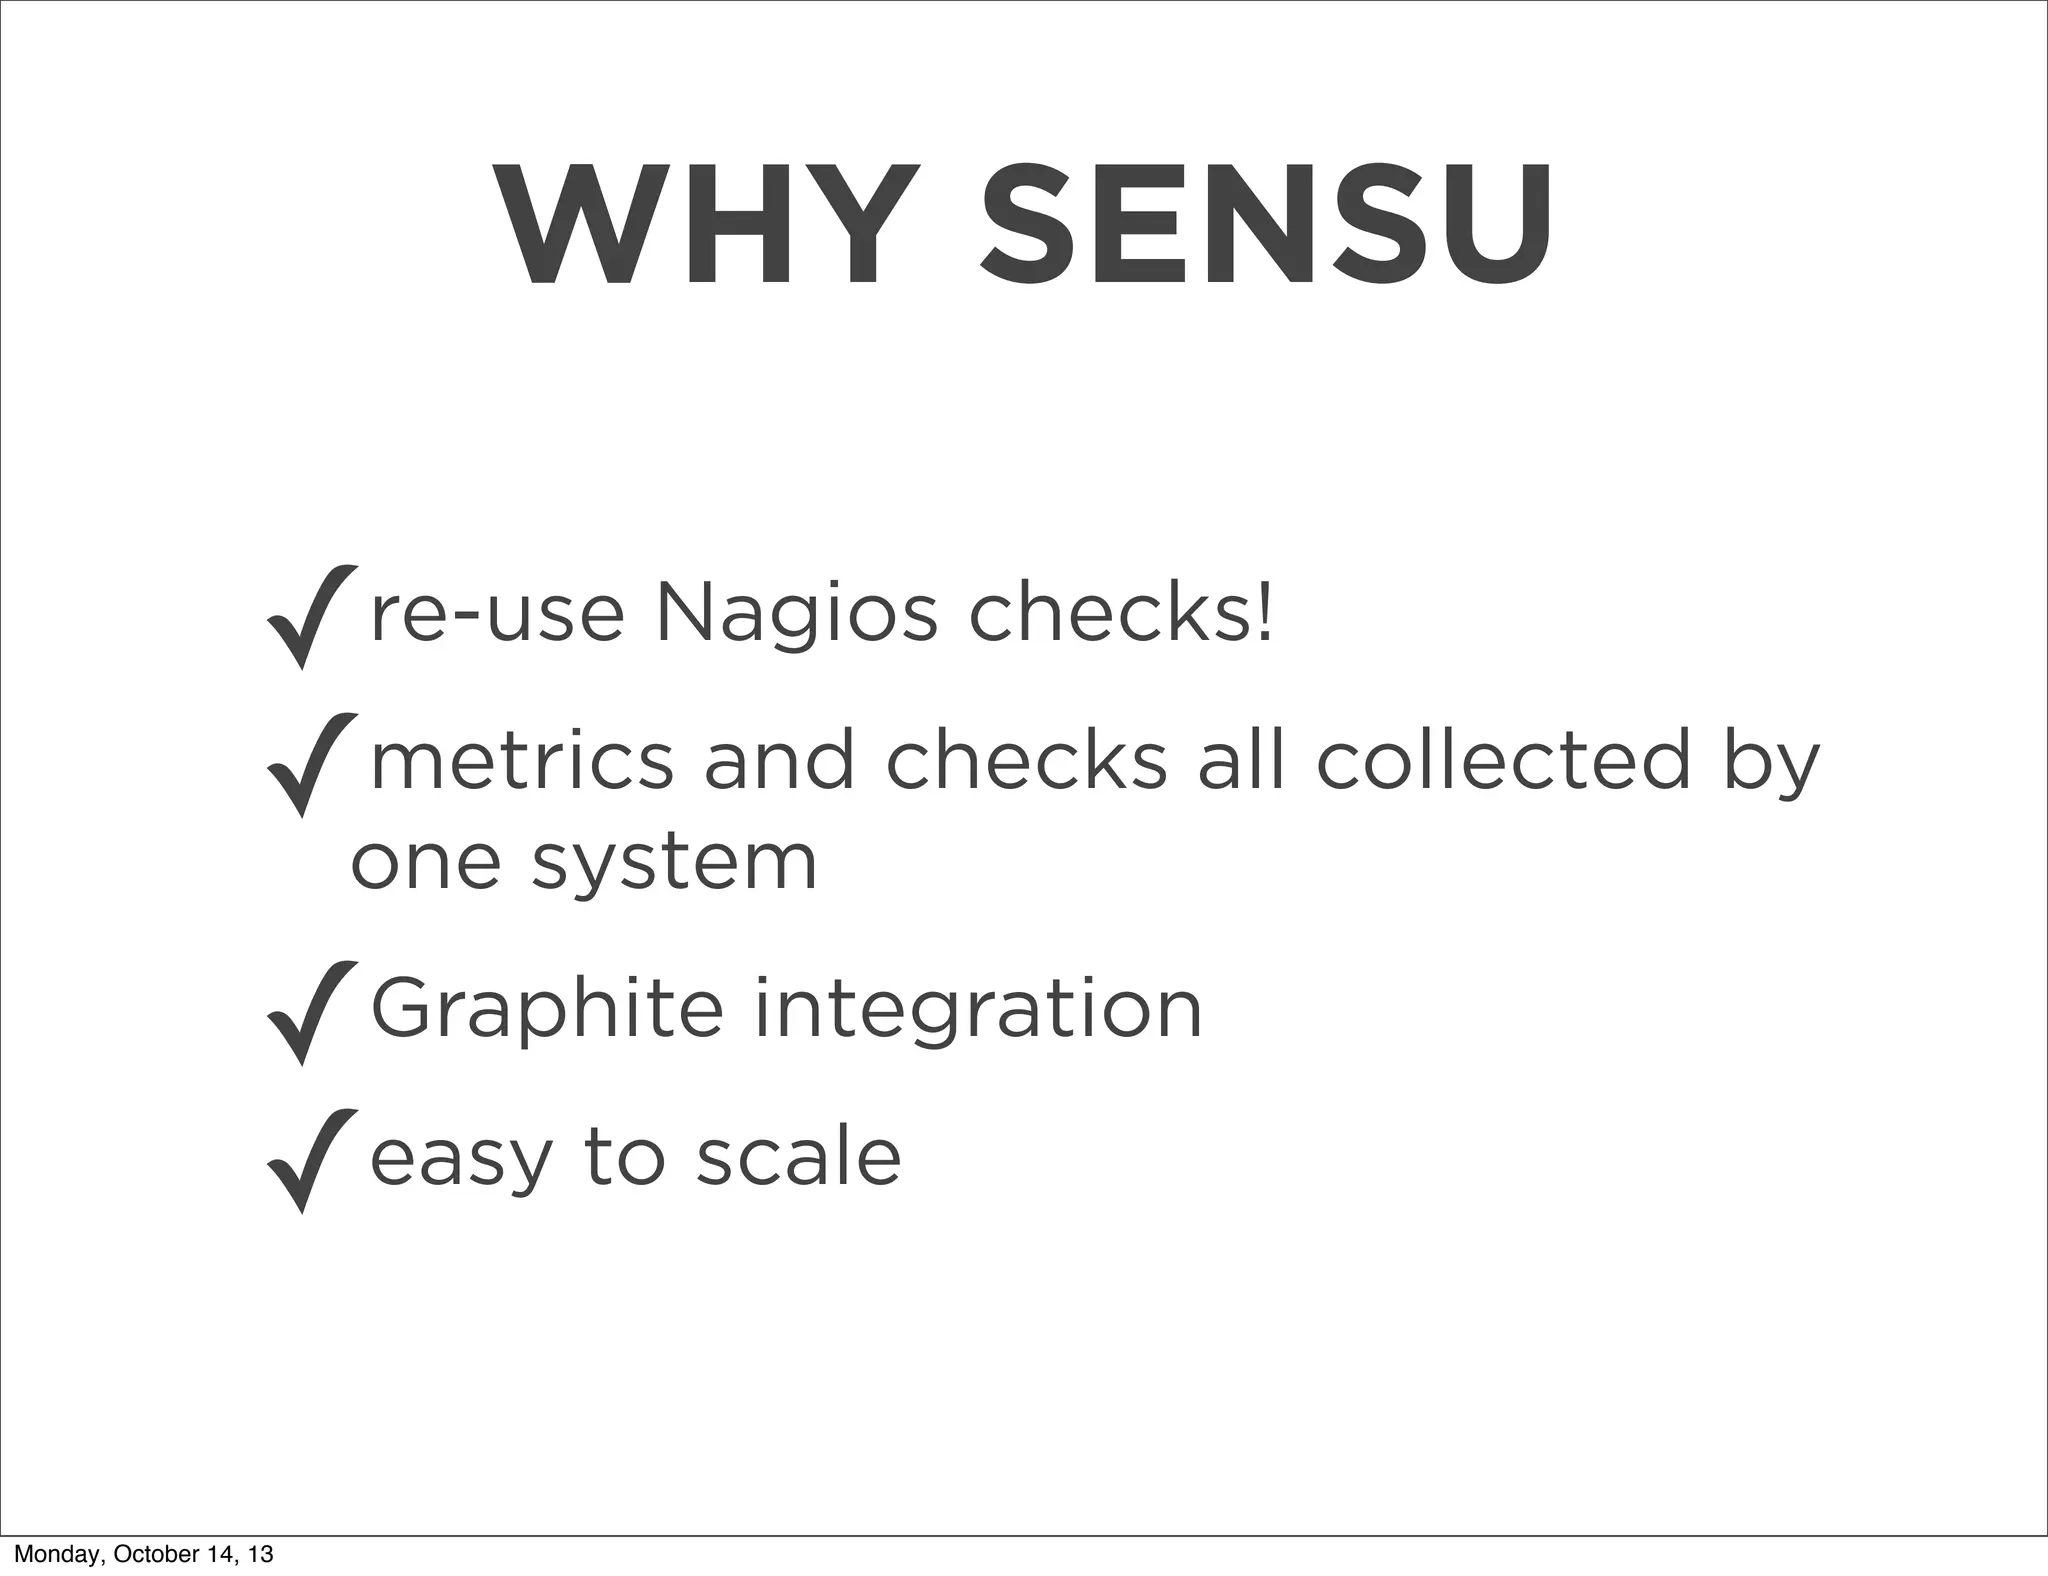

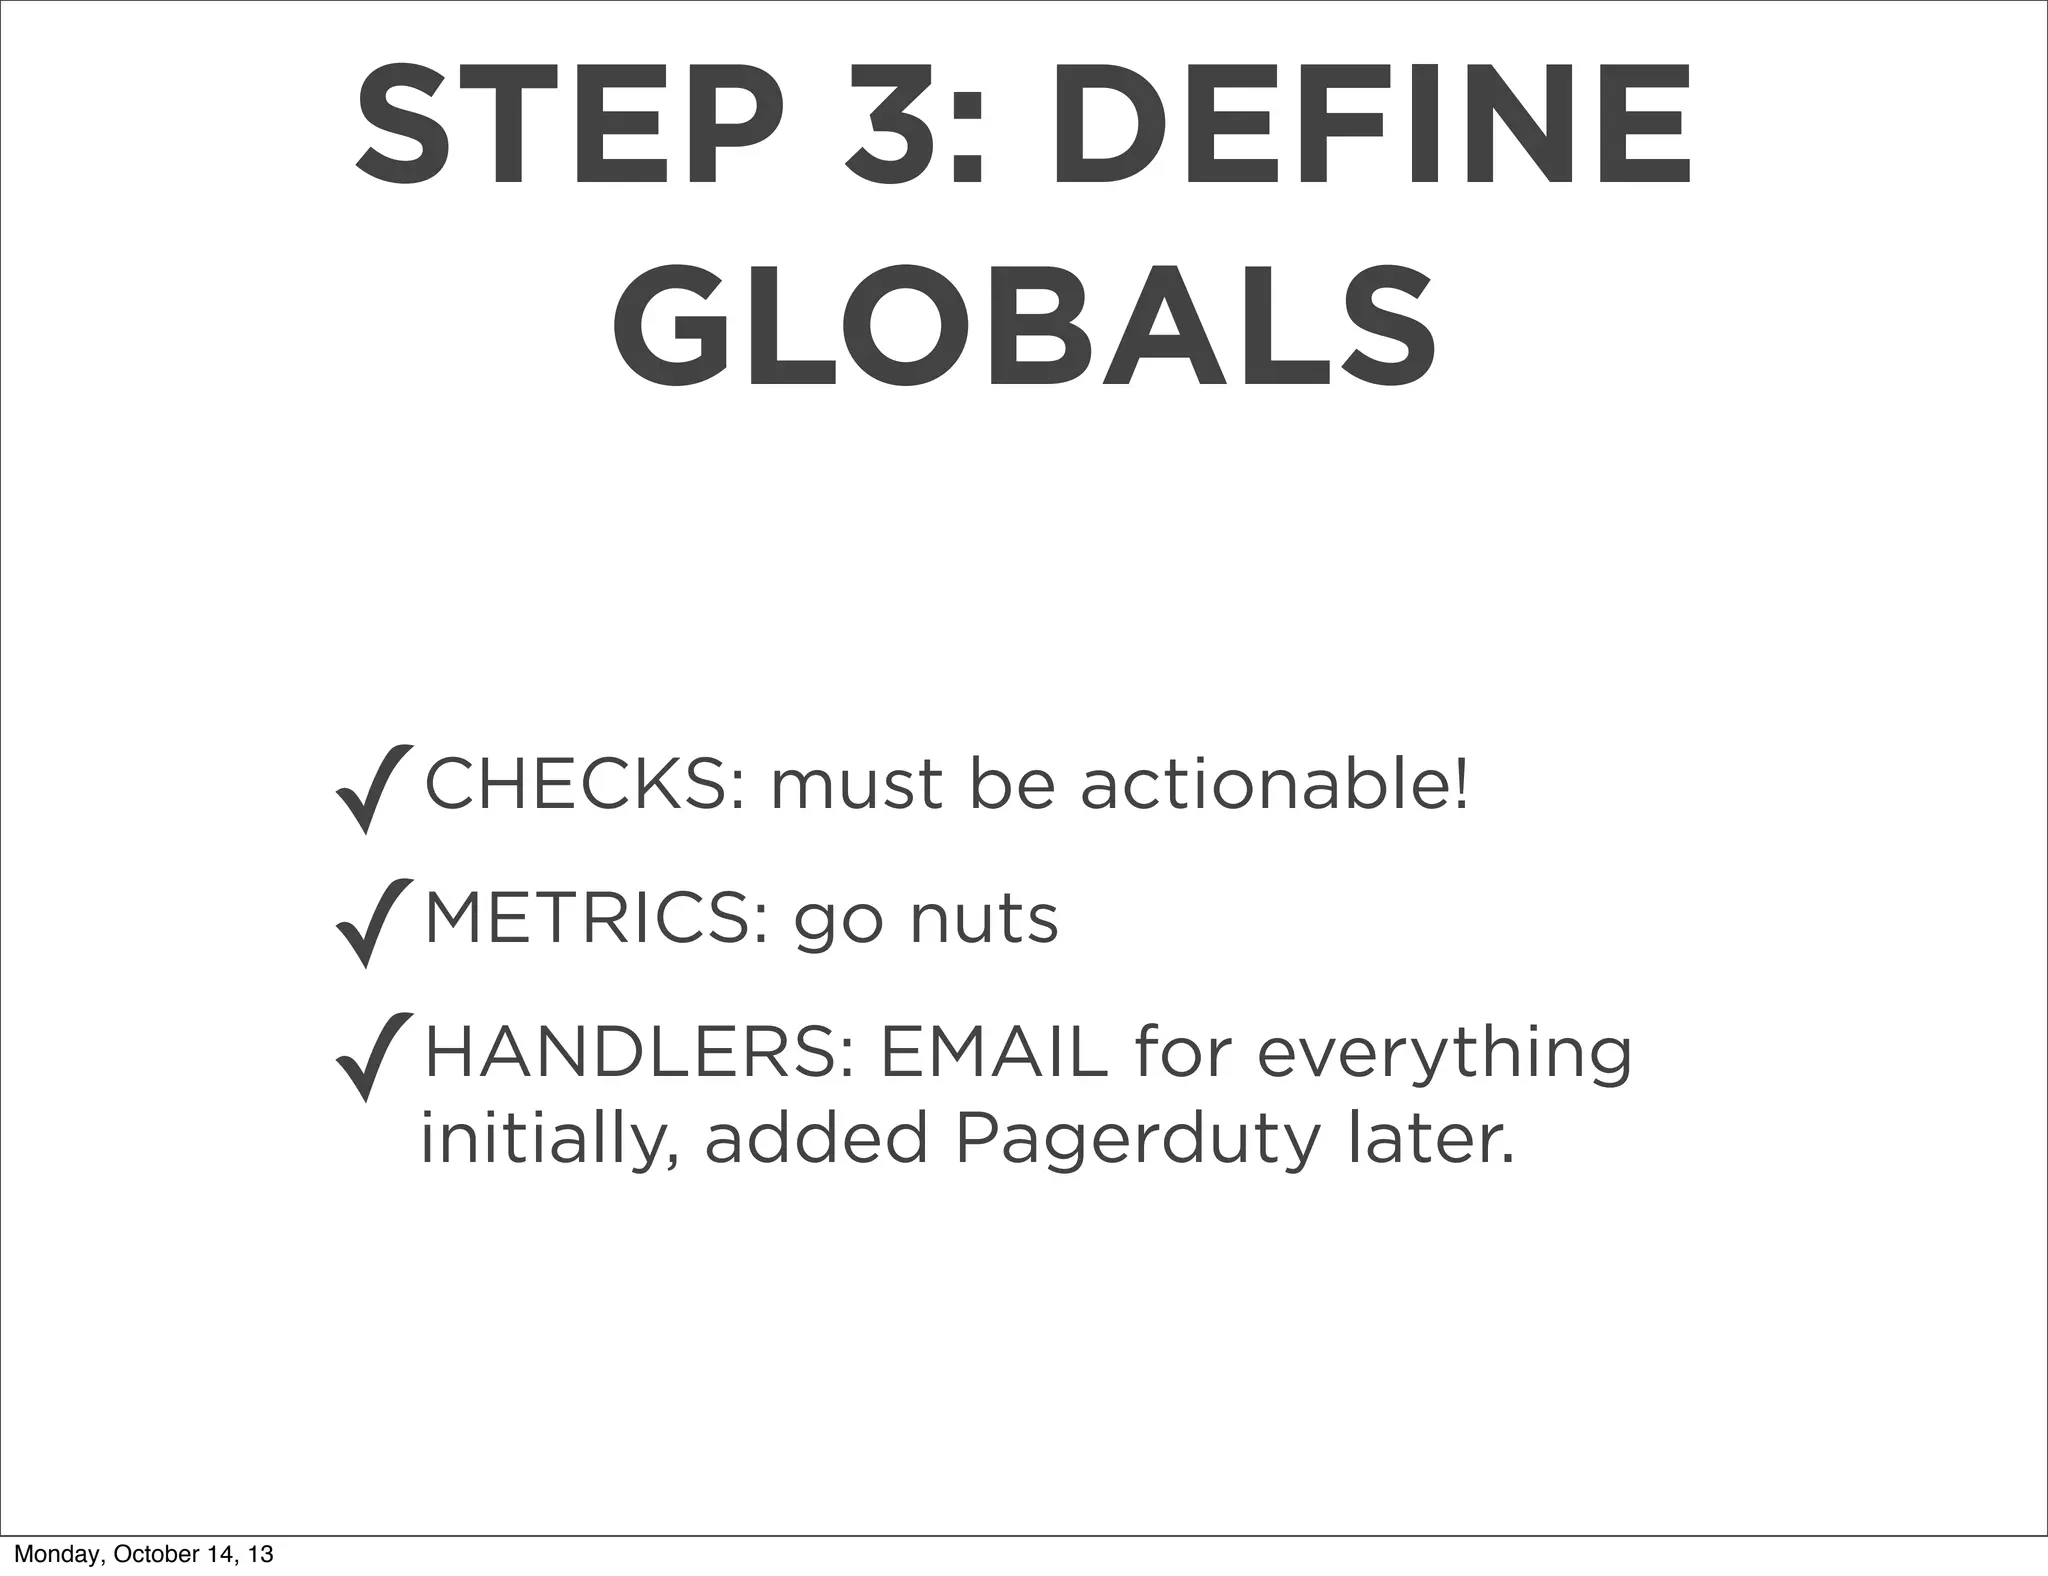
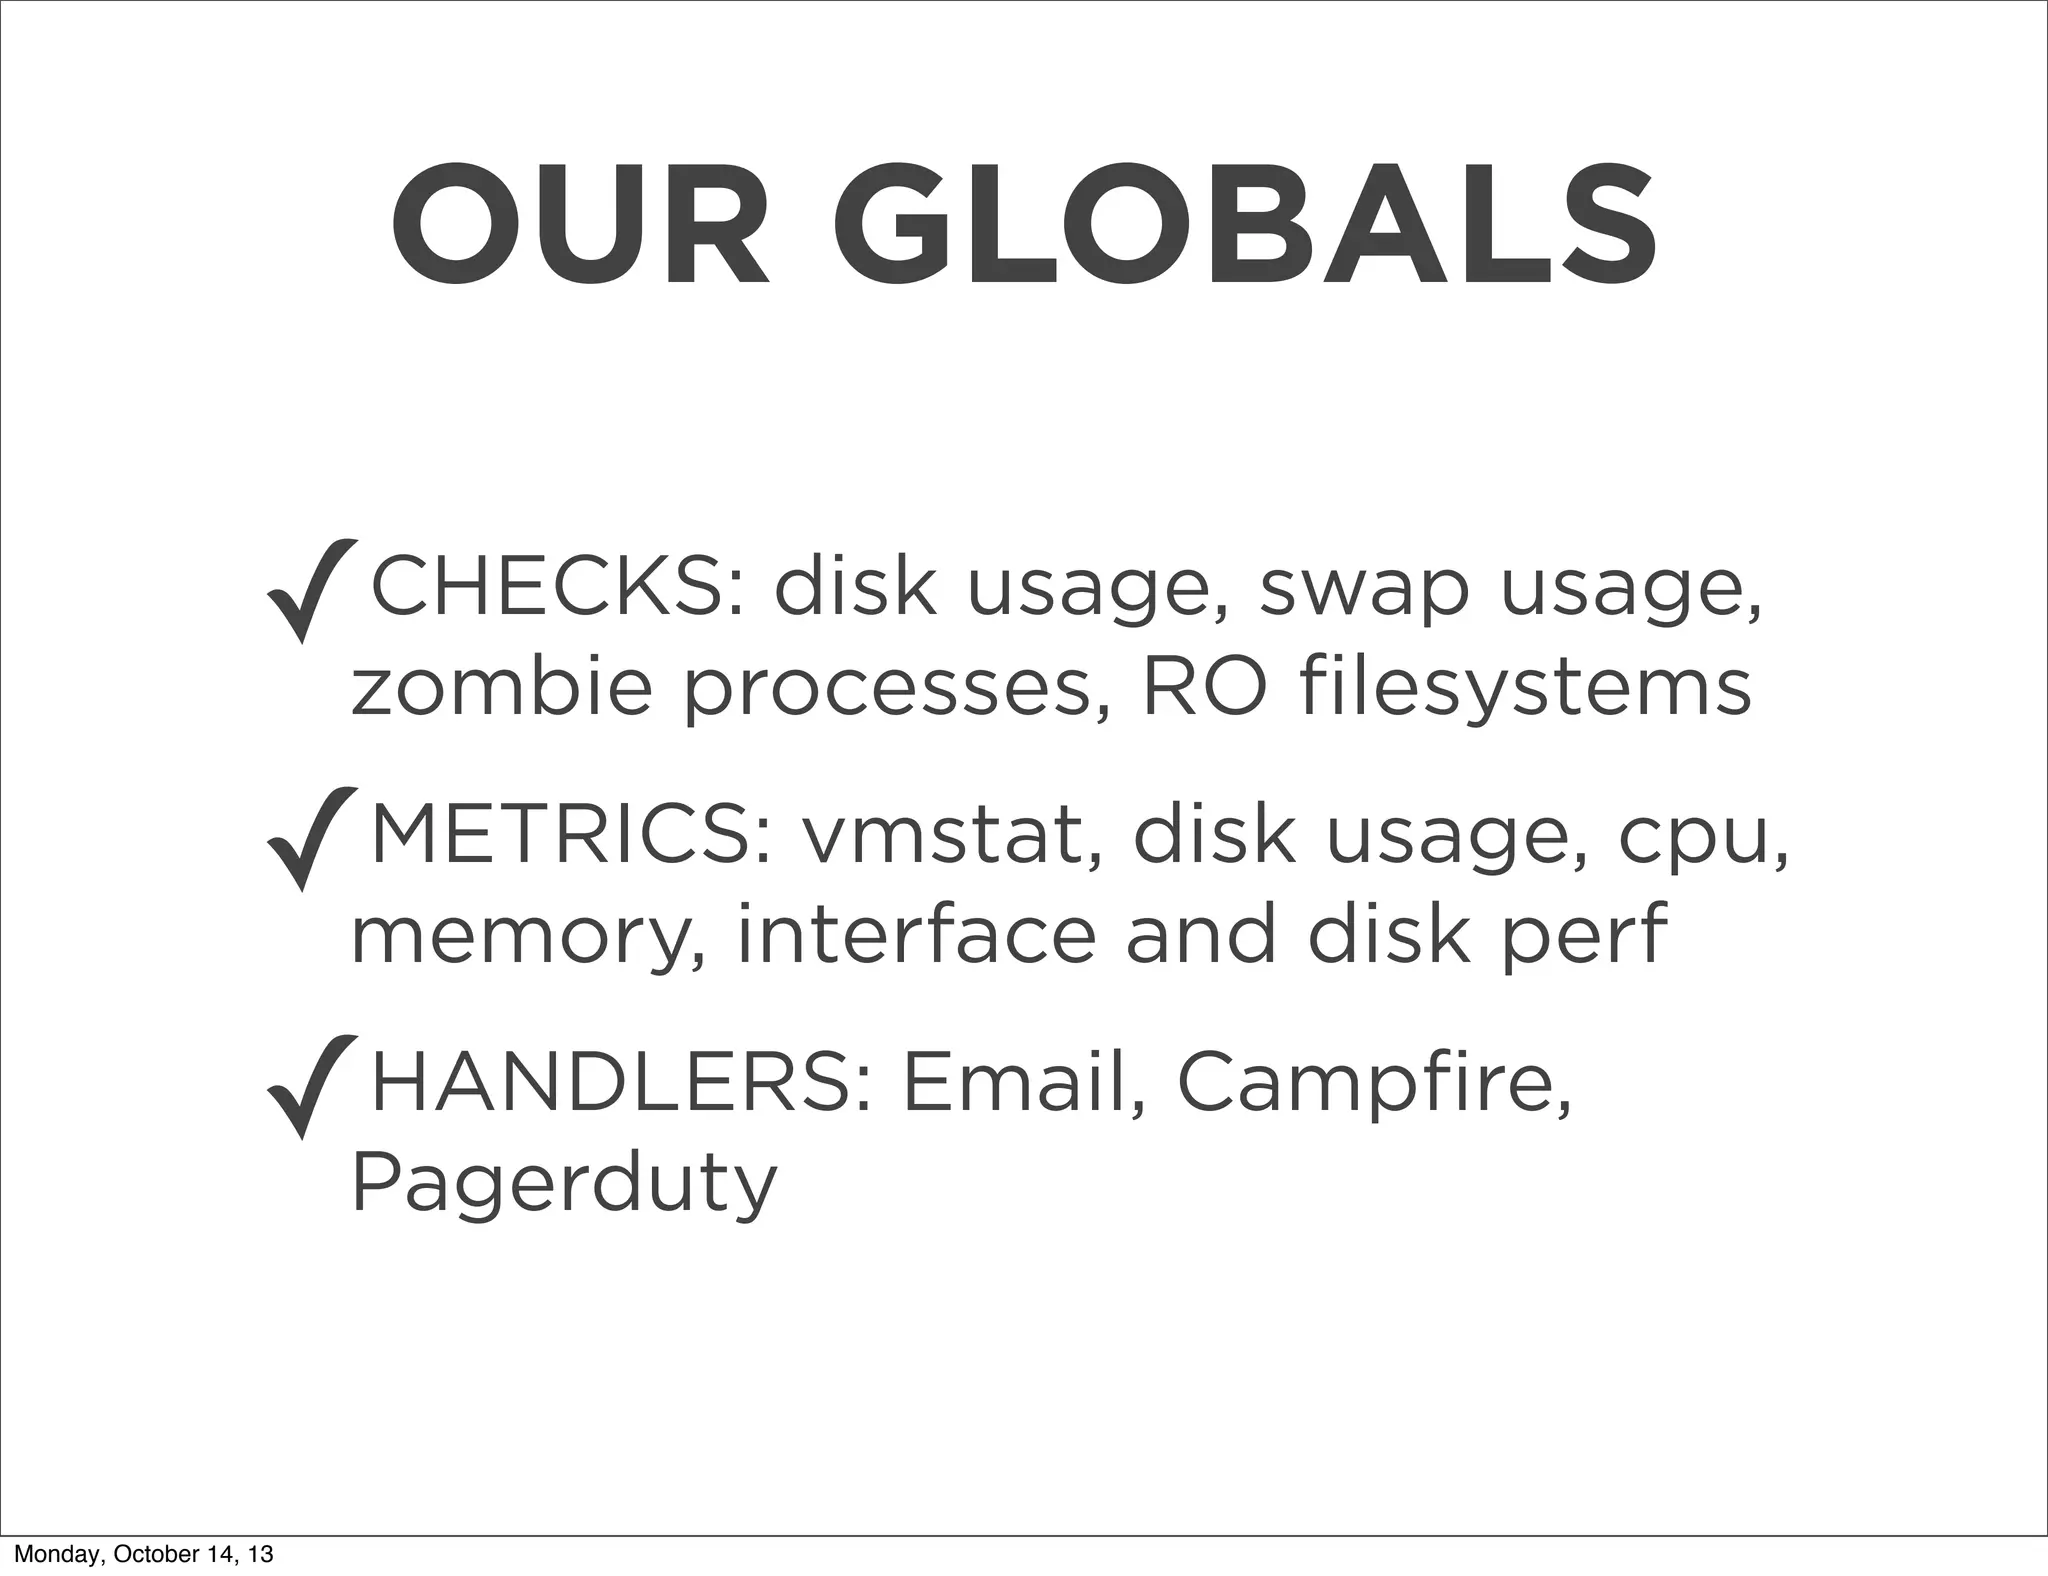
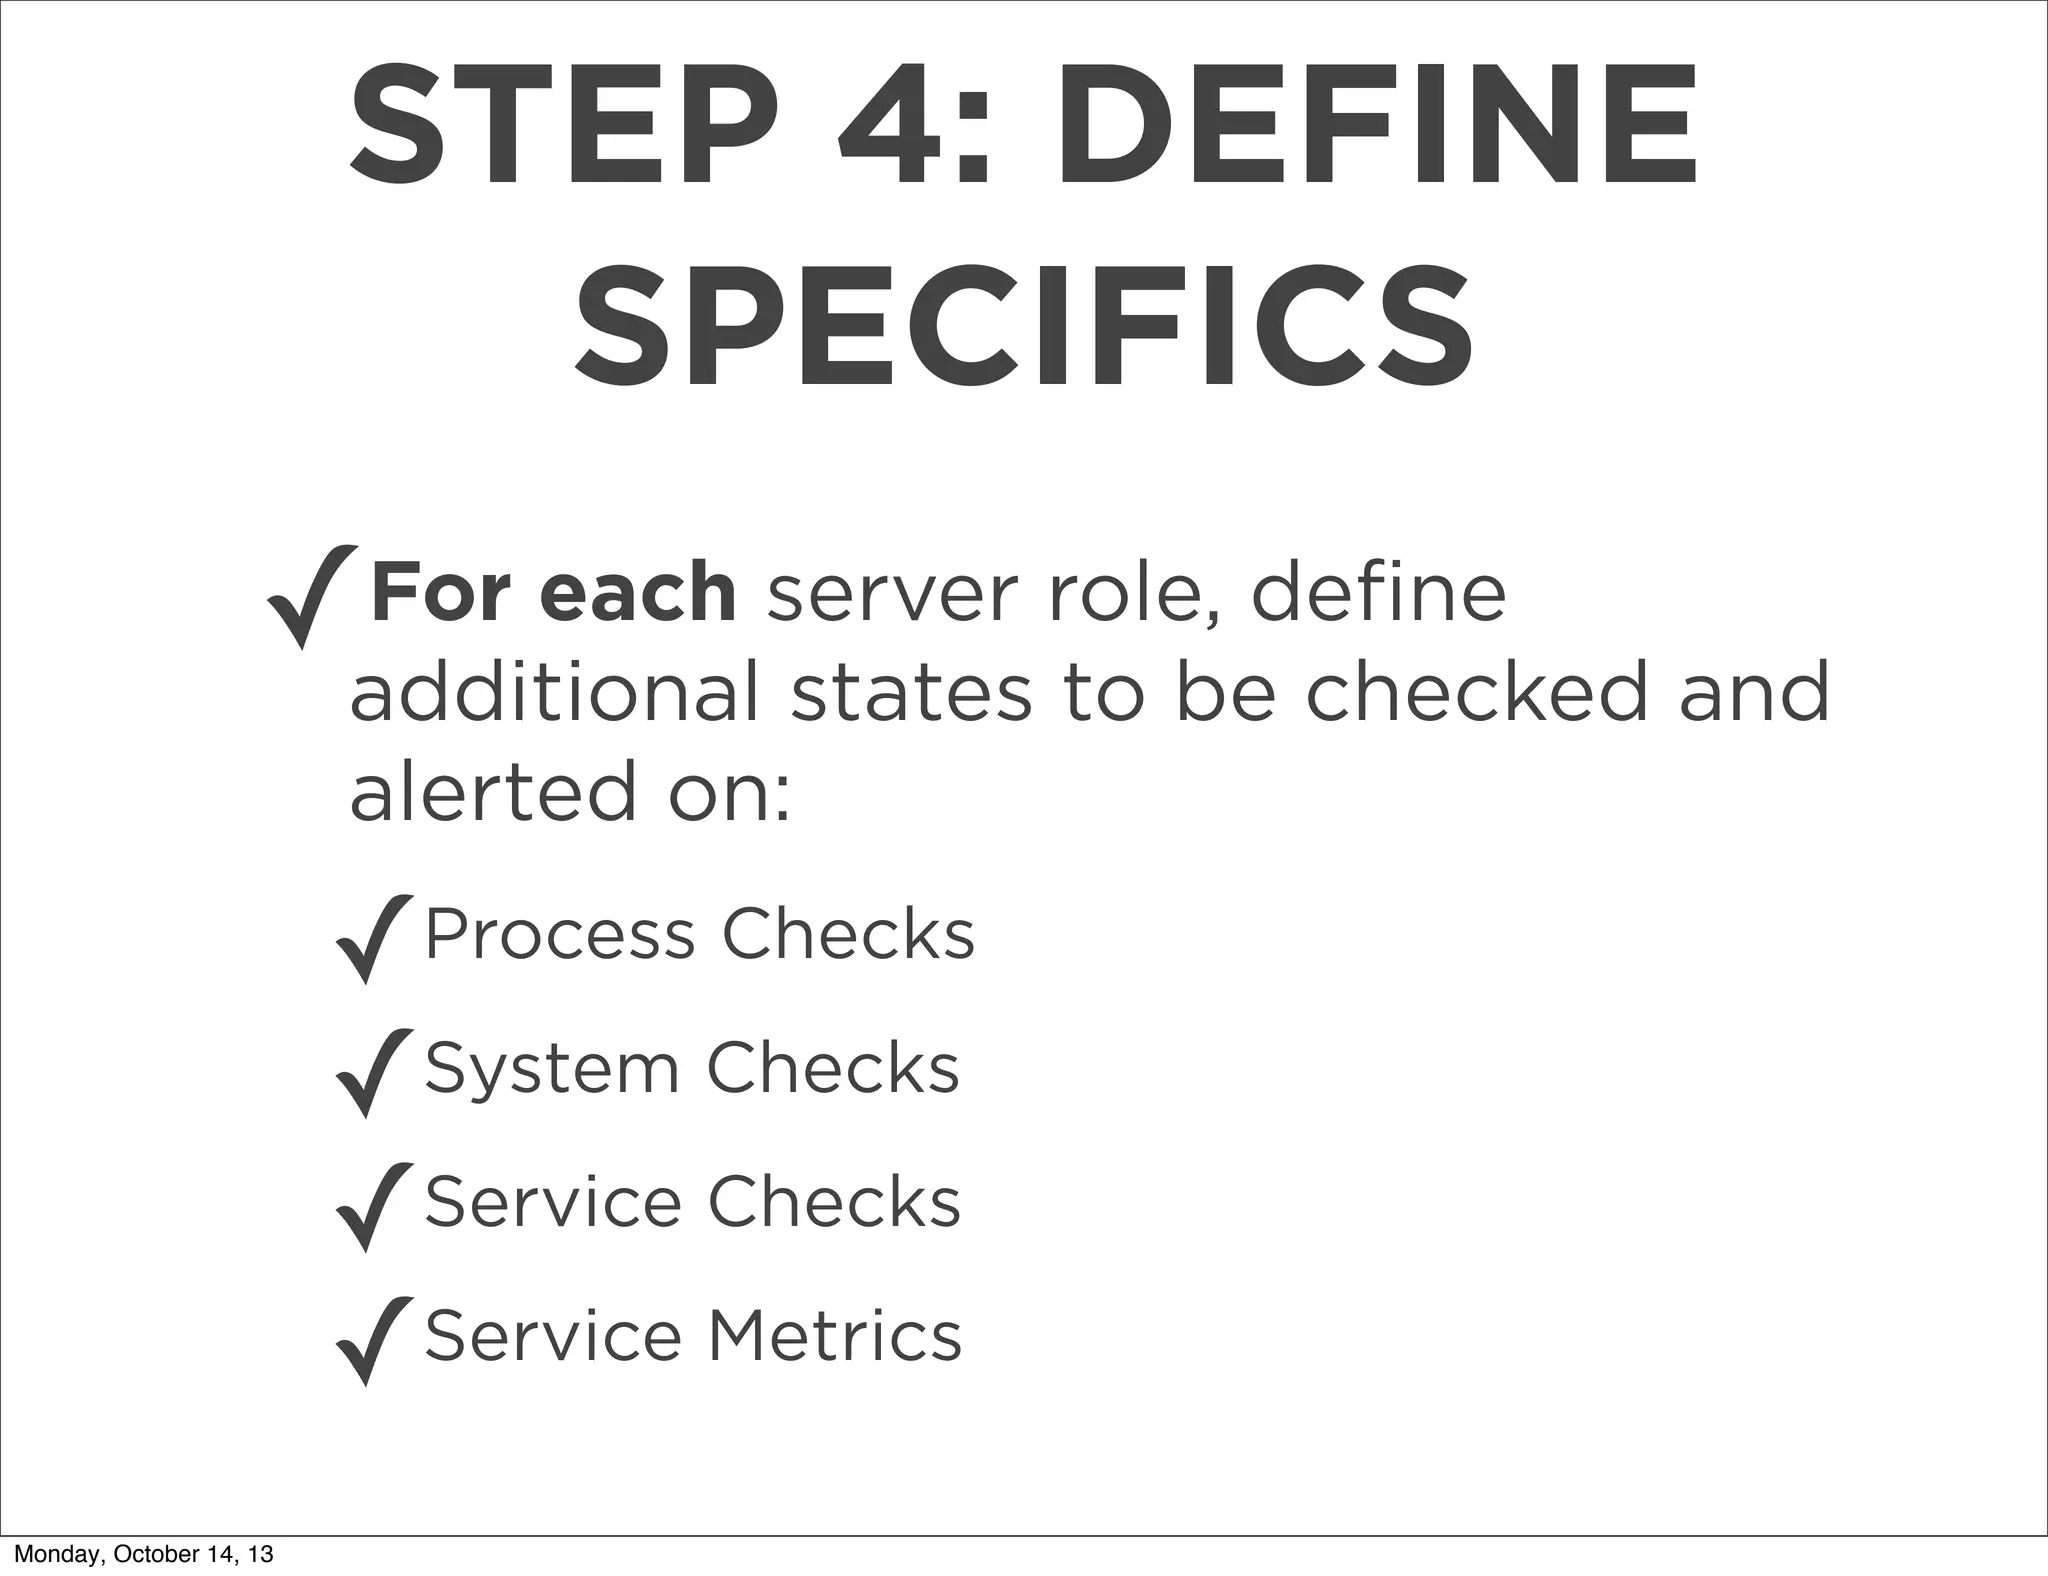
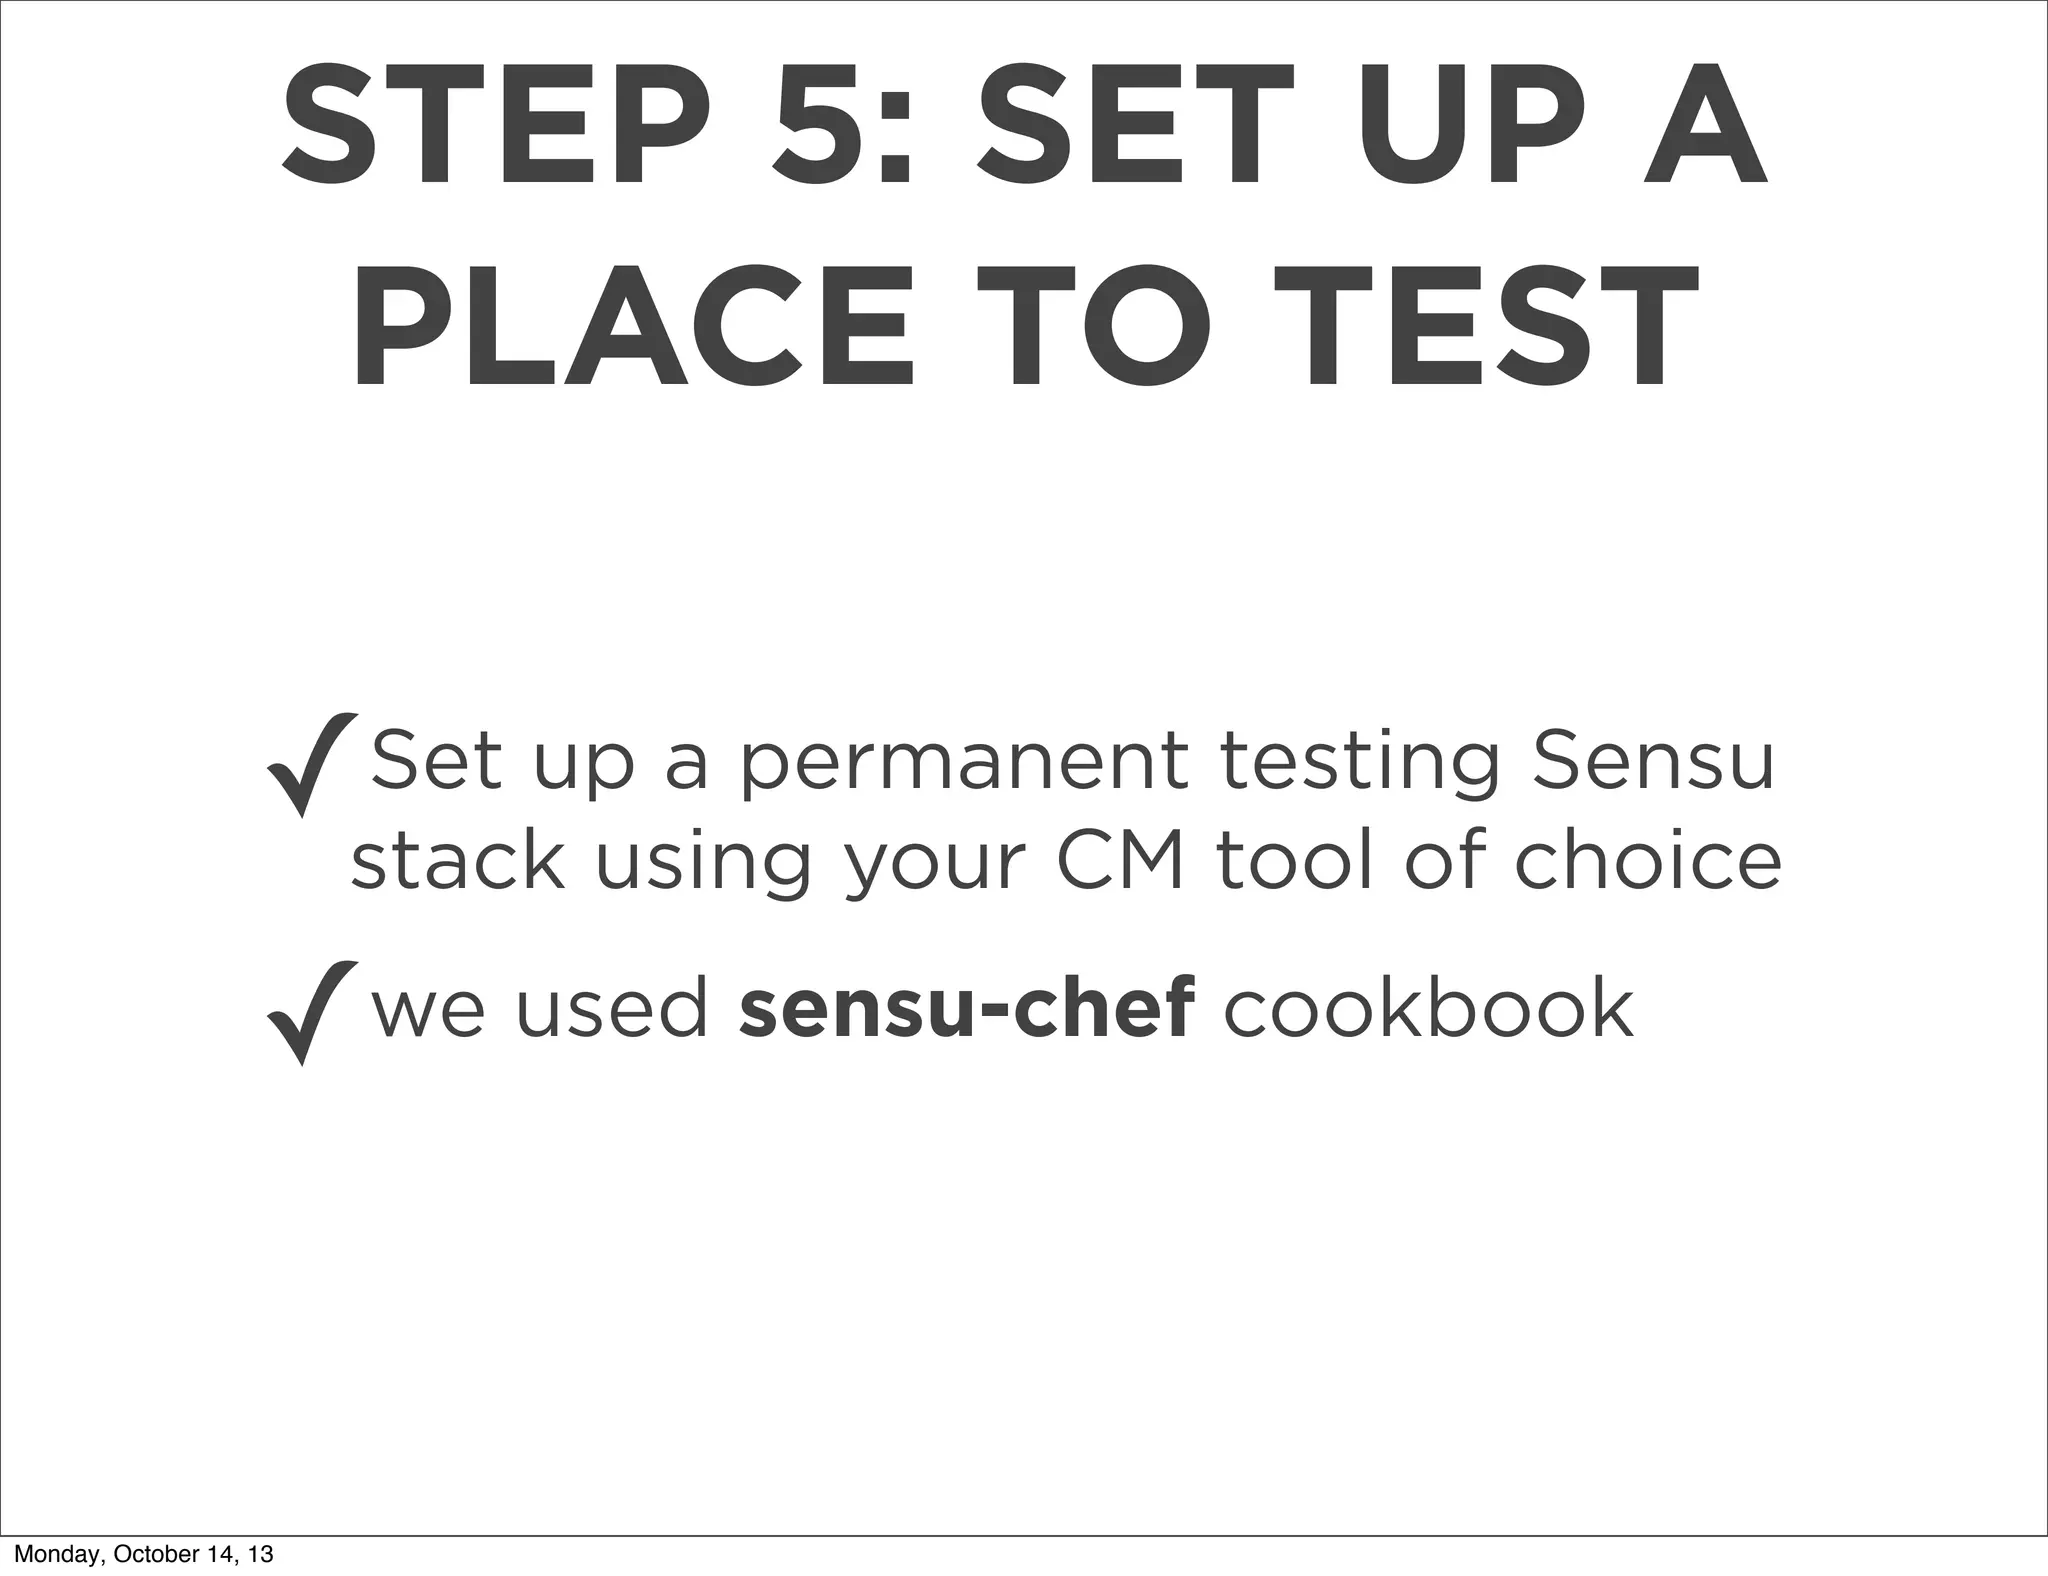
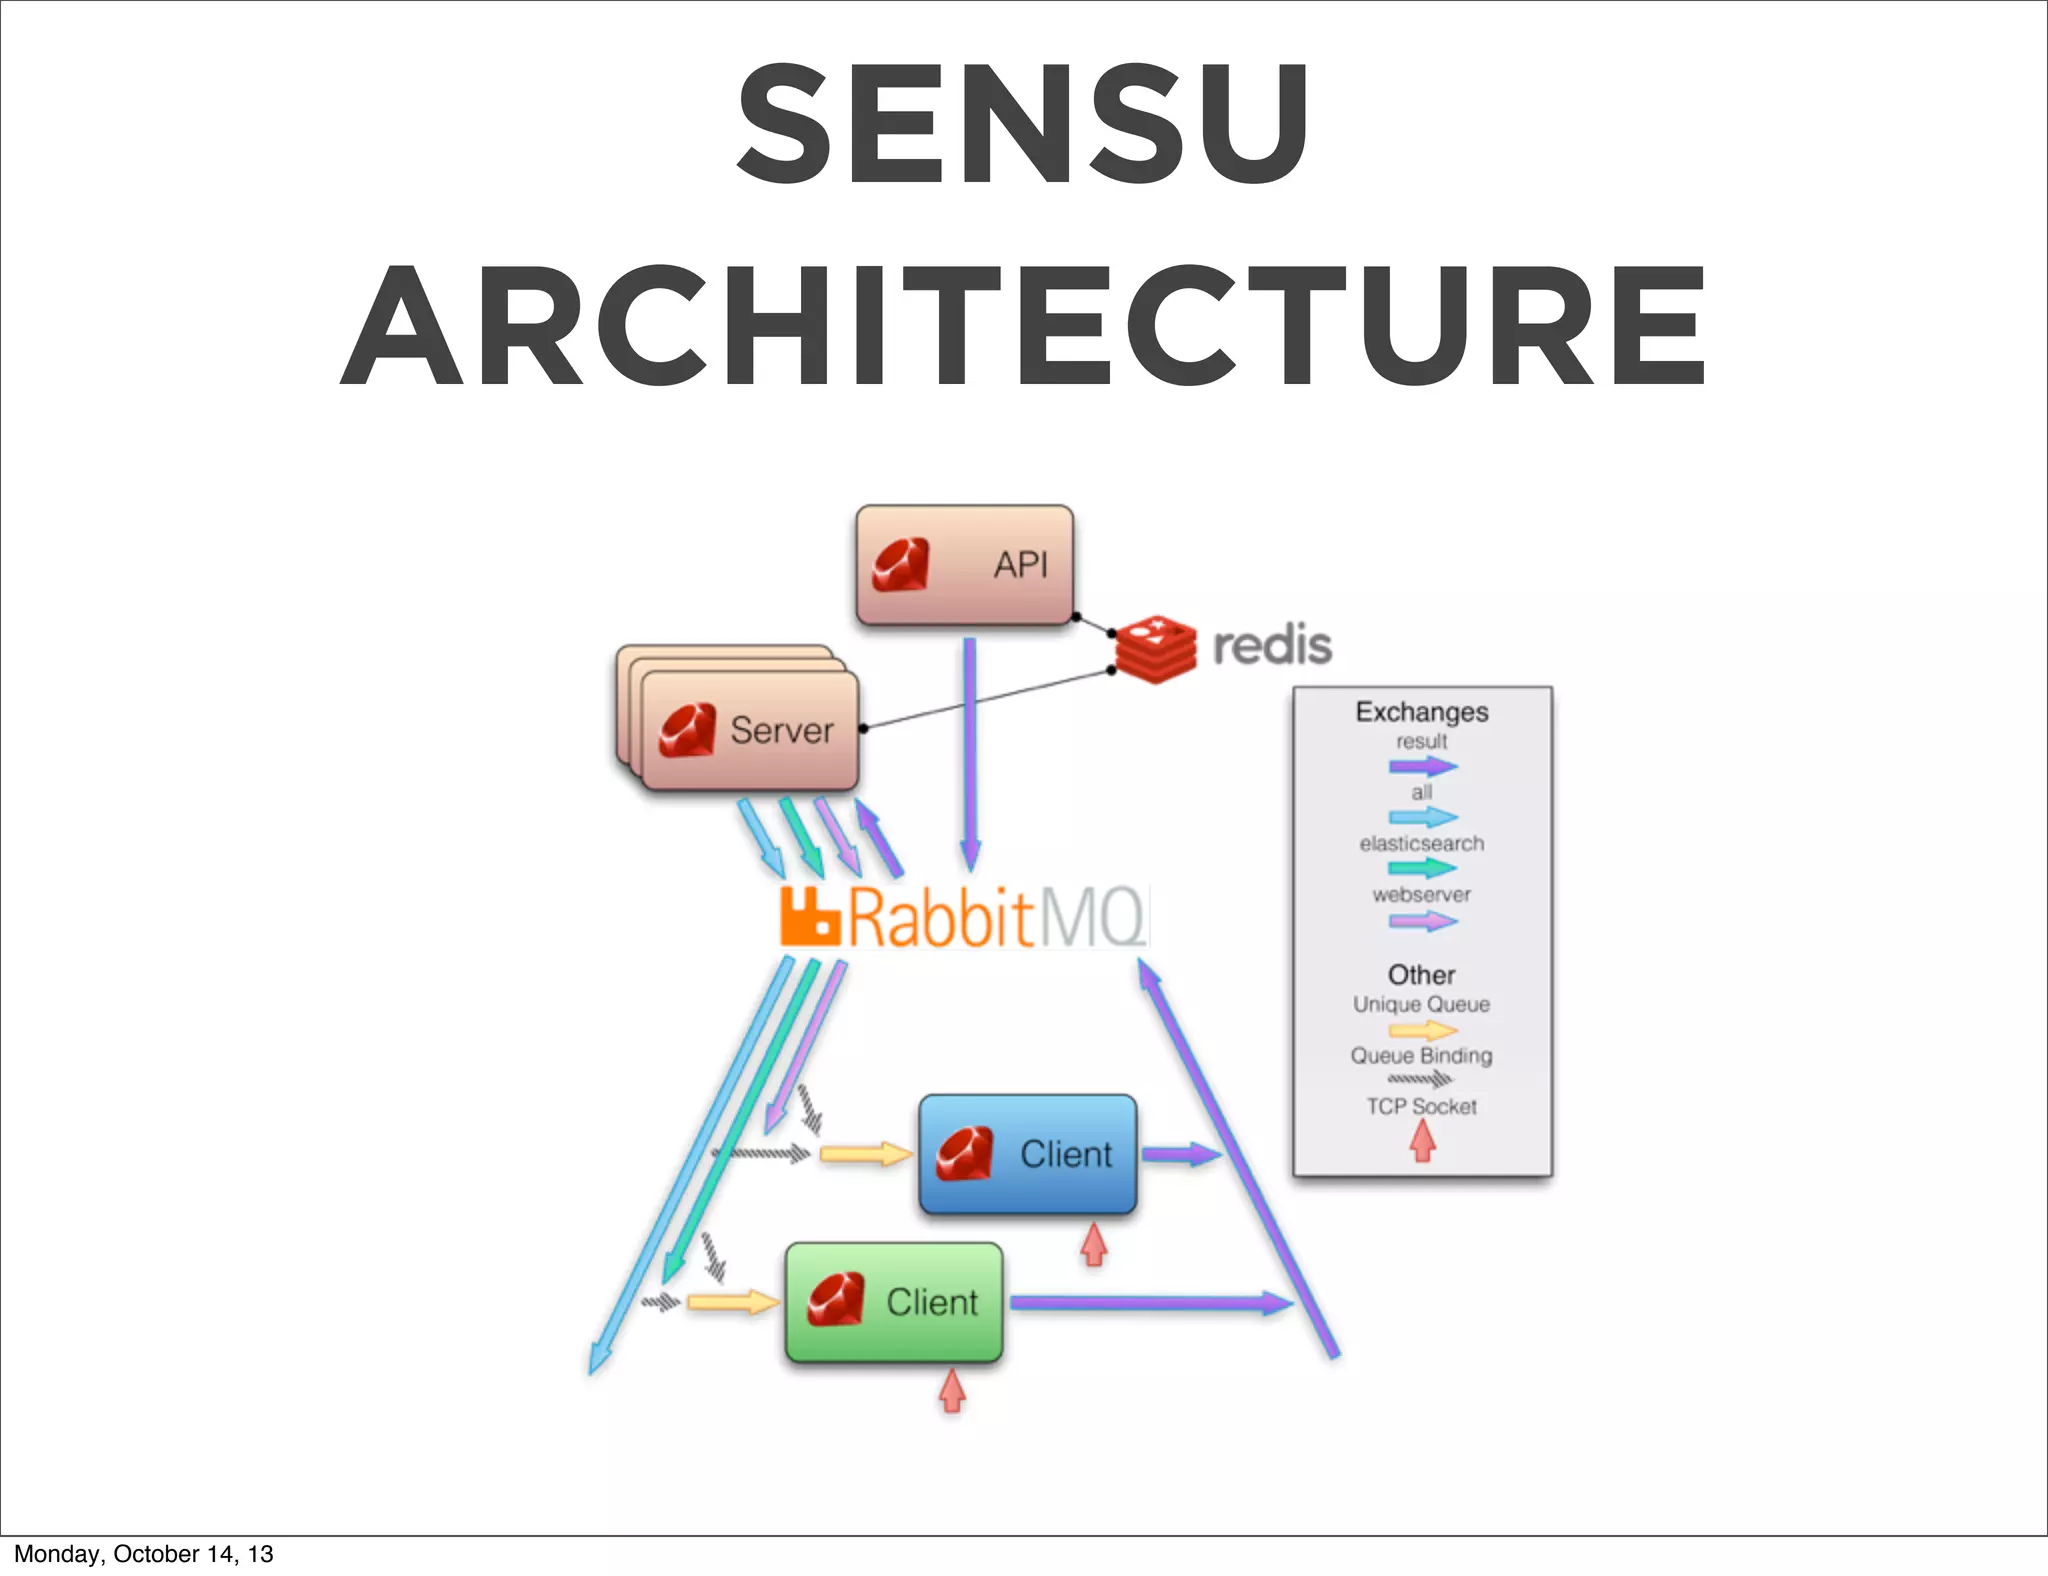


The document outlines a presentation on using Sensu for metrics and monitoring in cloud environments, emphasizing its ease of use, scalability, and integration with other tools like Graphite. It provides a comprehensive guide on migrating from Nagios to Sensu, detailing steps from setup and defining checks to rolling out and tuning the monitoring infrastructure. Additionally, it shares practical tips and resources for implementing and managing Sensu effectively.


