1. Big Chico Creek Ecological Reserve, also known as the BCCER, is an ecological reserve
located about ten miles north of Chico, CA. It is owned and managed by the California State
University, Chico Research Foundation. It occupies 3,950 acres and is largely rural and
undeveloped. It is in a Mediterranean climate, which is distinguished by warm, wet winters
and hot, dry summers. The BCCER is dominated by chaparral/savannah areas, followed by
chaparral, mixed woodland/forest and blue oak savannah/woodland areas. It also has
grassland, wet meadow, riparian, and valley oak woodland areas. Grasslands only take up
about 0.4% of the reserve; however invasive plants, such as yellow starthistle are abundant
in these areas. Vegetation varies greatly in the BCCER and it changes subtly as the
microhabitat changes.
I established three treatment sites: mowing, burning, and mowing + burning plots, along with a control. I
randomly placed ten ¼ square meter plots in each treatment and sampled them. I surveyed yellow
starthistle abundance by estimating percent cover. I recorded soil moisture and temperature in each of
the plots. The plots had been mowed in the summer and burned in November. I surveyed each plot
twice throughout the project: once after mowing, but prior to burning in November, and once after
burning, in March.
After obtaining the data, I used R in order to analyze the data. I logit transformed the percent cover data
in order to give it a more normal distribution before running tests. I ran an ANOVA to find out which
factors were significant indicators affecting the cover of yellow starthistle. I then ran a Tukey’s HSD test
to show which factors were significantly different from each other.
Impact of Mowing and Burning Treatments in Reducing Yellow Starthistle
(Centaurea solstitialis) Populations
Emily Welemin Dept. of Geological and Environmental Sciences, Univ. of California State University, Chico ewelemin@mail.csuchico.edu
Objective
To determine the best treatment to control the presence of yellow starthistle.
Abstract
Study Site Location
Yellow Starthistle
Results
Acknowledgments
Jamie Visinoni, Paul Maslin, Jon Aull, and everyone at the Big Chico Creek Ecological Reserve
The ANOVA showed that the plot type, which had a P-value of 3.33e-4 and the date, which had
a P-value of 3.22e-15, were significant indicators affecting the cover of yellow starthistle.
However, neither soil moisture or soil temperature were significant. The Tukey’s HSD test
showed that all of the treatments were significantly different from each other (P-value < 0.05)
except for control and burn, which both had a high percent cover of live yellow starthistle
(11.42%-12.50%) and mow and mow + burn, which both had a low percent cover of live yellow
starthistle (0.82%-1.54%). Therefore, mowing and mowing + burning a field both significantly
reduce percent cover of yellow starthistle, however, burning alone does not.
Conclusion and Recommendations
Mowing and mowing + burning were the most effective treatments in reducing percent cover of
yellow starthistle. However, burning alone was not very effective in reducing the percent cover of
yellow starthistle. It’s possible that the reason that burning was not effective was that it was done at
the incorrect time. In this study, the plots were burned in November. However, burning is most
effective when done in late June or early July, after the dispersal of desirable grass seed but before
yellow starthistle seed production. In future studies, burning should be done in late June or early
July, if possible.
Yellow starthistle is an invasive annual forb, which has taken over 5.8 million hectares of
land in California alone. It displaces native plant communities, affects critical wildlife
habitat, accelerates soil erosion, and reduces forage for wildlife. Many techniques and
integrated strategies have been developed in order to control populations of yellow
starthistle. In this study, I investigated some of these techniques, including mowing,
burning, and a combination of both mowing and burning. To do this, I measured percent
cover, as well as soil moisture and soil temperature after the mowing treatment but before
the burning treatment was applied and after both treatments had been applied.. I ran an
ANOVA which showed that the treatment (P-value = 3.33e-4) and the sampling date (P-
value = 3.22e-15) were significant indicators affecting the cover of yellow starthistle. A
Tukey’s HSD test showed that all of the treatments were significantly different from each
other except for control and burn, which both had a high percent cover of live yellow
starthistle (11.42%-12.50%) and mow and mow + burn, which both had a low percent cover
of live yellow starthistle (0.82%-1.54%). Therefore, mowing and mowing + burning a field
both significantly reduce percent cover of yellow starthistle, however, burning alone does
not.
Plot Locations
Data Summary
Figure 3: Bar graph of average soil
temperatures across the treatments in
November and March with standard deviation
error bars. Soil temperature was not significantly
different between treatments or across dates.
Figure 1: Box plot showing percent cover of
live yellow starthistle across the treatments The
burn plot had the greatest amounts of yellow
starthistle, followed by the control plot, followed
by the mow + burn and mow plots.
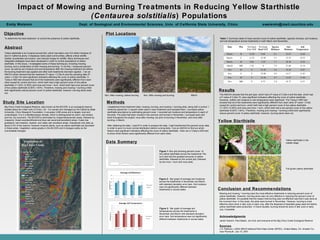
Table 1: Summary table of mean percent cover of yellow starthistle, species richness, soil moisture,
and soil temperature across treatments in both March and November.
Methods
Date Plot % Cover
Live YST
% Cover
Dead YST
Species
Richness
Soil
Moisture
Soil
Temperature
March B 12.50 0.80 8.1 22.07 16.40
March C 11.42 33.50 5.3 15.53 10.52
March M 0.82 2.30 7.1 20.30 12.56
March MB 1.54 0 7.9 21.60 15.14
Nov B 0 43.20 5.6 19.30 12.87
Nov C 0 35.00 4.9 14.17 11.85
Nov M 0 16.50 4.7 15.83 11.90
Nov MB 0 0.72 5.8 18.73 12.51
Figure 2: Bar graph of average soil moistures
across the treatments in November and March
with standard deviation error bars. Soil moisture
was not significantly different between
treatments or across dates.
Nov: After mowing, before burning Nov: After mowing and burning March
Yellow starthistle in the
rosette stage
Full grown yellow starthistle
Sources
J.S. Peterson. USDA NRCS National Plant Data Center (NPDC). United States, CA, Amador Co.,
near Plymouth. July 15, 2001.