Using Thin-plate Spline Grids in Modeling Sex Differences in the Shapes of th...
Senior Assignment Poster Final-1
1. RESULTS
• There was significant differences between taxa in four
dimensions out of the 31 analyzed.
–In the tooth region, PML(14)-M1L(16) and CP(20)-PMA(21)
(Figure 1).
–In the facial region, NANT(23)-NF(26) (Figure 5).
–In the cranial vault, PFA(28)-PF(30) (Figure 1).
• In the area of the cranial vault involving the chewing
muscles, and the palate showed no significant difference
between taxa.
• With all of the dimensions taken into consideration,
classification of the two taxa is correct 100% of the time
(figure 7).
DISCUSSION
Considering the same tests were performed on both raw and
size adjusted data and there was not a significant amount
of variation upon the analysis of the results, the attributing
significant landmarks are not due to differences in size
between the two taxa (Goswami, 2006) The study
contained minimal measurement error based on mean
square values (Bailey and Byrnes, 1990) which indicates
that the results are useful to determine integration and
phylogeny between the two taxa. A decreased amount of
variation due to size is not an unreasonable result as both
taxa are in the same clade, having shared a recent
common ancestor before diverging (Goswami, 2006). The
results indicate significant variation relating to the tooth
and face region, coming about from differences in diet,
habitat, and evolutionary forces such as natural selection
or genetic drift. Despite these differences in habitat, the
cranial similarities probably reflect their phylogenetic
similarities. A study done by Marriog et al (2004)
explained that areas of the face are more susceptible to
size variation than areas of the cranium. Although the
variation in each region was less than expected, these two
taxa share a close relationship, which resulted in
similarities in their characteristics.
ACKNOWLEDGEMENTS
Specimens were borrowed from the University of Wisconsin Zoology Museum.
Funding support was provided by the Department of Biological Sciences and
the College of Arts and Sciences, Southern Illinois University Edwardsville.
REFERENCES
Bailey, R.C., Byrnes, J. 1990. A new, old method for assessing measurement
error in both univariate and multivariate morphometric studies. Systematic
Zoology 39(2): 124-130.
Dewey, T., Middlebrook, C. 2007. “Vulpes lagopus (artic fox).” Animal Diversity
Web. National Science Foundation. Web.
Goswami, A. 2006. Morphological integration in the carnivoran skull. Evolution
60: 169-183.
Klingenberg, CP., 2014. Studying morphological integration and modularity at
multiple levels: concepts and analysis. Philosophical Transactions of the
Royal Society B. 369(1649): 20130249.
Marroig, G., De Vivo, G., Cheverud, J.M. 2004. Cranial evolution in sakis (Pithecia,
Platyrrhini) II: evolutionary processes and morphological integration. Journal
of Evolutionary Biology 17:144-155
Resmer, K. 1999. “Vulpes velox (swift fox).” Animal Diversity Web. National
Science Foundation. Web.
Cranial Morphology Distinguishing Two Closely Related
Canidae Species
Courtney Brewer and Luci Kohn
Southern Illinois University Edwardsville
INTRODUCTION
Vulpes velox and Vulpes lagopus, swift and arctic fox
respectively, are two closely related canidae species
distinguished by functional and developmental cranial
morphology features (Klingenberg, 2014). Not only are these
two species geographically separated, but also differ in diet,
genetics, and behaviors. Swift fox, weighing approximately
5-7 pounds, are native to the Great Plains of North America
and feed on small game and berries (Resmer, 1999). Arctic
fox, ranging in weight from 6-21 pounds, are native to the
Arctic tundra and are at an increased risk of reduced
resources, feeding mainly on birds and marine invertebrates
(Dewey et al., 2007). These differences in lifestyle between
the taxa have a resulting effect on cranial form (Marriog et
al, 2004). This study tests for significant differences in
cranial dimensions of V. velox and V. lagopus.
MATERIALS AND METHODS
This study analyzed the cranial vault, cranial base, and face
of 17 swift fox (V. velox) and 20 arctic fox (V. lagopus).
Three-dimensional coordinates of 31 landmarks were
obtained on each individual skull using a Microscribe G2X
(Figures 1-6). These landmarks were used to define linear
distances in the tooth row, palate, face, and cranial vault.
Thirty-one linear dimensions were calculated for areas of
the cranial vault and face (Table 1). Data were adjusted for
size differences with the geometric mean. Analysis of
variance was used to test for significant differences of
between taxa in regions of the face and cranial vault, and a
classical discriminant function analysis were performed on
to test the degree to which these taxa could be
distinguished in these cranial regions (Systat 13.0).
Figure 3. V. velox lateral
skull view with
corresponding landmarks
Figure 4. V. lagopus
lateral skill view.
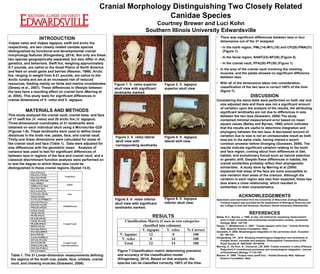
Figure 1. V. velox superior
skull view with significant
landmarks marked.
Figure 2. V. lagopus
superior skull view
Figure 5. V. velox inferior
skull view with significant
landmarks marked.
Figure 6. V. lagopus
inferior skull view.
Table 1. The 31 Linear-dimension measurements defining
the regions of the tooth row, palate, face, orbitals, cranial
vault, and chewing muscles (Goswami, 2006).
Classification Matrix (Cases in row categories
classified into columns)
V. lagopus V. velox % Correct
V. lagopus 12 0 100
V. velox 0 14 100
Total 12 14 100
Figure 7.Classification matrix determining precision
and accuracy of the classification model
(Klingenberg, 2014). Based on this analysis, the
species can be classified correctly 100% of the time.