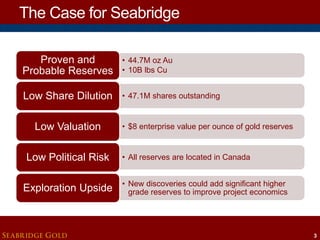
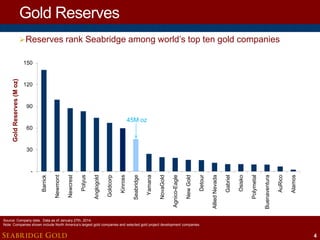
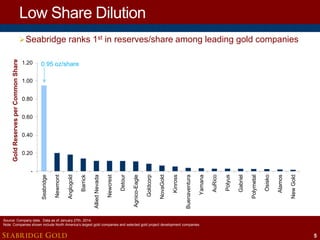
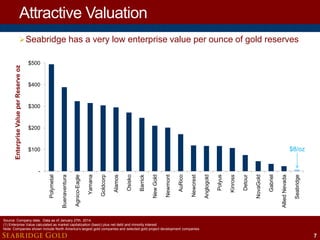
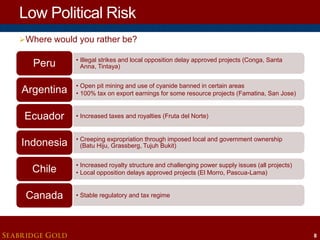
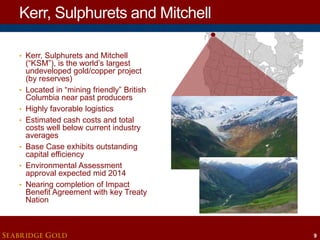
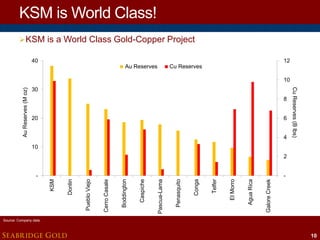
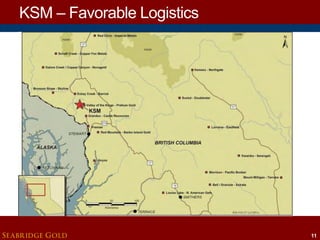
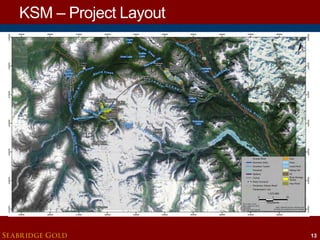
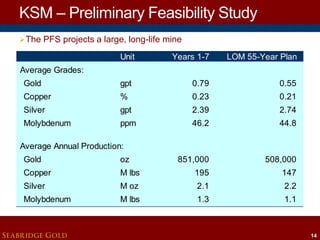
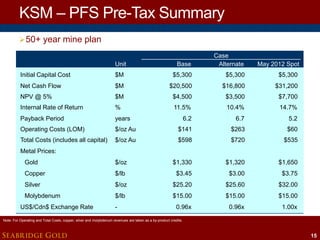
The corporate presentation provides an overview of Seabridge Gold and its key projects. It summarizes that Seabridge has proven and probable gold reserves of 44.7 million ounces and copper reserves of 10 billion pounds. It also notes that Seabridge has a low valuation of $8 per ounce of gold reserves and that its projects have low political risk as they are all located in Canada. A significant portion of the presentation focuses on the KSM project, which it describes as the largest undeveloped gold and copper project in the world based on reserves. It provides details on KSM's favorable logistics, large reserve size, and preliminary feasibility study outlining an long life mine plan with attractive economics.
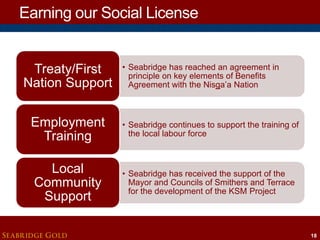
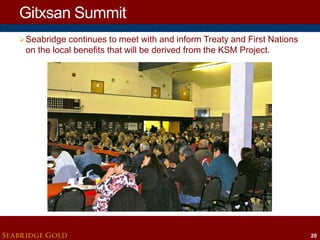
![Support of Treaty and First Nations
NISGA'A NATION AND SEABRIDGE GOLD CONFIRM
AGREEMENT IN PRINCIPLE ON KEY ELEMENTS OF KSM
BENEFITS AGREEMENT
August 2013
"Seabridge has demonstrated a real willingness to assist the
Nisga'a Nation in creating genuine economic opportunities for, and
building the capacity of, Nisga'a citizens, [and] we look forward to
continuing our participation in the environmental assessment
process for the KSM Project.“
- Mitchell Stevens, President of the Nisga’a Nation
SEABRIDGE GOLD
19](https://image.slidesharecdn.com/seabridgecorppresfeb2014-140203113458-phpapp01/85/Seabridge-Corporate-Presentation-February-2014-19-320.jpg)