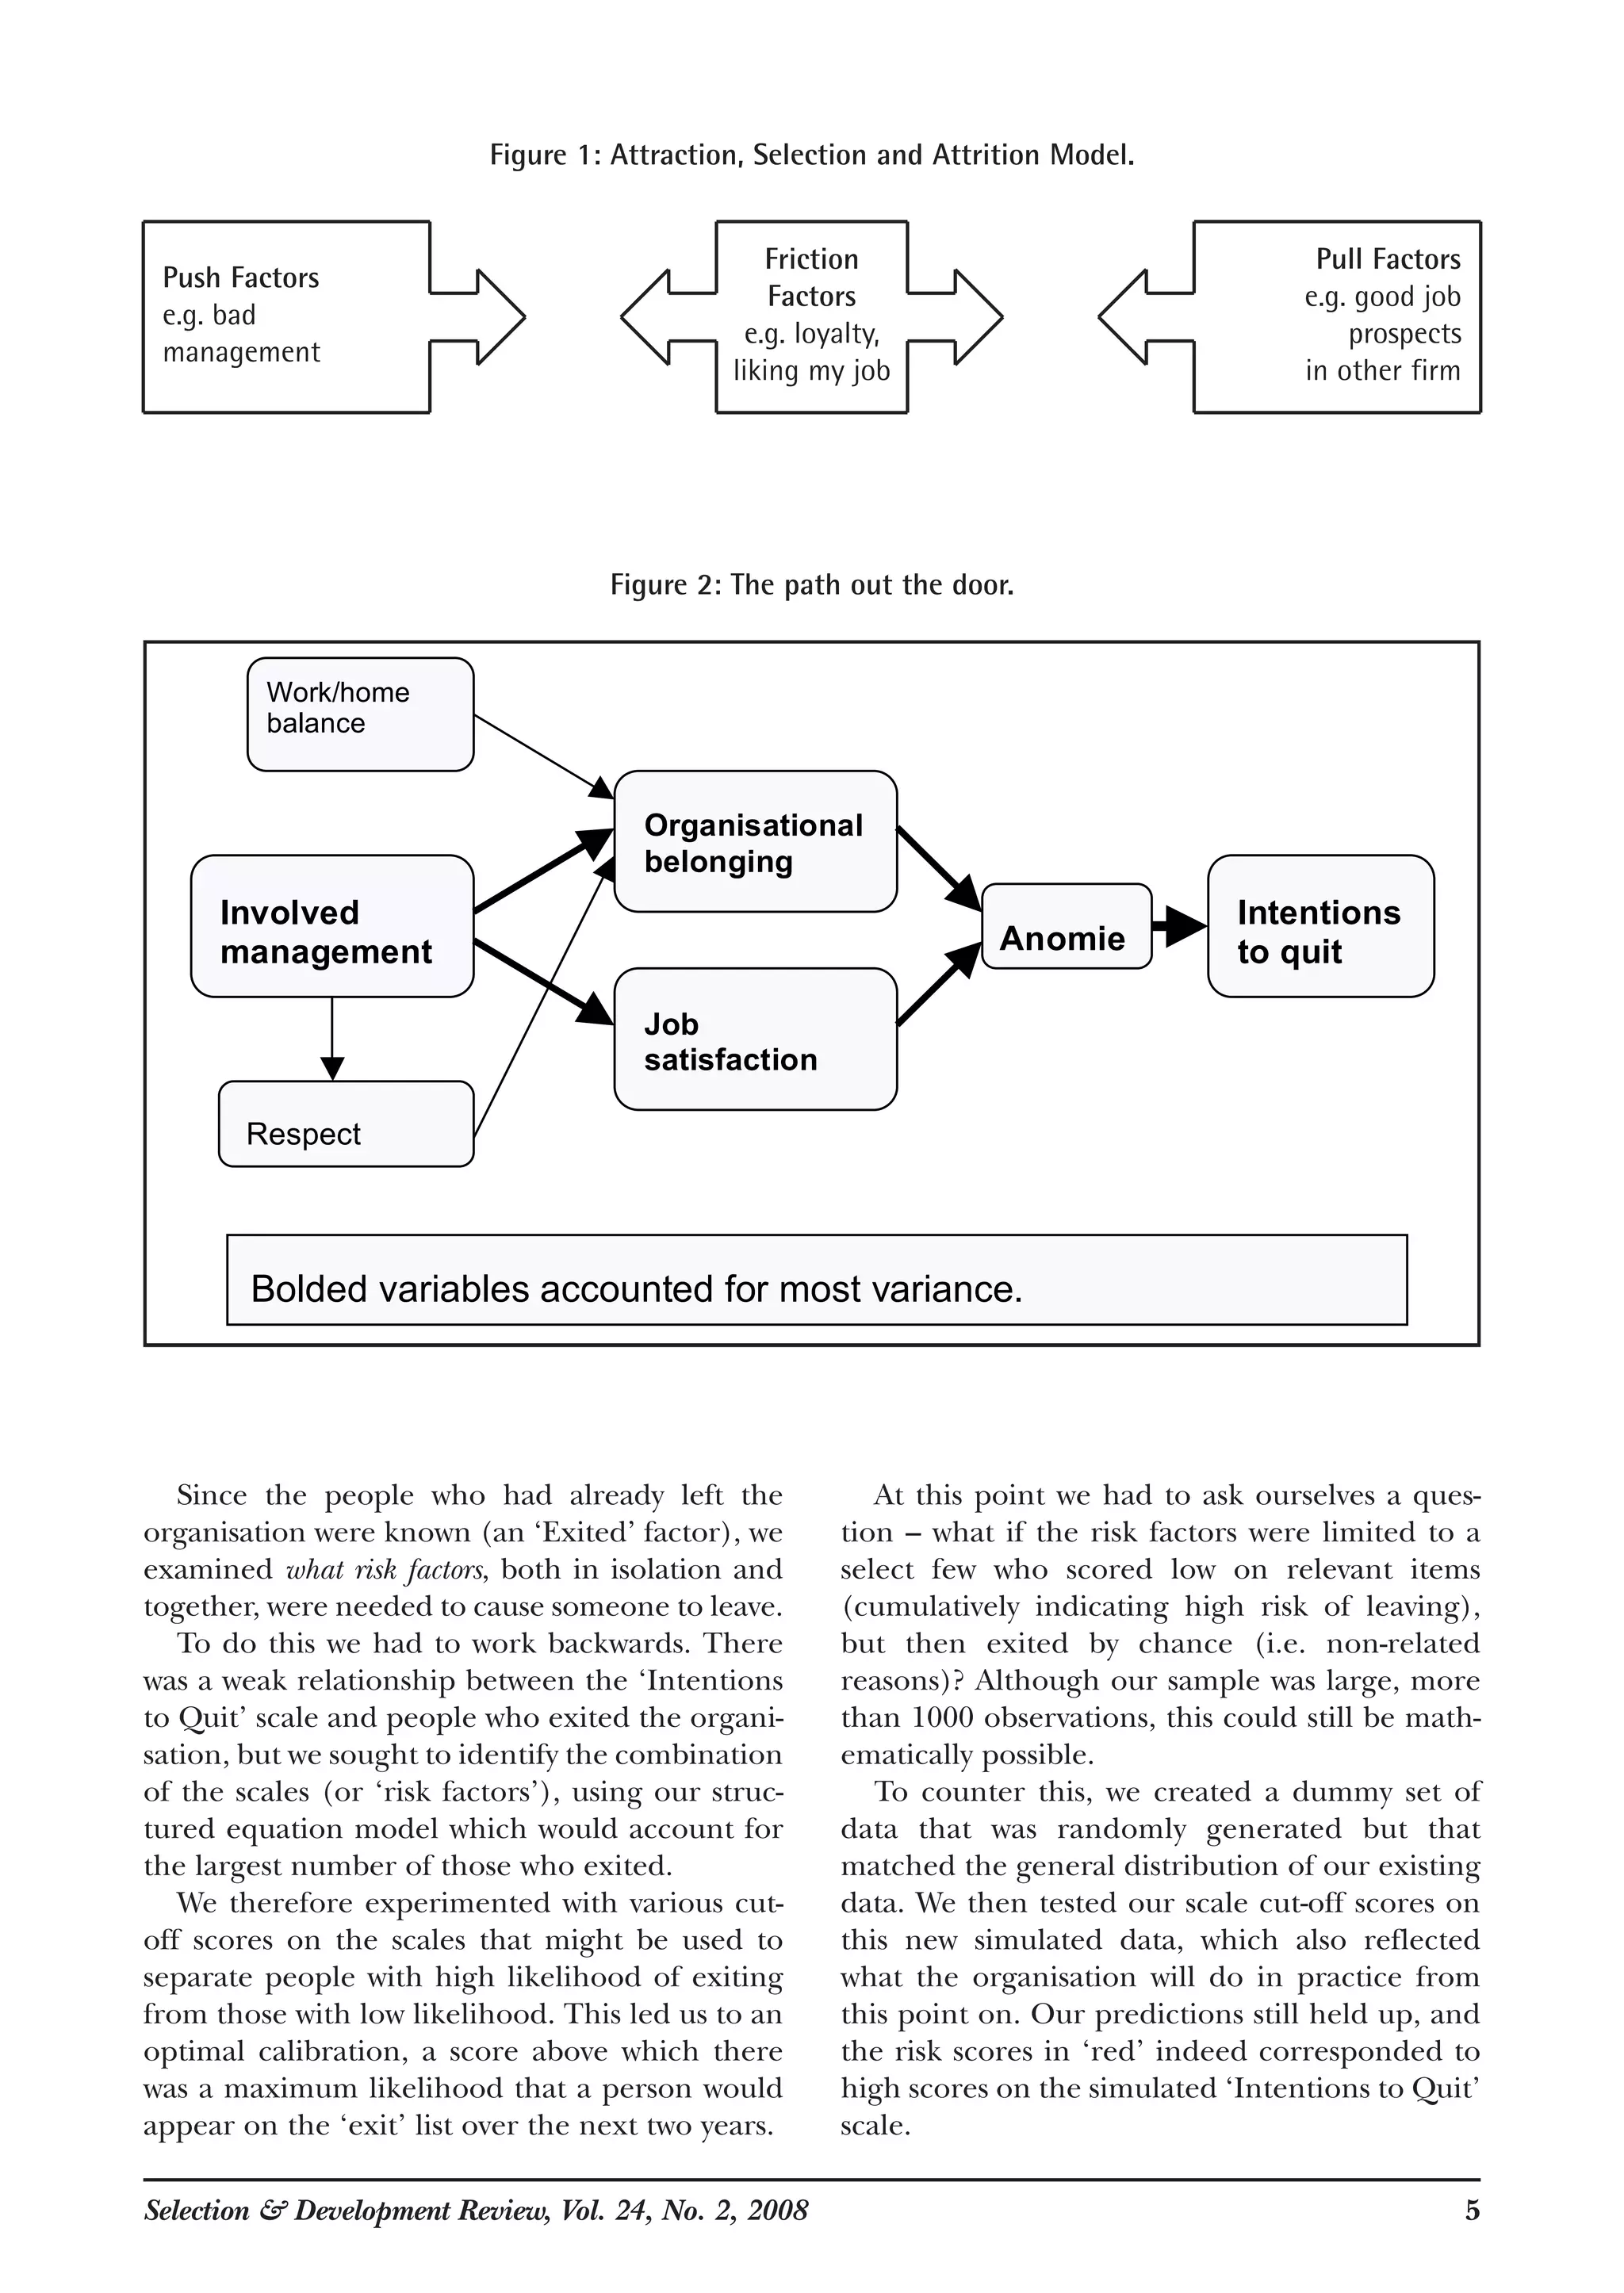
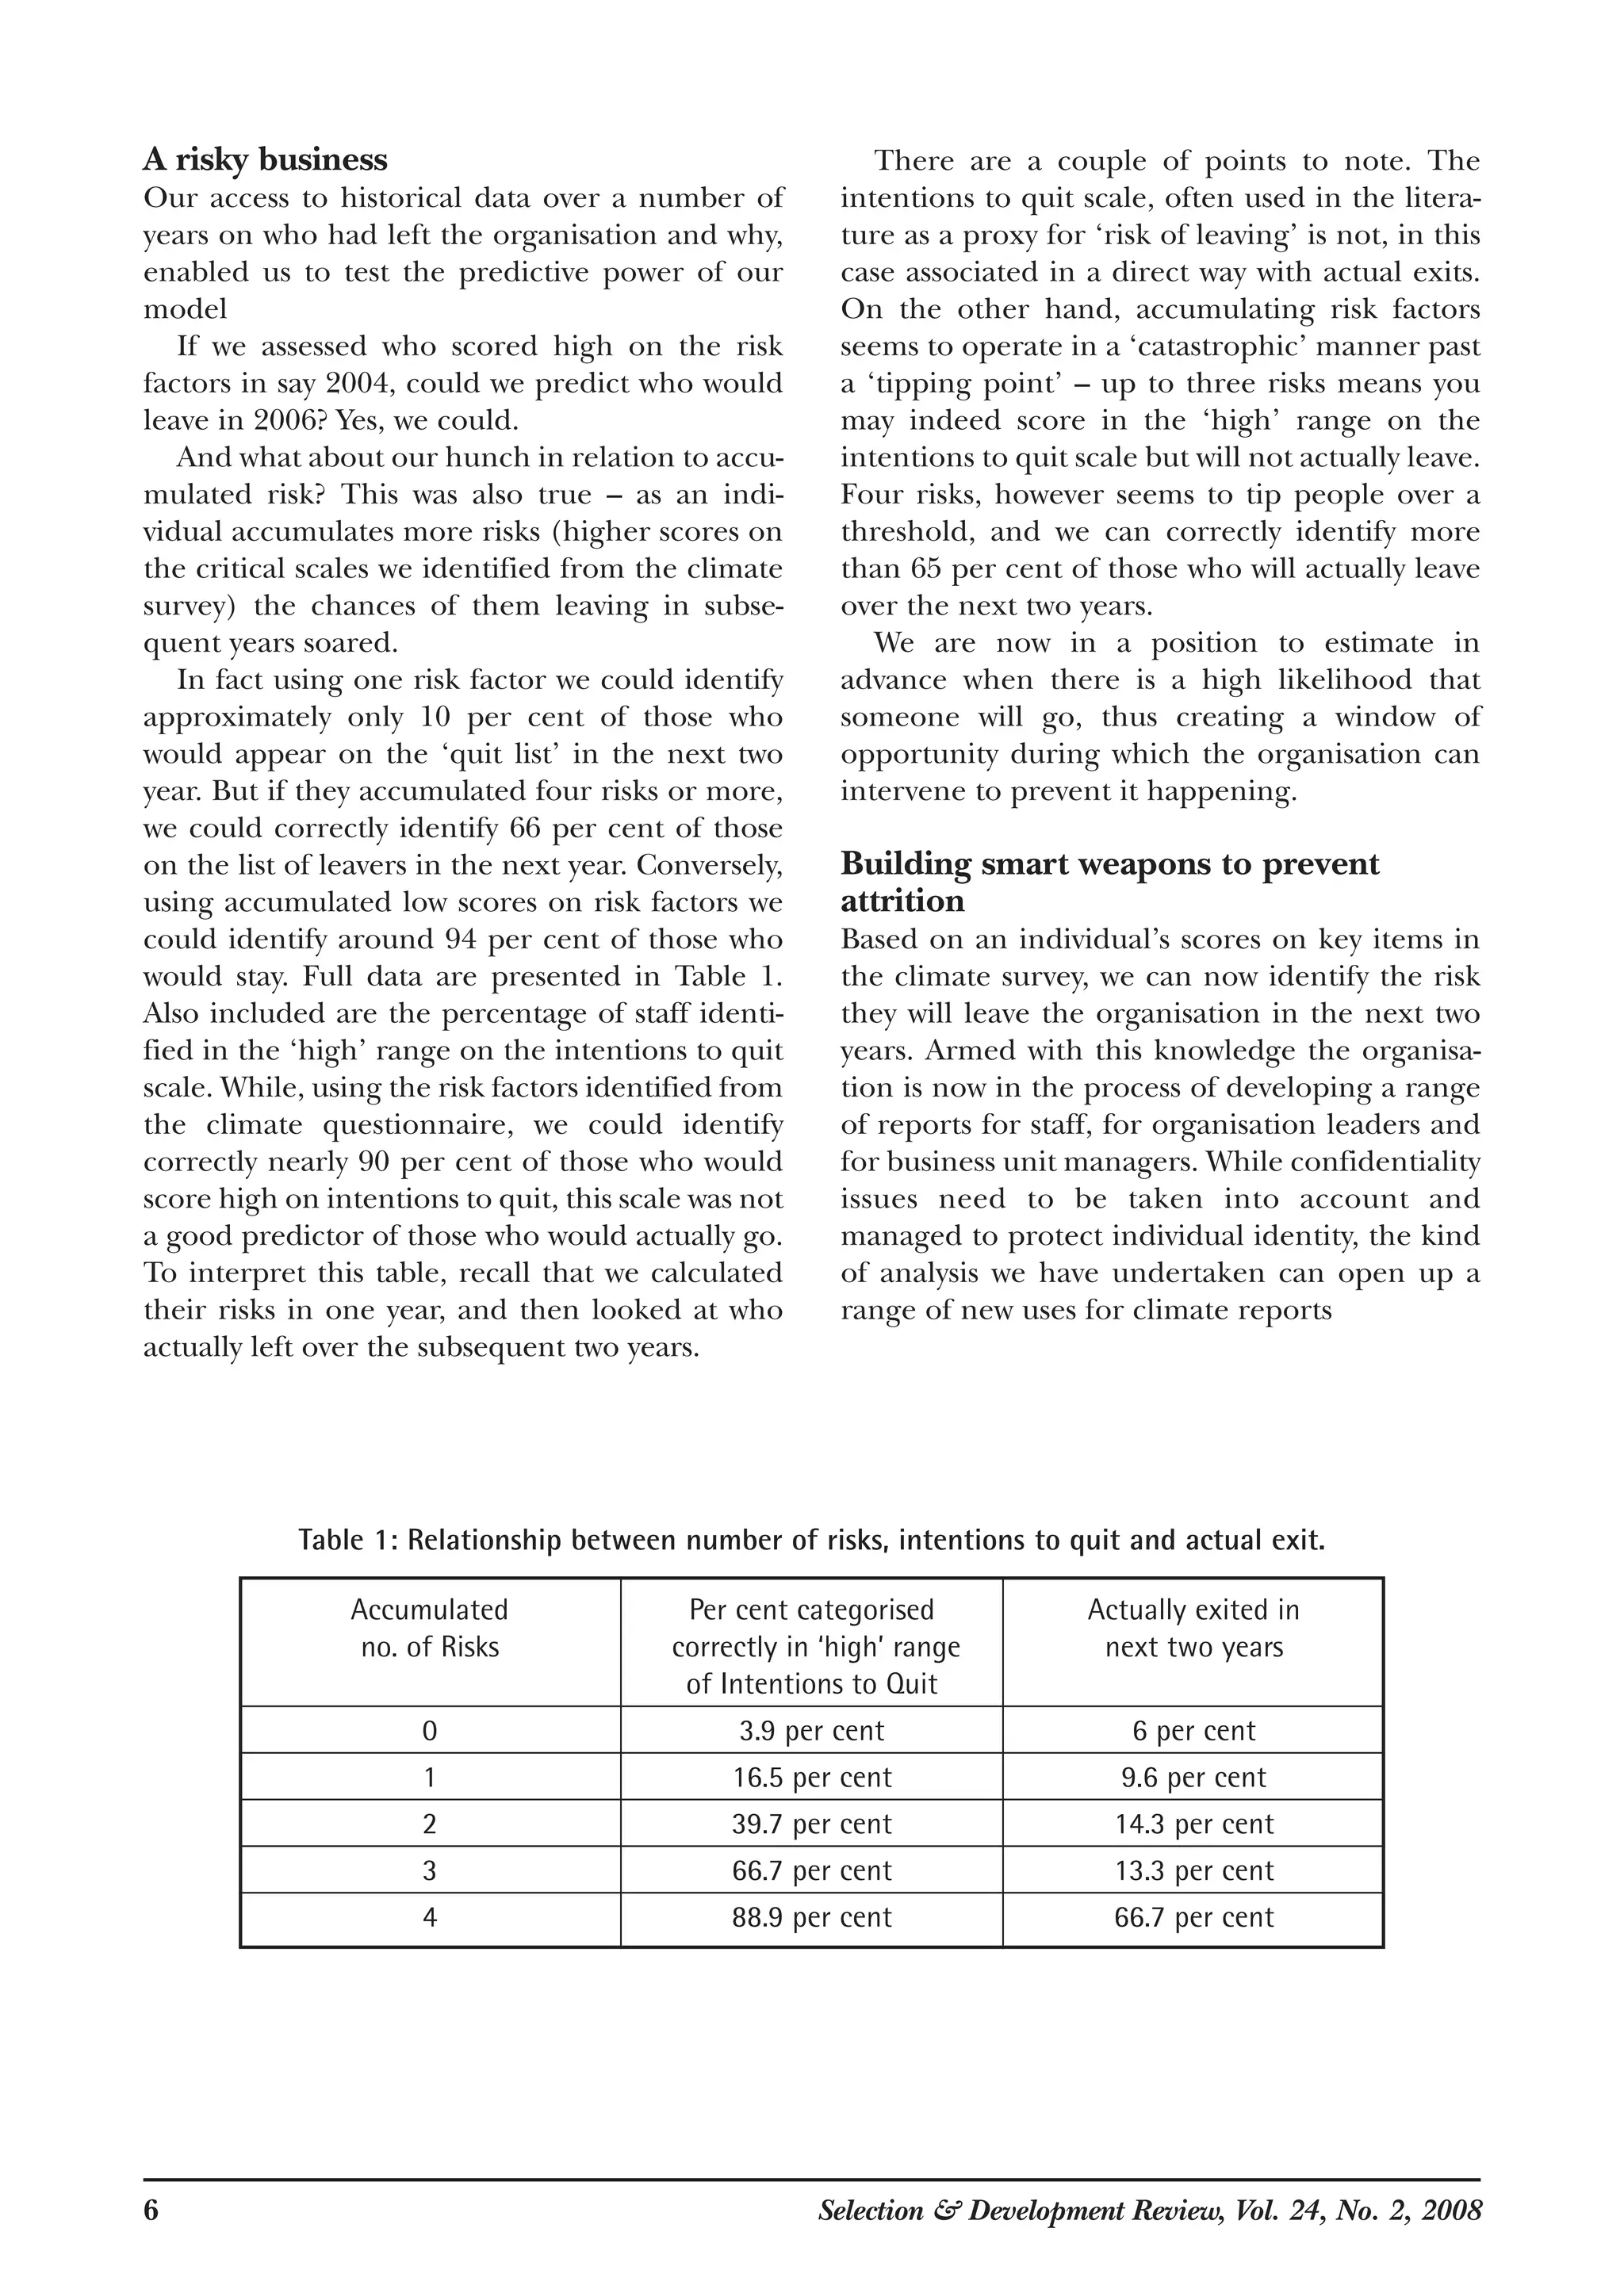
Selection
Development
Review
Volume 24, No. 2, 2008
ISSN 0963-2638
&Selection
Development
Review
P U B L I S H E D B Y T H E B R I T I S H P S Y C H O L O G I C A L S O C I E T Y
SDRC O N T E N T S
APRIL’S issue of SDR covers a variety of topical
issues and should have something to interest all
readers.
Dave Winsborough, Mina Morris and Mike
Hughes adopt an innovative approach, using
staff satisfaction surveys, to establish an early
warning system that detects when valued
personnel are becoming unhappy to the point of
seeking to leave. This can trigger an intervention
which could include re-negotiating the ‘psycho-
logical contract’ with alienated individuals.
Laurel Edmunds and Jessica Pryce-Jones
attempt to unravel the complex interactions
between ‘Employee Happiness, Overtime, Sick
Leave and Intention to Stay or Leave’. Their
tentative findings qualify the assertion that long
working hours per se undermine health and happi-
ness and increase likelihood of leaving. For
instance, people who had high ‘work belief’,
enjoyed their jobs and were ambitious for
advancement did not seem to experience lower
happiness, greater sickness absence and higher
likelihood of leaving as a result of doing overtime.
Peter Goodge and Jane Coomber update us
on the effectiveness of 360 degree feedback; the
conditions that must be satisfied for it to work
well and when it is less effective. They highlight
the need for associated support for development
and its importance in enhancing self-awareness,
a key ingredient of managerial success.
The distinguished psychometrician, Roy
Childs, who is not shy of controversy, challenges
us to re-examine our guidelines on psychometric
feedback in the light of technology related
changes in assessment practice and consideration
of different ways in which value might be added.
Dave Bartram, Chair of the Steering Committee
on Test Standards, gives a considered and infor-
mative response. The BPS Code of Good Practice
in Psychological Testing is provided for reference
and to remind us what we should be doing.
The editorial team must conclude with a plea
to our readers to help us to disseminate best
practice and practical knowledge. We are short
of articles and need you to put your experience
in practice and research into eloquent words.
Please get writing and make editors and readers
happy with a pipeline of articles that guarantees
a steady stream of stimulating future issues.
John Boddy
Preventative defence against attrition: 3
Engaging ‘on the fence’ employees
Dave Winsborough, Mina Morris & Mike Hughes
Relationships between employee happiness, 8
overtime, sick leave and intention to stay
or leave
Laurel Edmunds & Jessica Pryce-Jones
360 Feedback – once again the research 13
is useful!
Peter Goodge & Jane Coomber
To give or not to give – 17
that is a difficult question
(Challenging assumptions regarding feedback of
psychometric tests)
Roy Childs
Giving feedback to test takers 20
Dave Bartram
BPS Code of Good Practice in 24
Psychological Testing
Editorial
Selection & Development Review Editorial Team
Dr John Boddy
16 Tarrws Close, Wenvoe, Cardiff CF5 6BT.
Tel: 029 2059 9233. Fax: 029 2059 7399.
E-mail: JBoddy2112@aol.com
Stuart Duff, Stephan Lucks & Ceri Roderick
Pearn Kandola Occupational Psychologists,
76 Banbury Road, Oxford OX2 6JT.
Tel: 01865 516202. Fax: 01865 510182.
E-mail: sduff@pearnkandola.com
Philippa Hain
Transformation Partners
98 Plymouth Road, Penarth CF64 5DL.
Tel: 07816 919857 or 029 2025 1971.
E-mail: philippa.hain@ntlworld.com
Monica Mendiratta
Empress State Building, Third Floor West, Empress Approach,
Lillie Road, London, SW6 1TR.
Tel: 07795 128171.
E-mail: monica_m999@hotmail.com
Consulting Editors: Dr S. Blinkhorn;
Professor V. Dulewicz; Professor N. Anderson.
Published six times a year by the British Psychological Society,
St Andrews House, 48 Princess Road East, Leicester LE1 7DR at £37
(US $50 overseas) a year. Tel: 0116 254 9568. Fax: 0116 247 0787.
E-mail: mail@bps.org.uk. ISSN 0963-2638
Aims, objectives and information for contributors
SDR aims to communicate new thinking and recent advances in the theory
and practice of assessment, selection, and development. It encourages critical
reviews of current issues and constructive debate on them in readers’ letters.
SDR is strongly oriented to the practice of selection, assessment and
development, and is particularly keen to publish articles in which rigorous
research is presented in a way likely to inform and influence the work of
practitioners. It also seeks articles from practitioners drawing on their
experience to indicate how practice can be improved.
SDR is not intended to be an academic journal. Articles are reviewed by the
editorial team for their relevance, rigour and intelligibility, but not all papers
are referred to independent referees. The aim is to get new, practitioner-
relevant data and ideas into print as quickly as possible. SDR is also open to
book reviews in its area.
The Editorial Team aim to give a platform for a range of views that are not
necessarily their own or those of the British Psychological Society. Articles
(2000 words maximum) should be sent as an e-mail attachment, saved as a
text or MS Word file, containing author contact details. References should
follow the Society’s Style Guide (available from the publications page of the
Society’s website: www.bps.org.uk).
The perfect storm of attrition
THE MUCH VAUNTED war for talent is hitting
firms hard, with a lack of available talent threat-
ening to become the biggest single barrier to
growth for firms over the next three years.
A recent survey by the Chartered Institute of
Personnel and Development (CIPD) reported
that the overall employee turnover rate for the
UK is 18.1 per cent, with the highest level of
turnover (22.6 per cent) in the private sector
(CIPD 2007). The average turnover rate for the
public sector is 13.7 per cent. Such rates of
employee turnover can be costly for organisa-
tions. For example, Stokdyk (2007) reported
that reducing employee turnover by one per
cent saves the Royal Bank of Scotland around
£30m in attraction costs.
Organisations face a perfect storm – trouble
attracting skilled talent and a rising rate of staff
leaving. In this environment companies often
find themselves behind the ball and reacting to
attrition. While managing the organisation’s
employment brand helps attract potential staff,
existing tools may not be enough. Those organi-
sations that respond best are likely to be those
which develop more effective retention strate-
gies and a better understanding of the needs and
motivations of their employees.
Companies need to get well ahead of the attri-
tion curve and smart organisations are devel-
oping new approaches to deepen their
understanding of staff motivation and behaviour
and to predict who is likely to leave in advance.
Rather than react when talented staff have
already gone, new predictive tools provide them
with the chance to intervene and prevent staff
leaving.
Winsborough has already helped one large
military organisation in New Zealand to develop
a ‘smart weapon’ in the war for talent. This was
done by adding predictive intelligence to
existing technology – the climate survey.
Climate, or staff satisfaction surveys have become
fairly common in corporate life in the last
decade – but very few firms extract the value
from them that is available.
Such surveys suffer from the ‘rear view mirror’
problem – they tell you how things were. But
organisational leaders need to know what is
going to happen – and its high time survey infor-
mation came with predictive power.
A deeper understanding of leavers
As with all consulting projects the work
proceeded in somewhat piecemeal manner – as
we uncovered more interesting findings the
client was prepared to sanction more analysis.
This makes for a disjointed methodology in
hindsight, but for an engaging project.
There were three broad steps in this work:
1. Isolating and refining factors in the climate
survey that accounted for intentions to quit.
2. Modelling these factors to confirm causality.
3. Translating these causative factors into a series
of ‘additive’ risk scales with cut scores to
predict individuals real-world leaving
behaviour.
Step 1: Isolating and refining useful
factors
To identify potential leavers we need to under-
stand what it is that causes some people to leave
an organisation while others stay.
The NZ military organisation consists of more
than 4000 people. It conducts a regular survey of
staff attitudes to work on a rolling basis – that is,
surveys are conducted on a sample of about 30
per cent of staff each year, and all staff are
surveyed once over a three year cycle.
Selection & Development Review, Vol. 24, No. 2, 2008 3
SDR
Preventative defence against
attrition: Engaging ‘on the
fence’ employees
Dave Winsborough,
Mina Morris & Mike Hughes
4 Selection & Development Review, Vol. 24, No. 2, 2008
Working with five years of historical survey
data we started our analysis by using the scales
administered by the organisation over this
period. However, we observed only a weak rela-
tionship between ratings on these scales and a
criterion ‘Intentions to Quit’ scale that was also
administered to participants.
We suspected that there were underlying
factors which would have a better relationship
with the criterion. We therefore conducted an
exploratory principal axis factor analysis. Six
factors were identified as accounting for signifi-
cant portions of the variance. We then refined
these factors by selecting items that led to
greater internal consistency using Cronbach’s
Alpha, while ensuring that ratings on each indi-
vidual scale remained as close to a normal distri-
bution as possible.
We then turned to the criterion, ‘Intentions to
Quit’ and, treating it as a dependent variable,
regressed the six factors against it. This proce-
dure improved the amount of variance
accounted for to well above that achieved using
the original scales in the organisation’s climate
questionnaire.
The six factors we extracted were:
● Military Belonging;
● Work-Life Balance;
● Respectful work environment;
● Involved Management;
● Job satisfaction;
● Anomie. The underlying set of items had
made up the a priori commitment scale but, a
subset of items unexpectedly loaded on this
separate factor. It describes a psychological
state that people enter into before leaving
(e.g. ‘I think joining was a mistake’).
These results gave us a good understanding of
the factors that play a part in an individual’s deci-
sion to exit the organisation.
Step 2: Modelling causality
Because we sought to predict leavers we then
moved on to use our regression work in a struc-
tural equation model (SEM)1
to explain how
these elements combine to predict intentions to
leave. SEM explains in order the causative steps of
the journey staff take en route to exiting the
organisation.
To develop our SEM we used a conceptual
framework to explain attrition, based on
Schneider’s Attraction, Selection and Attrition
model2
(Figure 1).
Through a process of experimentation with
our factors, we built a model that was judged
both conceptually and statistically valid. Three
measures of fit – Chi-square, Root Mean Square
Error of Approximation (RMSEA), and
Comparative Fit Index (CFI) all indicated the
model was sound. Figure 2 represents our model.
Working from left to right it tells the story of how
people come to exit the organisation.
This model showed us that satisfaction with
work and the feeling of connection to the organ-
isation diminish as a result of poor management
and of not feeling respected. Only if these condi-
tions exist will staff begin to feel isolated in the
organisation and anxious about staying in it.
In this case we were able to demonstrate that
it was not the pull of plentiful jobs that resulted
in staff exit. Rather, it was a combination of poor
management, work intruding on home life (very
relevant in this organisation) and low levels of
respect at work (which included seeing or expe-
riencing bullying and harassment) that over-
came the friction factors of organisational
belonging and the pleasure of the job itself.
Therefore, we were satisfied with not only the
statistical validity of our model but also with its
real world application in this organisation.
Step 3: Predicting leavers
Knowing what is going on is not the same as
doing something about it. We wanted to use our
deeper understanding to predict who will leave
by testing the model against our real-world
knowledge of who had left and who had stayed.
In medicine, the concept of cumulative risk
based on a series of factors is well understood.
Too much fatty food, not enough exercise,
smoking and a history of heart disease produce a
cumulative increase in the risk of heart attacks.
We reasoned that the general principle of
accumulated risk might be applied to people
leaving the organisation; if you experience more
of the push factors identified, won’t you be more
likely to leave?
1
See Kline, R.B. (1998), Principles and Practices of Structural Equation Modelling, The Guilford Press, New York. SEM serves purposes
similar to multiple regression, but in a more powerful way which takes into account the interactions, correlated independents,
measurement error, and latent dependent factors. SEM is a more powerful alternative to multiple regression and analysis of
covariance. See also: http://en.wikipedia.org/wiki/Structural_equation_modelling for a concise and intelligible account of SEM,
bearing in mind that the writer is a self-appointed authority.
2
See Schneider, B., Goldstein, H.W. & Smith, D.B. (1995). The ASA Framework: An Update. Personnel Psychology, 48, 747–779.
Selection & Development Review, Vol. 24, No. 2, 2008 5
Figure 1: Attraction, Selection and Attrition Model.
Figure 2: The path out the door.
Involved
management
Work/home
balance
Respect
Organisational
belonging
Job
satisfaction
Anomie
Intentions
to quit
Bolded variables accounted for most variance.
Push Factors
e.g. bad
management
Friction
Factors
e.g. loyalty,
liking my job
Pull Factors
e.g. good job
prospects
in other firm
Since the people who had already left the
organisation were known (an ‘Exited’ factor), we
examined what risk factors, both in isolation and
together, were needed to cause someone to leave.
To do this we had to work backwards. There
was a weak relationship between the ‘Intentions
to Quit’ scale and people who exited the organi-
sation, but we sought to identify the combination
of the scales (or ‘risk factors’), using our struc-
tured equation model which would account for
the largest number of those who exited.
We therefore experimented with various cut-
off scores on the scales that might be used to
separate people with high likelihood of exiting
from those with low likelihood. This led us to an
optimal calibration, a score above which there
was a maximum likelihood that a person would
appear on the ‘exit’ list over the next two years.
At this point we had to ask ourselves a ques-
tion – what if the risk factors were limited to a
select few who scored low on relevant items
(cumulatively indicating high risk of leaving),
but then exited by chance (i.e. non-related
reasons)? Although our sample was large, more
than 1000 observations, this could still be math-
ematically possible.
To counter this, we created a dummy set of
data that was randomly generated but that
matched the general distribution of our existing
data. We then tested our scale cut-off scores on
this new simulated data, which also reflected
what the organisation will do in practice from
this point on. Our predictions still held up, and
the risk scores in ‘red’ indeed corresponded to
high scores on the simulated ‘Intentions to Quit’
scale.
6 Selection & Development Review, Vol. 24, No. 2, 2008
A risky business
Our access to historical data over a number of
years on who had left the organisation and why,
enabled us to test the predictive power of our
model
If we assessed who scored high on the risk
factors in say 2004, could we predict who would
leave in 2006? Yes, we could.
And what about our hunch in relation to accu-
mulated risk? This was also true – as an indi-
vidual accumulates more risks (higher scores on
the critical scales we identified from the climate
survey) the chances of them leaving in subse-
quent years soared.
In fact using one risk factor we could identify
approximately only 10 per cent of those who
would appear on the ‘quit list’ in the next two
year. But if they accumulated four risks or more,
we could correctly identify 66 per cent of those
on the list of leavers in the next year. Conversely,
using accumulated low scores on risk factors we
could identify around 94 per cent of those who
would stay. Full data are presented in Table 1.
Also included are the percentage of staff identi-
fied in the ‘high’ range on the intentions to quit
scale. While, using the risk factors identified from
the climate questionnaire, we could identify
correctly nearly 90 per cent of those who would
score high on intentions to quit, this scale was not
a good predictor of those who would actually go.
To interpret this table, recall that we calculated
their risks in one year, and then looked at who
actually left over the subsequent two years.
There are a couple of points to note. The
intentions to quit scale, often used in the litera-
ture as a proxy for ‘risk of leaving’ is not, in this
case associated in a direct way with actual exits.
On the other hand, accumulating risk factors
seems to operate in a ‘catastrophic’ manner past
a ‘tipping point’ – up to three risks means you
may indeed score in the ‘high’ range on the
intentions to quit scale but will not actually leave.
Four risks, however seems to tip people over a
threshold, and we can correctly identify more
than 65 per cent of those who will actually leave
over the next two years.
We are now in a position to estimate in
advance when there is a high likelihood that
someone will go, thus creating a window of
opportunity during which the organisation can
intervene to prevent it happening.
Building smart weapons to prevent
attrition
Based on an individual’s scores on key items in
the climate survey, we can now identify the risk
they will leave the organisation in the next two
years. Armed with this knowledge the organisa-
tion is now in the process of developing a range
of reports for staff, for organisation leaders and
for business unit managers. While confidentiality
issues need to be taken into account and
managed to protect individual identity, the kind
of analysis we have undertaken can open up a
range of new uses for climate reports
Table 1: Relationship between number of risks, intentions to quit and actual exit.
Accumulated Per cent categorised Actually exited in
no. of Risks correctly in ‘high’ range next two years
of Intentions to Quit
0 3.9 per cent 6 per cent
1 16.5 per cent 9.6 per cent
2 39.7 per cent 14.3 per cent
3 66.7 per cent 13.3 per cent
4 88.9 per cent 66.7 per cent
For example, managers will receive a
summary of the number of ‘at risk’ individuals in
their group, compared to the organisation
overall. This enables a number of actions. They
can consider who they believe may be at risk of
leaving and actively seek them out to discuss
their thinking and plans. Since we also know that
poor management is a significant push factor,
managers can reflect on their own actions and
managerial style. The organisation in turn can
watch for excessive risks and help managers to
resolve workplace issues before it leads to signif-
icant attrition.
Perhaps the most interesting report might be
a report for staff. Typically the people who
complete climate surveys don’t find out what the
staff survey said beyond an anodyne summary of
whole organisation responses. Our client is
considering whether individual staff will receive
a confidential summary of their own responses
compared to the organisation as a whole. This
report may include a rating (high, medium, low)
of their risk of leaving the firm over the next few
years. A high risk rating might be accompanied
with advice to talk to their manager, to a mentor
or to HR. Again, such a report needs to be sensi-
tively worded so as not to crystallise intentions to
leave and convert them to action!
Finally, organisation leaders will receive a
report summarising trends in predicted attrition.
Particular business units can be identified as
having similar issues. Perhaps one manager will
stand out as a problem, or a particular demo-
graphic will be seen to be disproportionately
represented. Executives can then tune policies
or direct interventions targeted at the specific
problem – rather than take a scatter gun
approach after people have left.
References
Chartered Institute of Personnel and
Development (2007). Annual Survey Report
2007. Recruitment, Retention and Turnover.
Stokdyk, J. (2007). Case study: Human capital
management at Royal Bank of Scotland.
Available at www.hrzone.co.uk
Correspondence
Dave Winsborough is a Registered Psychologist
(NZ) and Director of Winsborough Limited, a
New Zealand based company specialising in
improving individual and organisational
performance. He can be contacted at
dave@winsborough.co.nz
Mina Morris is an organisational psychologist
with Innovative HR Solutions, Dubai.
He can be contacted at minamorris@gmail.com
Mike Hughes is a Registered Psychologist (NZ)
and Senior Consultant with Winsborough
Limited. He is also a Chartered Occupational
Psychologist and can be contacted at
mike@winsborough.co.nz
Selection & Development Review, Vol. 24, No. 2, 2008 7
8 Selection & Development Review, Vol. 24, No. 2, 2008
WE WERE INTERESTED in the interactions
between employees’ general happiness, the
amount of overtime they worked, the amount of
sick leave they took and their intention to stay or
quit, to inform our coaching practice and
management practices more generally.
Happiness, or subjective well-being of employees
has, not surprisingly, been shown to bring bene-
fits to employers as well as employees and
evidence suggests that the happiness is a pre-
condition for good work performance and
career success (Boehm & Lyubomirsky, 2008).
From the employer’s perspective, overtime may
appear to be a means of increasing the produc-
tivity of employees. However, in the longer term,
persistently working long hours may undermine
happiness and well-being. Through producing
impaired motivation, chronic fatigue and
impairment of health it may, in turn, leads to
falling productivity and absenteeism.
Absenteeism is a major issue, costing the UK
economy over £13.2 billion in 2006 (CBI, 2007).
Employees’ loss of a sense of well-being through
excessive overtime may also lead to them leaving,
at great cost to the organisation that loses the
benefits of their skill and experience.
Past research has investigated overtime or
absenteeism, but these have been related to job
satisfaction which is a narrower concept than
happiness. Most of this research was done from
the employers’ perspective and before measures
of well-being were developed.
Briefly, early research into the relationship
between overtime and job satisfaction yielded
equivocal findings. Recently, Wegge et al. (2007)
found the relationship to be complex as it
depended on employee attitudes and levels of job
engagement. While high job satisfaction is associ-
ated with fewer days taken off sick by individuals
(Lyubomirsky et al., 2005) and low job satisfaction
indicates a higher probability of employees
leaving (Clark, 2001), the literature on the rela-
tionship between absenteeism and overtime is
sparse and inconclusive (Brown, 1999).
The aim here was to explore these relation-
ships with a context free measure of happiness,
and find any interactions between these factors,
with contemporary employees, that might guide
management practices.
Methodology
We carried out two different questionnaire
surveys with two groups of respondents.
Both groups had a similar composition of
respondents who were currently employed and
mostly were managerial staff or MBA students.
Thus our findings may not be generalisable across
other working populations. The first group
comprised 127 respondents, 66 (52 per cent) of
whom were men. The second group included 193
respondents, of whom 126 (65 per cent) were
men. Both groups had similar age profiles (e.g. 40
per cent aged 31–40 years) and ethnicity (80 per
cent Caucasian, 15 per cent Asian) profiles.
The first questionnaire specifically assessed
happiness, overtime, sick leave and intention to
stay. The second was broader but included the
same key questions. This included the General
Happiness Scale (validated by Lyubomirsky &
Lepper, 1999; see Table 1). We used the scores on
this scale to divide respondents’ into low, medium
or high happiness groups (see Table 2) as a basis
for investigating differences related to amount of
overtime, sick leave and intention to stay.
Overtime was assessed in terms of average hours of
overtime per week. In the first questionnaire we
also asked if the overtime took place at work or at
SDR
Relationships between employee
happiness, overtime, sick leave
and intention to stay or leave
Laurel Edmunds &
Jessica Pryce-Jones
home and whether it was paid or unpaid. We also
asked respondents to check, on a questionnaire
adapted from Tucker and Rutherford (2005), for
which of seven reasons overtime was worked (to
increase earnings, overtime culture, belief in job,
job enjoyment, progress in career, overtime not
due to poor time management, work pressure and
deadlines). Sick leave was assessed in terms of
reported number of days taken between
1 January 2006 and the questionnaire administra-
tion (either October, 2006, or July–October,
2007). We relied on self-reported sick leave data
for two reasons; firstly Johns (1994) showed that
the relationship between self-reported and true
absenteeism was reasonably accurate; secondly,
this approach avoids privacy and disclosure issues
that may have biased the randomness of the
sample. Length of time in post and how long they
intended to stay in post were requested of respon-
dents using four time periods. Data collection took
place between Autumn, 2006, and Spring, 2007,
and between the Summer and Autumn of 2007.
Findings and discussion
There were no significant differences between
the two survey groups in terms of general happi-
ness (t-test: p=0.691), intention to stay (t-test:
p=0.063) sick leave (Mann-Whitney: p=0.735).
However, respondents in the first survey reported
more overtime per se (97 per cent vs. 75 per cent),
and more hours of overtime per individual (10.5
vs. 7.3; p<0.001). There was more focus on over-
time in this group, which may have caused these
respondents to over-report, although the samples
were not different in other respects.
Happiness
The mean happiness scores, on a scale of 1 to 10,
were 6.6 (SD 1.8) in the first survey and 6.5 (SD
1.7) in the second. These were similar to the
British Household Panel Survey Life Satisfaction
findings for 1997-2003 which reported a modal
rating of 6 (means were not given) and our find-
ings in a further sample (Mean rating 6.4, SD 1.8;
n = 600+). The three happiness groups we divided
our sample into had mean rating ranges of 0-6.0,
6.1-7.0 and 7.1-10 respectively (see Table 2).
Overtime
Eighty-four per cent of respondents across both
survey groups reported doing overtime. In the first
group over 80 per cent of individuals working
overtime did not receive payment for it.
Interestingly, those who were paid did significantly
less overtime (predominantly women). Overtime
did not vary with location. The reasons for working
overtime, given the highest scores were a ‘belief in
the job’ and ‘job enjoyment’. ‘Increase in earn-
ings’ was also offered as an option, but this was not
rated highly even by the 17 per cent of respon-
dents who received payment for overtime.
Intrinsic reasons for doing overtime (belief in
job, job enjoyment and career progression)
appeared to be more relevant than increased
earnings. Perhaps, in addition to reasons in the
first survey, those choosing to work overtime do
so either because they find it intrinsically
rewarding, or to gain recognition, or because
they self-select jobs that tend to demand over-
time. This may be truer for employees, such as
managers, where they have some autonomy and
Selection & Development Review, Vol. 24, No. 2, 2008 9
Table 1: The General Happiness Scale.
The General Happiness Scale
1. In General I consider myself: 1 = not a very happy person
to 10 = a very happy person.
2. Compared to most of my peers, I consider myself: 1 = less happy to
10 = more happy.
3. Some people are generally very happy. They enjoy life regardless 1 = not at all to
of what is going on, getting the most out of everything. 10 = a great deal
To what extent does this characterisation describe you?
4. Some people are generally not very happy. Although they are not 1 = a great deal to
depressed, they never seem as happy as they might be. 10 = not at all
To what extent does this characterisation describe you?
Score = (1 + 2 + 3 + 4)/4
10 Selection & Development Review, Vol. 24, No. 2, 2008
the possibility of changing their jobs and
progressing their careers. Brett and Stroh (2003)
also found male managers were motivated by
intrinsic and extrinsic (financial) motivations,
whereas Tucker and Rutherford (2005) found
financial rewards to be more important to train
drivers. Therefore the importance of financial
rewards is likely to depend on context and may
be dependent on perceived career prospects.
Sick leave
Fifty per cent of respondents in the first survey
and 53 per cent in the second reported taking
no sick leave in the periods for which informa-
tion was requested (9–10 and 15–18 months).
Three respondents reported long term illnesses
(over 90 days) and were omitted from the
analyses. The average period of sick leave was
just over two days in both surveys. The analyses
were carried out with a subset of respondents
(Survey 1: N=37; Survey 2: N=85).
Inter-relationships (see Table 3)
1. Happiness and overtime
In the first survey we found no significant rela-
tionship between general happiness and over-
time. However there were significant
relationships between reasons for overtime and
general happiness. The other comparison was
reasons for overtime across happiness groups.
The main finding here was that low happiness
employees rated ‘job enjoyment’ significantly
lower than the other two groups. In the second
survey there was a weak, but significant positive
relationship between happiness and overtime.
We also saw a trend for employees with higher
happiness scores to do more overtime, but this
did not reach significance in this survey.
2. Happiness and sick leave
There was no relationship between sick days and
general happiness in the first survey, but there
was a negative one in the second (–0.243;
p=0.001). We found little evidence of any differ-
ences between happiness groups in terms of sick
days in either study, possible due to the low
numbers of respondents. When we combined
the surveys (N=317), the least happy reported
taking more days off sick.
3. Happiness and intention to stay
Both surveys showed a significant relationship
between happiness and intention to stay in post.
In the first survey the least happy group
intended to stay for a shorter period of time than
those in the medium and high happiness groups,
but group means for time intended to stay were
similar across happiness groups in the second
study. Intention to stay was not related to over-
time variables or sick leave.
4. Overtime and sick leave
There was no relationship between these vari-
ables in either survey. We also looked for
patterns between reasons for overtime and sick
leave in the first survey. The well-being of an
employee who is happier through gaining
intrinsic rewards from their work (e.g. by getting
in ‘flow’ see Csikszentmihalyi, 1975) may actually
benefit from doing overtime. Excessive overtime
may potentially lead to the negative outcome of
more sick leave. Excessive overtime may result in
over-tiredness and ‘burnout’ resulting in
absence from work. The stress arising from
working under a lot of pressure, while lacking
job security and autonomy around how they do
their job may also lead to an individual experi-
encing health problems (e.g. see Faragher, Cass
& Cooper, 2005). However, this was not apparent
in our respondents and so we could not test this
further.
A summary of findings above and some addi-
tional relationships are shown in Table 3.
Table 2: Descriptives for the General Happiness Scale and happiness groups in both surveys.
Survey 1 Survey 2
Happiness Group N Mean score N Mean score
General (total sample) 126 6.6 191 6.5
Low 49 4.8 72 4.7
Medium 37 6.9 72 7.0
High 40 8.5 47 8.5
Selection & Development Review, Vol. 24, No. 2, 2008 11
Table 3: Summary of significant relationships between happiness, overtime, sick leave and
intention to stay for both surveys.
Correlation between principle factors in italics. Correlational sub-analyses under factors and results of
comparison between happiness sub-groups using ANOVA in regular font.
Overtime Sick leave Intention to stay
Happiness Weak positive Negative Positive
R=0.080; p=0.180 R=–0.185; p=0.003 R=0.216; p=0.000
2nd survey: p=0.195; p=0.011
With reasons for
working overtime:
job enjoyment:
R=0.350; p=0.000
belief in job:
R=0.202; p=0.027
work pressure:
R=-0.215; p=0.017
Anova Happier work more Least happy take Least happy intend
comparing overtime: more sick leave: to leave sooner:
happiness F=4.172; p.017 F=2.955; p=0.054 F=6.389; p=0.002
groups
Overtime NS NS
Reasons for working Reasons for working
overtime with sick leave: overtime with staying:
all ns all ns
Relationship suggested by U-shaped relationship with
pattern of data, but not those intending to
validated statistically: stay more than 3 years
Individual with high belief and less than 6 months
in and enjoyment of job doing more overtime (ns)
and who are good at
meeting deadlines and
time management,
take fewer sick days.
Sick leave NS
Anova Those intending to
comparing stay take fewer
‘intend to stay’ sick days:
vs. ‘don’t intend F=4.702; p=0.005
to stay’
Gender and age differences
In Survey 1 men (52 per cent) reported signifi-
cantly more overtime hours and females
received more payment for overtime. Overtime
impacts on family life, which may explain why
women were more likely to be paid in compen-
sation. Also women may be in lower status jobs
where payment is more likely. Men reporting
more overtime were also evident in Survey 2 (65
per cent), but this did not reach significance.
Reasons for overtime in the first survey did not
differ significantly between the sexes with one
exception that men rated ‘progress in career’ far
higher than women. Typically, in our larger data-
bases, men report significantly more overtime,
take fewer sick days and intend to stay longer in
their jobs compared with women. Any anomalies
here may be due to relatively small survey
samples. Location of overtime and intention to
stay did not differ between the genders.
12 Selection & Development Review, Vol. 24, No. 2, 2008
There were fewer differences between the age
groups. Those reaching significance were older
respondents reporting greater ‘belief in job’ and
‘job enjoyment’. They also intended to stay in
post longer in the first survey, whereas those less
than 21 years old intended to leave sooner in the
second, which corresponds with other data
(Clark, 2001).
One might intuitively expect an interaction
between general ‘happiness’, ‘levels of over-
time’, ‘sickness absence’ and ‘intention to leave’,
which managers should take into account in
trying to optimise organisation performance.
Surprisingly, we found no other studies that had
investigated how these four variables interact.
Although the association is quite weak, the posi-
tive relationships that we found between ‘happi-
ness’, ‘overtime’ and ‘intention to stay’ and the
negative one between happiness and sick leave,
together with the close association between
‘belief in the job’ and ‘job enjoyment’, sit
comfortably with the findings of Boehm &
Lyubormirsky (2008) that ‘happiness’ or ‘well
being’ pre-dispose employees to be productive
and successful. As well as supporting these
results, our findings give some support to the
proposition that employees who are happy in
and committed to their jobs, may happily work
overtime for no extra pay, with no adverse conse-
quences in terms of increase sickness absence or
increased likelihood of leaving. However, this
requires more investigation, particularly of the
boundary conditions beyond which the amount
of overtime has adverse consequences, however
committed the employee is to start with.
It is general unhappiness (probably
contributed to by negative feelings about the
job) that is likely to lead to increased sickness
absence and intention to leave, irrespective of
overtime worked. This study adds support to the
proposition that managerial practices and work
environments that generate positive emotion, a
sense of well-being and commitment are benefi-
cial to both employers and employees and allow
additional demands to be made on employees at
time of need, with minimal cost (there may be
some cost in terms of distracting people from
commitments outside of work) to either the
employees or the organisation.
References
Boehm, J.K. & Lyubomirsky, S. (2008). Does
happiness promote career success? Journal of
Career Assessment, 16, 101–116.
Brett, J.M. & Stroh, L.K. (2003). Working 61
plus hours a week? Why do managers do it?
Journal of Applied Psychology, 88, 67–78.
Brown, S. (1999). Worker absenteeism and
overtime bans. Applied Economics, 31, 165–174.
CBI (2007). Absence and labour turnover survey
2007. London: Confederation of British
Industry.
Clark, A.E. (2001). What really matters in a job?
Hedonic measurement using quit data.
Labour Economics, 8, 223–242.
Csikszentmihalyi, M. (1975). Beyond boredom and
anxiety. San Francisco: Jossey-Bass.
Faragher, E.B., Cass, M. & Cooper, C.L. (2005).
The relationship between job-satisfaction and
health: A meta-analysis. Occupational and
Environmental Medicine, 62, 105–112.
Johns, G. (1994). How often were you absent?
A review of the use of self-reported absence
data. Journal of Applied Psychology, 79, 574–591.
Lyubomirsky, S. & Lepper, H. (1999).
A measure of subjective happiness: Preliminary
reliability and construct validation. Social
Indicators Research, 46, 137–155.
Tucker, P. & Rutherford, C. (2005). Moderators
of the relationships between long work hours
and health. Journal of Occupational Health
Psychology, 10, 465–476.
Wegge, J., Schmidt, k-H., Parkes, C. & van Dyck,
R. (2007). ‘Taking a sickie’: Job satisfaction
and job involvement as interactive predictors
of absenteeism in a public organisation.
Journal of Occupational and Organisational
Psychology, 80, 77–89.
Correspondence
Laurel Edmunds
Head of Research, iOpener Ltd,
Twining House, 294 Banbury Road,
Oxford OX2 7ED.
Tel 01856 517785
E-mail: laurel.edmunds@iopener.co.uk
ALMOST A DECADE AGO Selection and
Development Review published ‘360 Feedback – for
once the research is useful’ (Goodge and Burr
1999). It reviewed the research on 360 Feedback,
and found it surprisingly helpful to practitioners.
Very briefly, Goodge and Burr concluded…
● 360 often has positive outcomes, and the
benefits are sustained. However, some 360
interventions adversely affect people and
performance.
● Below average performers benefit most from
360, but the small percentage of worst
performers don’t improve.
● The key things to get right are clear/relevant
questions, feedback from eight or more
people, and ensuring some critical feedback.
● Feedback reports should be simple and visual2
with few, if any, averages or graphs3
. ‘Expert’
comments on reports don’t help - individuals
need to draw their own conclusions.
Nothing in the more recent research conflicts
with those conclusions; some of the new research
provides further support for them. In particular,
there is a growing body of evidence for 360’s
positive impact (see Walker & Smither, 1999)
however there are some important new things to
think about.
Broadly, the current research addresses three
areas: self-awareness, performance improve-
ment, and what might be described as ‘noise’ in
360 Feedback.
Self-awareness
In the research, self-awareness is often measured
by the difference between the ratings given for
an individual and his/her own ratings. If a
person rates him/herself similarly to the ratings
given by others he/she is considered to be more
self-aware. It’s a crude measure, but an impor-
tant one.
Self-awareness may influence performance.
Fletcher’s (1997) helpful review of self-awareness
research concluded ‘Some evidence suggests
that greater self-awareness… is linked to…
higher performance’. More recent research has
confirmed that those with greatest self-awareness
tend to be the strongest performers (Ostroff et.
al., 2004).
Low self-awareness might result in an indi-
vidual rating his/herself more favourably than
others do – so-called ‘overrating’. Or, rating
him/herself more critically than others – ‘under-
rating’. It’s an important distinction, because…
● Extreme overrating might be associated with
poor performance (Atkins & Wood, 2002).
● It may be that those who overrate themselves
benefit more from 360 Feedback. Johnson &
Ferstl (1999) found that 360 improved over-
raters’ self-awareness – their self-assessment
became more modest whilst the ratings given
by others became more favourable.
● Over-raters tend to be particular kinds of
people: male, older, better paid, confident
and innovative (Ostoff et al., 2004; Warr &
Ainsworth, 1999).
Over-rating seems specific to some competen-
cies. An individual who overrates him/herself
tends to misjudge his/her interpersonal skills,
e.g. leadership, sensitivity. Technical competen-
cies do not seem to be over-rated (Warr &
Ainsworth, 1999).
It is probable that good self-awareness enables
a person to work with others more effectively.
Accurate perceptions of how others see you helps
anticipate their reactions to your ideas and deci-
sions and judge how you might best influence
Selection & Development Review, Vol. 24, No. 2, 2008 13
SDR
360 Feedback – once again the
research is useful!
Peter Goodge & Jane Coomber1
1
Our thanks to Senate House and Birkbeck libraries for their help during the development of this article.
2
A simple traffic-light format with critical ratings in red and favourable ratings in green works well. There is an example at
www.simply360.co.uk/samplereport.pdf .
3
The research suggests that averages for competencies and for respondent types (e.g. direct reports) have no psychometric
validity, but may hide important differences and patterns.
14 Selection & Development Review, Vol. 24, No. 2, 2008
them. There is also anecdotal evidence - the very
poor performers we coach are often clumsy with
people and decisions precisely because they have
mistaken views about others’ perceptions of them.
Performance improvement
A growing body of evidence suggests that 360
feedback works well if…
● The feedback itself suggests personal change
is needed.
Unsurprisingly, individuals who respond nega-
tively or angrily to critical feedback don’t
improve (Atwater & Brett 2006; Brett & Atwater
2001). However, without some differences
between a person’s view of him/herself and the
views of others there is no reason for them to
change. Johnson and Ferstl (1999) concluded
that managers ‘improve their performance to a
greater extent the more their self-ratings
exceed their subordinate ratings’.
● The individual and his/her organisation
values feedback and development.
Mauer et al. (2002) found that individuals
who believed they could improve tended to
value 360 feedback and engage in personal
development. Warr and Ainsworth (1999)
concluded ‘360 feedback is likely to be most
effective when it is part of a corporate culture
that supports ... its aims and procedures’.
● There is practical support for understanding
and using feedback.
In a five-year study, Walker and Smither
(1999) found that ‘managers who held feed-
back sessions to discuss their upward feedback
with direct reports, improved more than other
managers.’ And, they found ‘managers
improve more in years when they hold feed-
back meetings than in years when they do
not.’ Seifert et al. (2003) report significant
behaviour change when 360 feedback was part
of a facilitated workshop, but no change when
managers just received their feedback report.
A key aspect of support seems to be the provi-
sion of opportunities for individuals to
manage and interpret things for themselves.
Keeping and Levy (1998) found that attitudes
to 360 were significantly affected by the extent
to which individuals could express their opin-
ions and interpretations.
Smither et al.’s (2005) impressive meta-analysis
of 360’s impact drew similar conclusions about
the importance of feedback suggesting change, a
positive development culture and practical
support.
Interestingly, Goodge (1995) found very
similar things to be important with development
centres. Centres that provided clear, critical feed-
back, helpful coaching, and post-centre support
had significantly better outcomes. Perhaps
there’s a bigger message here?
Noise
The 360 feedback a person receives doesn’t just
depend on his/her skills and abilities; many
other factors influence the ratings. In particular,
who gives the ratings matters. For example,
Ostroff et al. (2004) found that women gave
more favourable ratings; hence more women
completing questionnaires for an individual
meant the more favourable feedback. And,
Murphy et al. (2004) showed that a rater’s reason
for giving feedback influenced his/her ratings
even when observing the same performance.
In most 360 feedback there is probably a great
deal of noise. Perhaps more noise than anything
else. Greguras et al. (2003) found ‘the combined
rater and rater-by-ratee interaction effects and
the residue effects were substantially larger than
the person effect’. In plain language, a person’s
feedback was more to do with who completes
questionnaires than the person’s abilities.
However, noise can be reduced. Fletcher et al.
(1998) demonstrated that good questionnaire
design transformed the psychometric properties
of a 360 questionnaire, which improved the
quality of feedback.
Implications for practice
What can we add to Goodge and Burr’s recom-
mendations of a decade ago? The new research
suggests three additional implications for
practice…
● Because 360 only works if it’s supported,
organisations need to plan briefings,
coaching, workshops and development
resources from the outset. 360 needs to be
part of a bigger, integrated project, not seen as
a stand-alone tool. With limited budgets and
resources it might be more cost-effective to
limit 360 feedback to smaller, targeted groups
of managers with whom it is done without
cutting corners.
It’s very naïve to buy 360 software, make it
available to hundreds of managers, and offer
minimal support. Yet, a worrying number of
organisations seem to do exactly that.
● Individuals need to own and influence their
360 feedback. In practice that might mean …
– Feedback on the competencies personally
important to the individual, not a set
completely prescribed by HR.
– The individual chooses who completes
questionnaires for him/her, not a predeter-
mined sample of direct reports, colleagues,
etc. We suggest individuals ask their key
‘customers’ to complete questionnaires,
and involve their manager when making
those choices.
– A simple feedback report that enables indi-
viduals to interpret feedback easily them-
selves. Complex reports are obstacles to
understanding and ownership. If an indi-
vidual can’t interpret his/her report for
themselves in five or 10 minutes we think
it’s too complicated.
– A coaching process that focuses upon
personal goals, and offers a variety of prac-
tical, relevant ways of improving perfor-
mance.
– The individual’s manager closely involved
from beginning to end. Managers also need
to own and influence their peoples’ feed-
back.
● Good questionnaire design to reduce 360’s
noise. The rules of good design are simple
and have been around for decades, but many
360 questionnaires seem to disregard them.
Very briefly, the rules are plain-English, one
specific, observable behaviour per question,
and explicit performance standards.
References
Atkins, P.W. & Wood, R.E. (2002). Self versus
others’ ratings as predictors of assessment
centre ratings: validation evidence for 360°
feedback programs. Personnel Psychology,
55(4), 871–904.
Atwater, L. & Brett, J. (2006). Feedback format:
Does it influence manager’s reactions to
feedback? Journal of Occupational and
Organisational Psychology, 79, 517–532.
Brett, J.F. & Atwater, L.E. (2001). 360 feedback:
accuracy, reactions, and perceptions of
usefulness. Journal of Applied Psychology, 86(5),
930-942.
Fletcher, C. (1997). Self-awareness – a neglected
attribute in selection and assessment?
International Journal of Selection and Assessment,
5(3), 183–187.
Fletcher, C., Baldry, C. & Cunningham-Snell, N.
(1998). The psychometric properties of 360°
feedback: an empirical study and cautionary
tale. International Journal of Selection and
Assessment, 6(1), 19–34.
Goodge, P. (1995). Design options and
outcomes. Progress in development centre
research. Journal of Management Development,
14(8), 55–59.
Goodge, P. & Burr, J. (1999). 360 Feedback –
for once the research is useful. Selection and
Development Review, 15(2), 3–7.
Greguras, G.J., Robie, C., Schleicher, D.J. &
Goff, M. (2003). A field study of the effects of
rating purposes on the quality of multisource
ratings. Personnel Psychology, 56(1), 1–21.
Johnson, J.W. & Ferstl, K.L. (1999). The effects
of inter-rater and self-other agreement on
performance improvement following upward
feedback. Personnel Psychology, 52(1), 271–303.
Keeping L.M. & Levy, P. (1998). Performance
appraisal attitudes: what are we really measuring?
Paper presented to the Annual Conference
of the Society for Industrial and
Organisational Psychology, Dallas. Reported
by Warr & Ainsworth (1999).
Maurer, T.J., Mitchell, D.R.D. & Barbeite F.G.
(2002). Predictors of attitudes toward a 360°
feedback system and involvement in post-
feedback management development activity.
Journal of Occupational and Organisational
Psychology, 75, 87–107.
Murphy, K.R., Cleveland, J.N., Skattebo, A.L. &
Kinney T.B. (2004). Raters who pursue goals
give different ratings. Journal of Applied
Psychology, 89(1), 158–164.
Ostoff, C., Atwater, L.E. & Feinburg B.J. (2004).
Understanding self-other agreement: A look
at rater and ratee characteristics, context and
outcomes. Personnel Psychology, 57(2),
333–375.
Seifert, C.F., Yukl, G. & McDonald, R.A. (2003).
Effects of multi-source feedback and a
feedback facilitator on the influence
behaviour of managers towards subordinates.
Journal of Applied Psychology, 88(3), 561–569.
Smither, J.W., London, M. & Reilly, R.R. (2005).
Does performance improve following
multisource feedback? A theoretical model,
meta-analysis, and review of empirical
findings. Personnel Psychology, 58(1), 33–66.
Selection & Development Review, Vol. 24, No. 2, 2008 15
16 Selection & Development Review, Vol. 24, No. 2, 2008
Walker, A.G. & Smither, J.W. (1999). A five-year
study of upward feedback: what managers do
with their results matters. Personnel Psychology,
52(1), 393–423.
Warr, P. & Ainsworth, E. (1999). 360 feedback –
some recent research. Selection and
Development Review, 15(3), 3–6.
Correspondence
Peter Goodge and Jane Coomber are partners
with Simply360.
E-mail: peter.goodge@simply360.co.uk and
jane.coomber@simply360.co.uk
This article is part of Simply360’s
free online 360 Handbook – see
www.simply360.co.uk/handbook
The 16PF User’s Group has become
THE PSYCHOMETRICS USER FORUM
an independently constituted users’ group which meets five times a year in central London.
The main aims of the Forum are:
● To extend and deepen understanding of BPS accredited
– personality instruments which map onto some or all of the Big Five factors;
– cognitive tests;
● To improve members’ skills in the use and interpretation of these measures;
● To keep up-to-date with research and developments in personality and cognitive reasoning
assessment.
Guest speakers have included Prof Dave Bartram, Dr Meredith Belbin, Dr Julian Boon, Dr Rob Briner,
Wendy Lord, Prof Fiona Patterson, Prof Steve Poppleton, Prof John Rust, Prof Peter Saville and
Dr Mike Smith.
You can join as a member or come as a visitor. Meetings are friendly and provide an opportunity for
networking.
For further information contact our administrator admin@leitzell.com
Background
IT IS GOOD PRACTICE to give people feedback
when they have taken a psychometric measure.
This has become a standard benchmark, is incor-
porated into the British Psychological Society’s
guidelines and is taught religiously on Level A
and B courses in Occupational Testing. However,
are we clear about what we mean by feedback?
Are there different situations that require (or
can accept) different kinds of feedback? Verified
Assessors for Levels A and B should be clear what
the guidelines are and be able to present a
consistent message. However, I believe that there
may be a variety of interpretations and/or opin-
ions within the industry and the psychologist’s
profession. I am, therefore, writing this to stimu-
late what I see as a necessary debate in order to
‘get the ferrets out into the open’ and leading to
more general agreement about what we should
advocate, when and why? This is overdue given
that the industry has undergone significant
change, current practice is more variable and
‘best practice’ needs to be clarified.
Historically a decision was made to allow
people other than psychologists to gain access to
psychometric instruments, which some may
regret. However the current situation introduced
through the Steering Committee on Test
Standards in the 1980s, is based on demonstrated
competence (safeguarded through the whole
Level A and B system). As a flagship system influ-
encing practice across Europe and the globe it is
important that the message delivered by different
Level A and B Assessors is clear and consistent. Is
our house in order – or do we need to challenge
some sacred cows along the way?
What has changed?
Firstly, we need to recognise that the backdrop
against which the original guidelines on feedback
were developed has changed. Clearly today there
is a far greater awareness and exposure to psycho-
metrics – as witnessed by the balance sheets of
test publishers and the number of qualified
people on the Register of Competence in
Psychological Testing. However, perhaps a more
important change is the way access to psychomet-
rics has increased through use of the internet.
This means that the original model of face-to-face
administration and feedback is being challenged
(and even flouted). The whole process can be
managed without any direct contact. Previously
this could be done using the postal system but
this was heavily frowned upon. The model in our
minds was face-to-face feedback and even tele-
phone feedback was barely acceptable. Anyone
who simply sent a report in the post was definitely
beyond the spirit of the guidelines (although I
know this happened and I do not know of anyone
being disciplined or struck off).
Why feedback is considered to be ‘best
practice’?
The reasons for the strict code concerning feed-
back can be summarised under three main head-
ings as follows:
● Respect for the individual – a person has
given their time to complete a psychometric
instrument and so deserves a chance to learn
and grow from their time investment (as long
as the feedback is done in an appropriate
manner).
Selection & Development Review, Vol. 24, No. 2, 2008 17
SDR
To give or not to give – that is
a difficult question
(Challenging assumptions regarding
feedback of psycholmetric tests)
Roy Childs
18 Selection & Development Review, Vol. 24, No. 2, 2008
● Validating the results – this is especially true
for the use of self-report questionnaires but it
also provides the ‘right of reply’ whereby
people can comment, add to, or challenge the
interpretations
● Reducing negative impact – if testing gets a
bad name people will stop using them.
Feedback can be seen as a way to
engage/persuade the individual that the
information is valid or that its use will be
appropriately integrated in order to provide a
balanced and holistic evaluation.
All of these are worthy aims with which I cannot
disagree. However, the mechanism for achieving
these aims can be debated. It also raises the ques-
tion of when is feedback not feedback?
What is feedback and how good does it
need to be?
The image I have of feedback is of two people
sitting together having an important conversa-
tion. It involves a purpose, some exploring of
certain information, attentive listening, correc-
tions to possible misunderstandings and it could,
potentially, challenge a person to think more
deeply about themselves. It also strongly implies
benefits for the individual. This picture makes it
very hard to see how anyone would not get most
benefit from this process being face-to-face rather
than using the phone, text messaging, video-
conferencing or simply reading written reports.
However, some years ago Team Focus was
involved in one of the first research projects to
evaluate the effect and benefit of video-confer-
encing as a way of providing psychometric feed-
back. I must say that the results surprised me.
The recipients not only valued the process, but
many expressed the fact that they felt they got as
much if not more than they expected – and they
did not expect the face-to-face option to be able
to deliver more. Such positive responses
certainly challenged my expectations. I there-
fore suggest that we should all remain open to
other forms of feedback (telephone, online chat
room, simple written reports) also adding value.
Is this a holy cow? Even if we believe that face-to-
face feedback is ‘the best’ should second best
options be offered on the basis that they never-
theless add value? Our current position could
put us in the position where excellence becomes
the enemy of the good.
An analogy could be considering how we satisfy
our thirst. If we picture a glass of water, how empty
does it need to be before we say it is not worth the
effort of drinking it? The parallel is how ‘full’ does
the feedback need to be or how much value does
it need to add? The internet has changed the
nature of access to psychometrics and to different
forms of feedback. Now is a good time to review
the principles and examine what we mean by
feedback and agree whether different situations
allow different forms of feedback.
What criteria do we use for deciding on
the right form of feedback?
A current principle guiding of the British
Psychological Society in its recommendations for
giving feedback, is that if people give up their
time they deserve something back. Alongside
this is the concept of adding value and avoiding
harm. How can we apply these to a situation
where a person chooses to give their time
knowing that the feedback they will receive is a
written report1
. Have they received feedback
(perhaps minimal and not interactive) which
adds value and does no harm? Does this meet
the guidelines or not?
Historically the guidelines were built around a
model of deep psychological constructs
requiring an ‘expert’ to interpret the results.
I believe that this model does not apply to all
situations today; two of which are described
below:
1. Some modern day questionnaires are better
described as competency frameworks that
have been put through some psychometric
analysis. ‘Persuasiveness’ or ‘Decisiveness’ may
cover complex syndromes of behaviour, but
they are not really deep psychological
constructs. In fact, they are multi-factorial
constructs covering a range of different attrib-
utes and skills and they are usually measured
quite simplistically in questionnaires. It is hard
to stretch their interpretation in terms of deep
psychological constructs and research.
2. Other questionnaires may be based on
psychological theory, but their interpretation
can be many layered, from quite straightfor-
ward to involving complex psychological
ideas. Some provide quite self-explanatory
reports that are written in a style designed for
end-user consumption.
1
Some people may argue that no-one should be allowed to complete any psychometric measure subject to this condition –
especially online – but the reality is that this does happen.
What constraints regarding feedback apply to
the two scenarios above – especially if the choice
to complete the questionnaires is self-solicited?
Is it possible that non-interactive feedback, whilst
not making best advantage of the information,
nevertheless adds value and does no harm?
Some of the factors we need to address in this
discussion are, therefore:
● Who is asking for the psychometric instru-
ment to be completed? – Is it different if it is
self-solicited by the individual (who believes
s/he will benefit from the process) versus
being asked for by a third party?
● What is being measured? – Is it different if we
are measuring personal values, behavioural
tendencies, behaviour under stress, ‘dark side’
tendencies, emotional reactions, emotional
intelligence, cognitive abilities, etc.?
● What is the purpose? – Is it different if the
person is asked to complete it by a third party
where the purpose is the individual’s interest
(as in a development context) versus the third
party’s interest?(as in a selection context).
● What is the hoped for outcome? –Is it
different if the hoped for outcome is to
address a broken marriage versus gaining a
few ideas about possible careers?
Perhaps we would benefit from exploring a shift
of perspective from the original one which asked
whether a person was qualified to use and give
feedback (and will not misuse the psychometric
instrument) to asking how the ‘client’ will
benefit from the feedback they receive.
Some suggestions for acceptable
guidelines
My own ideas concerning the ethics of giving
feedback are evolving. I still recognise that the
best job will be done using face-to-face contact
with experienced practitioners. However, when
do we need a Rolls Royce and when a Mini?
I recognise how people have got great value
from completing a questionnaire and receiving
other kinds of feedback. One of the most impor-
tant elements to consider is the purpose of the
feedback – and to differentiate when it is for the
benefit of a third party (as in selection) or for
the recipient. I would like to consider the
following as clarifying the guidelines, which
could then be presented as part of the Level A
and Level B process:
1. face-to-face feedback should be offered wher-
ever possible (logistically, financially and where
there is the motivation from the recipient)
2. where face-to-face feedback is not possible
some form of mediated feedback should be
offered (video conference, phone, MSN chat,
skype)
3. where only a written report is to be offered,
this should be restricted to situations where
the request for the psychometric instrument is
self-solicited and the results are for the indi-
vidual and not for any third party (although
the individual may choose to share with a
third party if they wish).
The judgements required for applying the above
and offering the minimum level of feedback
would involve evaluating the purpose, the status
of the information, the way an individual
chooses or is invited to engage with the process
and the nature and language of the written
reports. The British Psychological Society guide-
lines have often been interpreted to mean that
psychometric instruments should never be used
if only written reports are available – except that
this is often over-ruled when the results are to be
used purely for research. In such situations it is
not unusual for the contract up-front to involve
no feedback whatsoever. We therefore face the
whole gamut – from no feedback to intensive
face-to-face. Do we now need to become clearer
about the stages in-between and agree where we
should draw the line?
Correspondence
Roy Childs, C.Psychol AFBPsS, is Managing
Director of Team Focus Ltd and can be
contacted at e-mail: roy.childs@teamfocus.co.uk
and + 44(0)1628 637338.
Selection & Development Review, Vol. 24, No. 2, 2008 19
20 Selection & Development Review, Vol. 24, No. 2, 2008
ROY CHILDS’ discussion of issues relating to the
provision of feedback is a welcome and
thoughtful piece for consideration at a time
when test practice is undergoing very significant
changes. In particular, we are seeing the rapid
development of modes of test administration
that use the internet as the delivery medium and
which provide various participants in the assess-
ment process (test takers, personnel profes-
sionals, and line managers) with feedback in the
form of computer-based reports. While Level
A/B certified test users will still be able to access
full details of test scores, norms and related
reports, including outputs like personality scale
profiles, others receive a variety of different
products designed to cater for more specific
needs and more limited psychometric expertise.
The fact that practice has changed does not
imply that current practice is better or worse
than it was. It may be different and we may need
to re-consider the guidelines we provide in terms
of the principles that underlie them. What are
most important are the principles on which
guidelines or standards are based. Changes in
technology often require us to rethink what we
mean by good practice, but should not change
the basic principles underlying that practice.
In the article, there is much discussion about
current guidelines on giving feedback, but there
are no details of which guidelines are being
referred to. As a starting point to developing this
discussion it would be worth reviewing what the
various current guidelines actually say and then
consider the principles that underlay their
development.
What do the current guidelines
actually say?
The Society’s Code of Good Practice in Psychological
Testing, states that people who use psychological
tests are expected to:
‘Provide the test taker and other authorised
persons with feedback about the results in a
form which makes clear the implications of
the results, is clear and in a style appropriate
to their level of understanding.’
This does not say that you must always provide
feedback, but only that when you do it must be
in an appropriate form. Furthermore, this does
not imply that one always has to give feedback in
a face-to-face interview.
Level A and Level B (Occupational) standards
focus on the skills people need to develop in
order to give feedback effectively and safely.
They do not say that you must always provide
feedback but rather set out the skills and exper-
tise needed for when feedback is provided.
For Level A, Unit 6.
Does the Assessee provide feedback of informa-
tion about results to the candidate which:
6.10 is in a form appropriate to his or her under-
standing of the tests and the scales;
6.11 describes the meanings of scale names in
lay terms which are accurate and mean-
ingful;
6.12 provides the candidate with opportunities
to ask questions, clarify points and
comment upon the test and the administra-
tion procedure;
6.13 encourages the candidate to comment on
the perceived accuracy and fairness or
otherwise of the information obtained from
the test;
6.14 clearly informs the candidate about how
the information will be presented (orally or
in writing) and to whom.
Level B, Unit 5. Test Use: Providing feedback
The assessee:
5.1 Demonstrates sufficient knowledge of the
instrument to provide competent interpre-
tation and oral feedback to at least two
candidates in each case and to produce
SDR
Giving feedback to test takers
Dave Bartram*
* The author is grateful to Dr P.A. Lindley for her suggestions and comments on drafts of this paper.
balanced written reports for: (a) the candi-
date; and (b) the client – where the assess-
ment is being carried out for a third party.
5.2 Provides non-judgemental oral feedback of
results to candidates with methodical use of
the feedback interview to help confirm/
disconfirm hypotheses generated from the
pattern of individual test results.
5.3 Provides an indication to the candidate and
to the client (when there is a third party
involved) of the status and value of the
information obtained and how it relates to
other information about the candidate's
personality.
Similar issues relate to the EFPA (European
Federations of Psychology Associations)
Standards for Test Use. In EFPA standard 1.1.
‘Act in a professional and ethical manner’ it is
noted that:
‘1.1.d. You must ensure that you conduct
communications and give feedback with due
concern for the sensitivities of the test taker
and other relevant parties.’
Providing feedback is identified as an ‘essential
skill’ for EFPA Standard 2.5 ‘Communicate the
results clearly and accurately to relevant others’:
‘2.5.b. You must ensure that you discuss results
with test takers and relevant others in a
constructive and supportive manner.’
Again, the importance of having the necessary
skills and competence to conduct feedback is
stressed, but nowhere is it stated that feedback
must always be given, whatever the circum-
stances.
We find the same emphasis on how feedback is
given, rather than whether it is given, in the ITC
(International Test Commission) Test Use
Guidelines in Section 2.8. ‘Communicate the
results clearly and accurately to relevant others’.
This simply states that:
‘Competent test users will: [2.8.10] Present
oral feedback to test takers in a constructive
and supportive manner.’
Within Appendix A of the ITC Guidelines
(Guidelines for an outline policy on testing) it is
noted that a policy on testing should cover,
amongst other things, the provision of feedback
to test takers. It goes on to say that relevant
parties (which include test takers) need to have
access to and be informed about the policy on
testing and that responsibility for any organisa-
tion’s testing policy should reside with a quali-
fied test user who has the authority to ensure
implementation of and adherence to the policy.
Furthermore, in Appendix B, guidelines are
provided for developing ‘contracts’ between
parties involved in the testing process. This states
that the contract between the test user and test
takers should be consistent with good practice,
legislation and the test user’s policy on testing.
‘Test users should endeavour to:
b.5 inform test takers prior to testing about the
purpose of the assessment, the nature of
the test, to whom test results will be
reported and the planned use of the results;
b.6 give advance notice of when the test will be
administered, and when results will be avail-
able, and whether or not test takers or
others may obtain copies of the test, their
completed answer sheets, or their scores;
b.10 ensure test takers know that they will have
their results explained to them as soon as
possible after taking the test in easily under-
stood terms;’
The footnote to b.6 is actually very important in
that it states: ‘While tests and answer sheets are
not normally passed on to others, there is some
variation between countries in practice relating
to what test takers or others are permitted to
have. However, there is much greater variation in the
expectations of test takers concerning what information
they will be given [my italics]. It is important that
contracts make clear what they will not be given
as well as what they will.’
What is emerging here is an emphasis on the
need to establish a clear understanding with the
test taker before they take the test regarding
what they can expect in terms of feedback after-
wards. This becomes much more explicit on the
current draft of the standard being developed by
the International Standards Organization (ISO)
for assessment in work and organisational
settings, which addresses feedback as follows:
‘Whether feedback is provided or not and the
nature of that feedback, where it is to be
provided, shall be defined within the context
of organisational , legal, and cultural norms.
The people who are being assessed shall have
been notified of whether or not feedback will
be provided and the nature of the feedback,
if any, prior to the assessment taking place.’
Selection & Development Review, Vol. 24, No. 2, 2008 21
22 Selection & Development Review, Vol. 24, No. 2, 2008
The development of this wording is inter-
esting as it comes out of lengthy discussions
between a large body of international experts
and reflects differences in practice and legal
requirements in different countries. For
example, in the US it is general practice not to
provide detailed feedback to job applicants on
their test results (other than providing them with
information on whether they were selected or
not) as the purpose of the testing is regarded as
being non-developmental and there is perceived
to be a significant risk of litigation if people are
given feedback that they might use to challenge
the employer’s decision.
Computer-based reports and feedback
The ITC Guidelines on Computer Based and
Internet Delivered Testing (2006) discuss the
issue of using computer-generated reports
(CBTI – computer based test interpretation) in
the provision of feedback. The relevant section
focuses on the need to provide guidance on
giving feedback, training in the use of the report,
advice to test users on how to use the report and
the need for test users to consider all the prac-
tical and ethical issues associated with providing
feedback over the Internet.
The Society’s guidance on using online assess-
ment tools for recruitment state, in relation to
reporting and feedback, that;
‘Reports are typically used by recruitment
consultants or hiring managers who are not
trained test users. As lay users they need clear,
non-technical information in a form that
directly addresses the issues they are
concerned with. In recruitment, hiring
managers are concerned with the risks associ-
ated with a candidate in terms of likely fit or
lack of fit to the job requirements. Reports
should make clear the status of the informa-
tion provided, in terms of the confidence that
can be placed in it, and should always stress
the value of corroboration through the use of
multiple sources or methods of assessment.
Similar considerations should be taken into
account when designing reports for providing
feedback to candidates. Candidates should
always be provided with access to a qualified
test user if they have any concerns or issues
they need to raise that lie outside the compe-
tence of the hiring manager.’
Principles relating to feedback provision
I would like to suggest that what underlies all
these various guidelines are three main princi-
ples: Consent, accuracy and duty of care.
Regarding consent, the test taker has a right
to know why they are being tested, what will
happen to their results and what feedback they
will get. These rights are now enshrined in legal
protection in this country through the Data
Protection Act. Where test results are stored, the
‘data subject’ has the right to request a copy of
the information provided in an intelligible form.
The need for accuracy we almost take for
granted. But feedback – whether oral or written
– should be firmly grounded in the evidence
provided by the test taker through their
responses to the test instrument. Much of the
training in providing feedback focuses on under-
standing the properties of the instrument one is
using and learning not to go beyond the data in
over-elaborating interpretations. That is not to
say that feedback is simply a process of echoing
back to the test taker what they responded. It
involves the generation of hypotheses that can
be explored with the test taker, but those
hypotheses must be evidence based.
Regarding duty of care, a test user must
ensure that the test taker is not harmed or
treated inequitably as a result of the information
that has been collected. This concerns how the
information has been interpreted and used.
Duty of care touches on the whole issue of conse-
quential validity and the need to ensure that test
results are used appropriately and fairly.
I believe that the draft ISO statement quoted
earlier (from their PC230 project to develop
World Wide Standards for psychological testing)
is consistent with these principles and rightly
emphasises the need to make clear to the test
taker whether detailed feedback will be provided
and, if so, in what form. Where we need to go
further is to establish good practice regarding
the safeguards that need to be put in place to
ensure the duty of care in those cases where
feedback is provided. The more depth there is to
the feedback the more important it becomes for
the provider of feedback to have the skill and
expertise necessary to deal with potential nega-
tive consequences.
The present discussion has been useful not
only in raising the question of whether we
should revise our current guidelines, but has also
highlighted the fact that there may be a
mismatch between people’s beliefs about what
the guidelines say regarding the need to give
feedback and what they actually say. The current
guidelines do not imply that test users must
always provide face-to-face in-depth feedback
interviews when someone completes a person-
ality inventory. What they do require is that the
nature of the feedback that is to be given must
be made clear at the outset and should form part
of the informed consent process. The form,
amount and content of the feedback will depend
a lot on why the instrument was used and what is
being done with the data. For example, it is hard
to see how one could use a personality inventory
as part of a personal development assessment or
for career guidance without discussing the
results in some detail with the test taker. The
competent test user should have the skills and
expertise to provide feedback in a wide range of
different situations and should be able to relate
the form, amount and content of the feedback to
the function of the assessment as well as antici-
pating and making provision for possible conse-
quences of feedback.
Correspondence
Dave Bartram, CPsychol, FBPsS
Chair of the Steering Committee on
Test Standards.
Research Director SHL Group Ltd.
Dave can be contacted at
Dave.Bartram@shlgroup.com
Selection & Development Review, Vol. 24, No. 2, 2008 23
24 Selection & Development Review, Vol. 24, No. 2, 2008
BPS Code of Good Practice in Psychological Testing
Issued by the BPS Psychological Testing Centre
People who use psychological tests for assessment are expected by the British Psychological Society to:
Responsibility for Competence
1. Take steps to ensure that they are able to meet all the standards of competence defined by the
Society for the relevant Certificate(s) of Competence in Psychological Testing, and to endeavour,
where possible, to develop and enhance their competence as test users.
2. Monitor the limits of their competence in psychometric testing and not to offer services which
lie outside their competence nor encourage or cause others to do so.
Procedures and Techniques
3. Only use tests in conjunction with other assessment methods and only when their use can be
supported by the available technical information.
4. Administer, score and interpret tests in accordance with the instructions provided by the test
distributor and to the standards defined by the Society.
5. Store test materials securely and to ensure that no unqualified person has access to them.
6. Keep test results securely, in a form suitable for developing norms, validation, and monitoring for
bias.
Client Welfare
7. Obtain the informed consent of potential test takers, or, where appropriate their legitimate
representatives, making sure that they understand why the tests will be used, what will be done
with their results and who will be provided with access to them.
8. Ensure that all test takers are well informed and well prepared for the test session, and that all
have had access to practice or familiarisation materials where appropriate.
9. Give due consideration to factors such as gender, ethnicity, age, disability and special needs,
educational background and level of ability in using and interpreting the results of tests.
10. Provide the test taker and other authorised persons with feedback about the results in a form
which makes clear the implications of the results, is clear and in a style appropriate to their level
of understanding.
11. Ensure that confidentiality is respected and that test results are stored securely, are not accessible
to unauthorised or unqualified persons and are not used for any purposes other than those
agreed with the test taker.
Steering Committee for Test Standards 2002
THE SPECIAL GROUP IN COACHING PSYCHOLOGY
1st
European Coaching Psychology Conference
17th
and 18th
December 2008
To be held at the University of Westminster, Regent Street Campus,
London, UK.
Putting the Psychology into Coaching
The conference where the European Coaching Psychology community will come together in
2008. This event gives you the opportunity to deepen your learning, enhance your skill base
and to network.
We know you will enjoy taking part in this warm and stimulating event.
Building on four successful conferences to date, we are putting together an exciting and topical
event examining the latest theory research and practice in Coaching Psychology with keynote
papers, masterclasses, research and case study presentations, skills-based sessions and
round-table discussions.
Established and emerging speakers from across Europe will be invited to present and discuss
the latest developments in the field. In addition, a carefully chosen suite of Masterclasses is
being prepared to provide you with advanced coaching skills and a deeper understanding of
coaching theory and practice.
Call for papers
We would encourage you to submit posters, papers, and symposium proposals for
inclusion at our conference. We would also welcome you to send in details of research
you are conducting as we can provide space for a number of research projects to be
profiled at the conference.
Deadline for individual submissions: June 15th
2008.
For further information about the conference and details regarding exhibitor
and sponsorship opportunities please see the SGCP website:
http://www.sgcp.org.uk/conference/conference_home.cfm or email
sgcpcom@bps.org.uk
The 2008 membership fee to join SGCP is £3.50. SGCP membership benefits include
membership rates at our events and free copies of the ‘International Coaching Psychology
Review’ and ‘The Coaching Psychologist’. Join now and obtain the discounted conference fee.
Selection & Development Review, Vol. 24, No. 2, 2008 25
26 Selection & Development Review, Vol. 24, No. 2, 2008
Notes
Research. Digested. Free.
Give yourself the edge with the British Psychological Society’s
fortnightly e-mail and internationally renowned blog.
Get it or get left behind.
To subscribe, e-mail: subscribe-rd@lists.bps.org.uk
or see
www.researchdigest.org.uk/blog
Selection & Development Review, Vol. 24, No. 2, 2008 28
St Andrews House, 48 Princess Road East, Leicester LE1 7DR, UK
Tel 0116 254 9568 Fax 0116 227 1314 E-mail mail@bps.org.uk www.bps.org.uk
© The British Psychological Society 2008
Incorporated by Royal Charter Registered Charity No 229642

SDR 24_2 proof

  • 1.
    Selection Development Review Volume 24, No.2, 2008 ISSN 0963-2638 &Selection Development Review P U B L I S H E D B Y T H E B R I T I S H P S Y C H O L O G I C A L S O C I E T Y
  • 2.
    SDRC O NT E N T S APRIL’S issue of SDR covers a variety of topical issues and should have something to interest all readers. Dave Winsborough, Mina Morris and Mike Hughes adopt an innovative approach, using staff satisfaction surveys, to establish an early warning system that detects when valued personnel are becoming unhappy to the point of seeking to leave. This can trigger an intervention which could include re-negotiating the ‘psycho- logical contract’ with alienated individuals. Laurel Edmunds and Jessica Pryce-Jones attempt to unravel the complex interactions between ‘Employee Happiness, Overtime, Sick Leave and Intention to Stay or Leave’. Their tentative findings qualify the assertion that long working hours per se undermine health and happi- ness and increase likelihood of leaving. For instance, people who had high ‘work belief’, enjoyed their jobs and were ambitious for advancement did not seem to experience lower happiness, greater sickness absence and higher likelihood of leaving as a result of doing overtime. Peter Goodge and Jane Coomber update us on the effectiveness of 360 degree feedback; the conditions that must be satisfied for it to work well and when it is less effective. They highlight the need for associated support for development and its importance in enhancing self-awareness, a key ingredient of managerial success. The distinguished psychometrician, Roy Childs, who is not shy of controversy, challenges us to re-examine our guidelines on psychometric feedback in the light of technology related changes in assessment practice and consideration of different ways in which value might be added. Dave Bartram, Chair of the Steering Committee on Test Standards, gives a considered and infor- mative response. The BPS Code of Good Practice in Psychological Testing is provided for reference and to remind us what we should be doing. The editorial team must conclude with a plea to our readers to help us to disseminate best practice and practical knowledge. We are short of articles and need you to put your experience in practice and research into eloquent words. Please get writing and make editors and readers happy with a pipeline of articles that guarantees a steady stream of stimulating future issues. John Boddy Preventative defence against attrition: 3 Engaging ‘on the fence’ employees Dave Winsborough, Mina Morris & Mike Hughes Relationships between employee happiness, 8 overtime, sick leave and intention to stay or leave Laurel Edmunds & Jessica Pryce-Jones 360 Feedback – once again the research 13 is useful! Peter Goodge & Jane Coomber To give or not to give – 17 that is a difficult question (Challenging assumptions regarding feedback of psychometric tests) Roy Childs Giving feedback to test takers 20 Dave Bartram BPS Code of Good Practice in 24 Psychological Testing Editorial Selection & Development Review Editorial Team Dr John Boddy 16 Tarrws Close, Wenvoe, Cardiff CF5 6BT. Tel: 029 2059 9233. Fax: 029 2059 7399. E-mail: JBoddy2112@aol.com Stuart Duff, Stephan Lucks & Ceri Roderick Pearn Kandola Occupational Psychologists, 76 Banbury Road, Oxford OX2 6JT. Tel: 01865 516202. Fax: 01865 510182. E-mail: sduff@pearnkandola.com Philippa Hain Transformation Partners 98 Plymouth Road, Penarth CF64 5DL. Tel: 07816 919857 or 029 2025 1971. E-mail: philippa.hain@ntlworld.com Monica Mendiratta Empress State Building, Third Floor West, Empress Approach, Lillie Road, London, SW6 1TR. Tel: 07795 128171. E-mail: monica_m999@hotmail.com Consulting Editors: Dr S. Blinkhorn; Professor V. Dulewicz; Professor N. Anderson. Published six times a year by the British Psychological Society, St Andrews House, 48 Princess Road East, Leicester LE1 7DR at £37 (US $50 overseas) a year. Tel: 0116 254 9568. Fax: 0116 247 0787. E-mail: mail@bps.org.uk. ISSN 0963-2638 Aims, objectives and information for contributors SDR aims to communicate new thinking and recent advances in the theory and practice of assessment, selection, and development. It encourages critical reviews of current issues and constructive debate on them in readers’ letters. SDR is strongly oriented to the practice of selection, assessment and development, and is particularly keen to publish articles in which rigorous research is presented in a way likely to inform and influence the work of practitioners. It also seeks articles from practitioners drawing on their experience to indicate how practice can be improved. SDR is not intended to be an academic journal. Articles are reviewed by the editorial team for their relevance, rigour and intelligibility, but not all papers are referred to independent referees. The aim is to get new, practitioner- relevant data and ideas into print as quickly as possible. SDR is also open to book reviews in its area. The Editorial Team aim to give a platform for a range of views that are not necessarily their own or those of the British Psychological Society. Articles (2000 words maximum) should be sent as an e-mail attachment, saved as a text or MS Word file, containing author contact details. References should follow the Society’s Style Guide (available from the publications page of the Society’s website: www.bps.org.uk).
  • 3.
    The perfect stormof attrition THE MUCH VAUNTED war for talent is hitting firms hard, with a lack of available talent threat- ening to become the biggest single barrier to growth for firms over the next three years. A recent survey by the Chartered Institute of Personnel and Development (CIPD) reported that the overall employee turnover rate for the UK is 18.1 per cent, with the highest level of turnover (22.6 per cent) in the private sector (CIPD 2007). The average turnover rate for the public sector is 13.7 per cent. Such rates of employee turnover can be costly for organisa- tions. For example, Stokdyk (2007) reported that reducing employee turnover by one per cent saves the Royal Bank of Scotland around £30m in attraction costs. Organisations face a perfect storm – trouble attracting skilled talent and a rising rate of staff leaving. In this environment companies often find themselves behind the ball and reacting to attrition. While managing the organisation’s employment brand helps attract potential staff, existing tools may not be enough. Those organi- sations that respond best are likely to be those which develop more effective retention strate- gies and a better understanding of the needs and motivations of their employees. Companies need to get well ahead of the attri- tion curve and smart organisations are devel- oping new approaches to deepen their understanding of staff motivation and behaviour and to predict who is likely to leave in advance. Rather than react when talented staff have already gone, new predictive tools provide them with the chance to intervene and prevent staff leaving. Winsborough has already helped one large military organisation in New Zealand to develop a ‘smart weapon’ in the war for talent. This was done by adding predictive intelligence to existing technology – the climate survey. Climate, or staff satisfaction surveys have become fairly common in corporate life in the last decade – but very few firms extract the value from them that is available. Such surveys suffer from the ‘rear view mirror’ problem – they tell you how things were. But organisational leaders need to know what is going to happen – and its high time survey infor- mation came with predictive power. A deeper understanding of leavers As with all consulting projects the work proceeded in somewhat piecemeal manner – as we uncovered more interesting findings the client was prepared to sanction more analysis. This makes for a disjointed methodology in hindsight, but for an engaging project. There were three broad steps in this work: 1. Isolating and refining factors in the climate survey that accounted for intentions to quit. 2. Modelling these factors to confirm causality. 3. Translating these causative factors into a series of ‘additive’ risk scales with cut scores to predict individuals real-world leaving behaviour. Step 1: Isolating and refining useful factors To identify potential leavers we need to under- stand what it is that causes some people to leave an organisation while others stay. The NZ military organisation consists of more than 4000 people. It conducts a regular survey of staff attitudes to work on a rolling basis – that is, surveys are conducted on a sample of about 30 per cent of staff each year, and all staff are surveyed once over a three year cycle. Selection & Development Review, Vol. 24, No. 2, 2008 3 SDR Preventative defence against attrition: Engaging ‘on the fence’ employees Dave Winsborough, Mina Morris & Mike Hughes
  • 4.
    4 Selection &Development Review, Vol. 24, No. 2, 2008 Working with five years of historical survey data we started our analysis by using the scales administered by the organisation over this period. However, we observed only a weak rela- tionship between ratings on these scales and a criterion ‘Intentions to Quit’ scale that was also administered to participants. We suspected that there were underlying factors which would have a better relationship with the criterion. We therefore conducted an exploratory principal axis factor analysis. Six factors were identified as accounting for signifi- cant portions of the variance. We then refined these factors by selecting items that led to greater internal consistency using Cronbach’s Alpha, while ensuring that ratings on each indi- vidual scale remained as close to a normal distri- bution as possible. We then turned to the criterion, ‘Intentions to Quit’ and, treating it as a dependent variable, regressed the six factors against it. This proce- dure improved the amount of variance accounted for to well above that achieved using the original scales in the organisation’s climate questionnaire. The six factors we extracted were: ● Military Belonging; ● Work-Life Balance; ● Respectful work environment; ● Involved Management; ● Job satisfaction; ● Anomie. The underlying set of items had made up the a priori commitment scale but, a subset of items unexpectedly loaded on this separate factor. It describes a psychological state that people enter into before leaving (e.g. ‘I think joining was a mistake’). These results gave us a good understanding of the factors that play a part in an individual’s deci- sion to exit the organisation. Step 2: Modelling causality Because we sought to predict leavers we then moved on to use our regression work in a struc- tural equation model (SEM)1 to explain how these elements combine to predict intentions to leave. SEM explains in order the causative steps of the journey staff take en route to exiting the organisation. To develop our SEM we used a conceptual framework to explain attrition, based on Schneider’s Attraction, Selection and Attrition model2 (Figure 1). Through a process of experimentation with our factors, we built a model that was judged both conceptually and statistically valid. Three measures of fit – Chi-square, Root Mean Square Error of Approximation (RMSEA), and Comparative Fit Index (CFI) all indicated the model was sound. Figure 2 represents our model. Working from left to right it tells the story of how people come to exit the organisation. This model showed us that satisfaction with work and the feeling of connection to the organ- isation diminish as a result of poor management and of not feeling respected. Only if these condi- tions exist will staff begin to feel isolated in the organisation and anxious about staying in it. In this case we were able to demonstrate that it was not the pull of plentiful jobs that resulted in staff exit. Rather, it was a combination of poor management, work intruding on home life (very relevant in this organisation) and low levels of respect at work (which included seeing or expe- riencing bullying and harassment) that over- came the friction factors of organisational belonging and the pleasure of the job itself. Therefore, we were satisfied with not only the statistical validity of our model but also with its real world application in this organisation. Step 3: Predicting leavers Knowing what is going on is not the same as doing something about it. We wanted to use our deeper understanding to predict who will leave by testing the model against our real-world knowledge of who had left and who had stayed. In medicine, the concept of cumulative risk based on a series of factors is well understood. Too much fatty food, not enough exercise, smoking and a history of heart disease produce a cumulative increase in the risk of heart attacks. We reasoned that the general principle of accumulated risk might be applied to people leaving the organisation; if you experience more of the push factors identified, won’t you be more likely to leave? 1 See Kline, R.B. (1998), Principles and Practices of Structural Equation Modelling, The Guilford Press, New York. SEM serves purposes similar to multiple regression, but in a more powerful way which takes into account the interactions, correlated independents, measurement error, and latent dependent factors. SEM is a more powerful alternative to multiple regression and analysis of covariance. See also: http://en.wikipedia.org/wiki/Structural_equation_modelling for a concise and intelligible account of SEM, bearing in mind that the writer is a self-appointed authority. 2 See Schneider, B., Goldstein, H.W. & Smith, D.B. (1995). The ASA Framework: An Update. Personnel Psychology, 48, 747–779.
  • 5.
    Selection & DevelopmentReview, Vol. 24, No. 2, 2008 5 Figure 1: Attraction, Selection and Attrition Model. Figure 2: The path out the door. Involved management Work/home balance Respect Organisational belonging Job satisfaction Anomie Intentions to quit Bolded variables accounted for most variance. Push Factors e.g. bad management Friction Factors e.g. loyalty, liking my job Pull Factors e.g. good job prospects in other firm Since the people who had already left the organisation were known (an ‘Exited’ factor), we examined what risk factors, both in isolation and together, were needed to cause someone to leave. To do this we had to work backwards. There was a weak relationship between the ‘Intentions to Quit’ scale and people who exited the organi- sation, but we sought to identify the combination of the scales (or ‘risk factors’), using our struc- tured equation model which would account for the largest number of those who exited. We therefore experimented with various cut- off scores on the scales that might be used to separate people with high likelihood of exiting from those with low likelihood. This led us to an optimal calibration, a score above which there was a maximum likelihood that a person would appear on the ‘exit’ list over the next two years. At this point we had to ask ourselves a ques- tion – what if the risk factors were limited to a select few who scored low on relevant items (cumulatively indicating high risk of leaving), but then exited by chance (i.e. non-related reasons)? Although our sample was large, more than 1000 observations, this could still be math- ematically possible. To counter this, we created a dummy set of data that was randomly generated but that matched the general distribution of our existing data. We then tested our scale cut-off scores on this new simulated data, which also reflected what the organisation will do in practice from this point on. Our predictions still held up, and the risk scores in ‘red’ indeed corresponded to high scores on the simulated ‘Intentions to Quit’ scale.
  • 6.
    6 Selection &Development Review, Vol. 24, No. 2, 2008 A risky business Our access to historical data over a number of years on who had left the organisation and why, enabled us to test the predictive power of our model If we assessed who scored high on the risk factors in say 2004, could we predict who would leave in 2006? Yes, we could. And what about our hunch in relation to accu- mulated risk? This was also true – as an indi- vidual accumulates more risks (higher scores on the critical scales we identified from the climate survey) the chances of them leaving in subse- quent years soared. In fact using one risk factor we could identify approximately only 10 per cent of those who would appear on the ‘quit list’ in the next two year. But if they accumulated four risks or more, we could correctly identify 66 per cent of those on the list of leavers in the next year. Conversely, using accumulated low scores on risk factors we could identify around 94 per cent of those who would stay. Full data are presented in Table 1. Also included are the percentage of staff identi- fied in the ‘high’ range on the intentions to quit scale. While, using the risk factors identified from the climate questionnaire, we could identify correctly nearly 90 per cent of those who would score high on intentions to quit, this scale was not a good predictor of those who would actually go. To interpret this table, recall that we calculated their risks in one year, and then looked at who actually left over the subsequent two years. There are a couple of points to note. The intentions to quit scale, often used in the litera- ture as a proxy for ‘risk of leaving’ is not, in this case associated in a direct way with actual exits. On the other hand, accumulating risk factors seems to operate in a ‘catastrophic’ manner past a ‘tipping point’ – up to three risks means you may indeed score in the ‘high’ range on the intentions to quit scale but will not actually leave. Four risks, however seems to tip people over a threshold, and we can correctly identify more than 65 per cent of those who will actually leave over the next two years. We are now in a position to estimate in advance when there is a high likelihood that someone will go, thus creating a window of opportunity during which the organisation can intervene to prevent it happening. Building smart weapons to prevent attrition Based on an individual’s scores on key items in the climate survey, we can now identify the risk they will leave the organisation in the next two years. Armed with this knowledge the organisa- tion is now in the process of developing a range of reports for staff, for organisation leaders and for business unit managers. While confidentiality issues need to be taken into account and managed to protect individual identity, the kind of analysis we have undertaken can open up a range of new uses for climate reports Table 1: Relationship between number of risks, intentions to quit and actual exit. Accumulated Per cent categorised Actually exited in no. of Risks correctly in ‘high’ range next two years of Intentions to Quit 0 3.9 per cent 6 per cent 1 16.5 per cent 9.6 per cent 2 39.7 per cent 14.3 per cent 3 66.7 per cent 13.3 per cent 4 88.9 per cent 66.7 per cent
  • 7.
    For example, managerswill receive a summary of the number of ‘at risk’ individuals in their group, compared to the organisation overall. This enables a number of actions. They can consider who they believe may be at risk of leaving and actively seek them out to discuss their thinking and plans. Since we also know that poor management is a significant push factor, managers can reflect on their own actions and managerial style. The organisation in turn can watch for excessive risks and help managers to resolve workplace issues before it leads to signif- icant attrition. Perhaps the most interesting report might be a report for staff. Typically the people who complete climate surveys don’t find out what the staff survey said beyond an anodyne summary of whole organisation responses. Our client is considering whether individual staff will receive a confidential summary of their own responses compared to the organisation as a whole. This report may include a rating (high, medium, low) of their risk of leaving the firm over the next few years. A high risk rating might be accompanied with advice to talk to their manager, to a mentor or to HR. Again, such a report needs to be sensi- tively worded so as not to crystallise intentions to leave and convert them to action! Finally, organisation leaders will receive a report summarising trends in predicted attrition. Particular business units can be identified as having similar issues. Perhaps one manager will stand out as a problem, or a particular demo- graphic will be seen to be disproportionately represented. Executives can then tune policies or direct interventions targeted at the specific problem – rather than take a scatter gun approach after people have left. References Chartered Institute of Personnel and Development (2007). Annual Survey Report 2007. Recruitment, Retention and Turnover. Stokdyk, J. (2007). Case study: Human capital management at Royal Bank of Scotland. Available at www.hrzone.co.uk Correspondence Dave Winsborough is a Registered Psychologist (NZ) and Director of Winsborough Limited, a New Zealand based company specialising in improving individual and organisational performance. He can be contacted at dave@winsborough.co.nz Mina Morris is an organisational psychologist with Innovative HR Solutions, Dubai. He can be contacted at minamorris@gmail.com Mike Hughes is a Registered Psychologist (NZ) and Senior Consultant with Winsborough Limited. He is also a Chartered Occupational Psychologist and can be contacted at mike@winsborough.co.nz Selection & Development Review, Vol. 24, No. 2, 2008 7
  • 8.
    8 Selection &Development Review, Vol. 24, No. 2, 2008 WE WERE INTERESTED in the interactions between employees’ general happiness, the amount of overtime they worked, the amount of sick leave they took and their intention to stay or quit, to inform our coaching practice and management practices more generally. Happiness, or subjective well-being of employees has, not surprisingly, been shown to bring bene- fits to employers as well as employees and evidence suggests that the happiness is a pre- condition for good work performance and career success (Boehm & Lyubomirsky, 2008). From the employer’s perspective, overtime may appear to be a means of increasing the produc- tivity of employees. However, in the longer term, persistently working long hours may undermine happiness and well-being. Through producing impaired motivation, chronic fatigue and impairment of health it may, in turn, leads to falling productivity and absenteeism. Absenteeism is a major issue, costing the UK economy over £13.2 billion in 2006 (CBI, 2007). Employees’ loss of a sense of well-being through excessive overtime may also lead to them leaving, at great cost to the organisation that loses the benefits of their skill and experience. Past research has investigated overtime or absenteeism, but these have been related to job satisfaction which is a narrower concept than happiness. Most of this research was done from the employers’ perspective and before measures of well-being were developed. Briefly, early research into the relationship between overtime and job satisfaction yielded equivocal findings. Recently, Wegge et al. (2007) found the relationship to be complex as it depended on employee attitudes and levels of job engagement. While high job satisfaction is associ- ated with fewer days taken off sick by individuals (Lyubomirsky et al., 2005) and low job satisfaction indicates a higher probability of employees leaving (Clark, 2001), the literature on the rela- tionship between absenteeism and overtime is sparse and inconclusive (Brown, 1999). The aim here was to explore these relation- ships with a context free measure of happiness, and find any interactions between these factors, with contemporary employees, that might guide management practices. Methodology We carried out two different questionnaire surveys with two groups of respondents. Both groups had a similar composition of respondents who were currently employed and mostly were managerial staff or MBA students. Thus our findings may not be generalisable across other working populations. The first group comprised 127 respondents, 66 (52 per cent) of whom were men. The second group included 193 respondents, of whom 126 (65 per cent) were men. Both groups had similar age profiles (e.g. 40 per cent aged 31–40 years) and ethnicity (80 per cent Caucasian, 15 per cent Asian) profiles. The first questionnaire specifically assessed happiness, overtime, sick leave and intention to stay. The second was broader but included the same key questions. This included the General Happiness Scale (validated by Lyubomirsky & Lepper, 1999; see Table 1). We used the scores on this scale to divide respondents’ into low, medium or high happiness groups (see Table 2) as a basis for investigating differences related to amount of overtime, sick leave and intention to stay. Overtime was assessed in terms of average hours of overtime per week. In the first questionnaire we also asked if the overtime took place at work or at SDR Relationships between employee happiness, overtime, sick leave and intention to stay or leave Laurel Edmunds & Jessica Pryce-Jones
  • 9.
    home and whetherit was paid or unpaid. We also asked respondents to check, on a questionnaire adapted from Tucker and Rutherford (2005), for which of seven reasons overtime was worked (to increase earnings, overtime culture, belief in job, job enjoyment, progress in career, overtime not due to poor time management, work pressure and deadlines). Sick leave was assessed in terms of reported number of days taken between 1 January 2006 and the questionnaire administra- tion (either October, 2006, or July–October, 2007). We relied on self-reported sick leave data for two reasons; firstly Johns (1994) showed that the relationship between self-reported and true absenteeism was reasonably accurate; secondly, this approach avoids privacy and disclosure issues that may have biased the randomness of the sample. Length of time in post and how long they intended to stay in post were requested of respon- dents using four time periods. Data collection took place between Autumn, 2006, and Spring, 2007, and between the Summer and Autumn of 2007. Findings and discussion There were no significant differences between the two survey groups in terms of general happi- ness (t-test: p=0.691), intention to stay (t-test: p=0.063) sick leave (Mann-Whitney: p=0.735). However, respondents in the first survey reported more overtime per se (97 per cent vs. 75 per cent), and more hours of overtime per individual (10.5 vs. 7.3; p<0.001). There was more focus on over- time in this group, which may have caused these respondents to over-report, although the samples were not different in other respects. Happiness The mean happiness scores, on a scale of 1 to 10, were 6.6 (SD 1.8) in the first survey and 6.5 (SD 1.7) in the second. These were similar to the British Household Panel Survey Life Satisfaction findings for 1997-2003 which reported a modal rating of 6 (means were not given) and our find- ings in a further sample (Mean rating 6.4, SD 1.8; n = 600+). The three happiness groups we divided our sample into had mean rating ranges of 0-6.0, 6.1-7.0 and 7.1-10 respectively (see Table 2). Overtime Eighty-four per cent of respondents across both survey groups reported doing overtime. In the first group over 80 per cent of individuals working overtime did not receive payment for it. Interestingly, those who were paid did significantly less overtime (predominantly women). Overtime did not vary with location. The reasons for working overtime, given the highest scores were a ‘belief in the job’ and ‘job enjoyment’. ‘Increase in earn- ings’ was also offered as an option, but this was not rated highly even by the 17 per cent of respon- dents who received payment for overtime. Intrinsic reasons for doing overtime (belief in job, job enjoyment and career progression) appeared to be more relevant than increased earnings. Perhaps, in addition to reasons in the first survey, those choosing to work overtime do so either because they find it intrinsically rewarding, or to gain recognition, or because they self-select jobs that tend to demand over- time. This may be truer for employees, such as managers, where they have some autonomy and Selection & Development Review, Vol. 24, No. 2, 2008 9 Table 1: The General Happiness Scale. The General Happiness Scale 1. In General I consider myself: 1 = not a very happy person to 10 = a very happy person. 2. Compared to most of my peers, I consider myself: 1 = less happy to 10 = more happy. 3. Some people are generally very happy. They enjoy life regardless 1 = not at all to of what is going on, getting the most out of everything. 10 = a great deal To what extent does this characterisation describe you? 4. Some people are generally not very happy. Although they are not 1 = a great deal to depressed, they never seem as happy as they might be. 10 = not at all To what extent does this characterisation describe you? Score = (1 + 2 + 3 + 4)/4
  • 10.
    10 Selection &Development Review, Vol. 24, No. 2, 2008 the possibility of changing their jobs and progressing their careers. Brett and Stroh (2003) also found male managers were motivated by intrinsic and extrinsic (financial) motivations, whereas Tucker and Rutherford (2005) found financial rewards to be more important to train drivers. Therefore the importance of financial rewards is likely to depend on context and may be dependent on perceived career prospects. Sick leave Fifty per cent of respondents in the first survey and 53 per cent in the second reported taking no sick leave in the periods for which informa- tion was requested (9–10 and 15–18 months). Three respondents reported long term illnesses (over 90 days) and were omitted from the analyses. The average period of sick leave was just over two days in both surveys. The analyses were carried out with a subset of respondents (Survey 1: N=37; Survey 2: N=85). Inter-relationships (see Table 3) 1. Happiness and overtime In the first survey we found no significant rela- tionship between general happiness and over- time. However there were significant relationships between reasons for overtime and general happiness. The other comparison was reasons for overtime across happiness groups. The main finding here was that low happiness employees rated ‘job enjoyment’ significantly lower than the other two groups. In the second survey there was a weak, but significant positive relationship between happiness and overtime. We also saw a trend for employees with higher happiness scores to do more overtime, but this did not reach significance in this survey. 2. Happiness and sick leave There was no relationship between sick days and general happiness in the first survey, but there was a negative one in the second (–0.243; p=0.001). We found little evidence of any differ- ences between happiness groups in terms of sick days in either study, possible due to the low numbers of respondents. When we combined the surveys (N=317), the least happy reported taking more days off sick. 3. Happiness and intention to stay Both surveys showed a significant relationship between happiness and intention to stay in post. In the first survey the least happy group intended to stay for a shorter period of time than those in the medium and high happiness groups, but group means for time intended to stay were similar across happiness groups in the second study. Intention to stay was not related to over- time variables or sick leave. 4. Overtime and sick leave There was no relationship between these vari- ables in either survey. We also looked for patterns between reasons for overtime and sick leave in the first survey. The well-being of an employee who is happier through gaining intrinsic rewards from their work (e.g. by getting in ‘flow’ see Csikszentmihalyi, 1975) may actually benefit from doing overtime. Excessive overtime may potentially lead to the negative outcome of more sick leave. Excessive overtime may result in over-tiredness and ‘burnout’ resulting in absence from work. The stress arising from working under a lot of pressure, while lacking job security and autonomy around how they do their job may also lead to an individual experi- encing health problems (e.g. see Faragher, Cass & Cooper, 2005). However, this was not apparent in our respondents and so we could not test this further. A summary of findings above and some addi- tional relationships are shown in Table 3. Table 2: Descriptives for the General Happiness Scale and happiness groups in both surveys. Survey 1 Survey 2 Happiness Group N Mean score N Mean score General (total sample) 126 6.6 191 6.5 Low 49 4.8 72 4.7 Medium 37 6.9 72 7.0 High 40 8.5 47 8.5
  • 11.
    Selection & DevelopmentReview, Vol. 24, No. 2, 2008 11 Table 3: Summary of significant relationships between happiness, overtime, sick leave and intention to stay for both surveys. Correlation between principle factors in italics. Correlational sub-analyses under factors and results of comparison between happiness sub-groups using ANOVA in regular font. Overtime Sick leave Intention to stay Happiness Weak positive Negative Positive R=0.080; p=0.180 R=–0.185; p=0.003 R=0.216; p=0.000 2nd survey: p=0.195; p=0.011 With reasons for working overtime: job enjoyment: R=0.350; p=0.000 belief in job: R=0.202; p=0.027 work pressure: R=-0.215; p=0.017 Anova Happier work more Least happy take Least happy intend comparing overtime: more sick leave: to leave sooner: happiness F=4.172; p.017 F=2.955; p=0.054 F=6.389; p=0.002 groups Overtime NS NS Reasons for working Reasons for working overtime with sick leave: overtime with staying: all ns all ns Relationship suggested by U-shaped relationship with pattern of data, but not those intending to validated statistically: stay more than 3 years Individual with high belief and less than 6 months in and enjoyment of job doing more overtime (ns) and who are good at meeting deadlines and time management, take fewer sick days. Sick leave NS Anova Those intending to comparing stay take fewer ‘intend to stay’ sick days: vs. ‘don’t intend F=4.702; p=0.005 to stay’ Gender and age differences In Survey 1 men (52 per cent) reported signifi- cantly more overtime hours and females received more payment for overtime. Overtime impacts on family life, which may explain why women were more likely to be paid in compen- sation. Also women may be in lower status jobs where payment is more likely. Men reporting more overtime were also evident in Survey 2 (65 per cent), but this did not reach significance. Reasons for overtime in the first survey did not differ significantly between the sexes with one exception that men rated ‘progress in career’ far higher than women. Typically, in our larger data- bases, men report significantly more overtime, take fewer sick days and intend to stay longer in their jobs compared with women. Any anomalies here may be due to relatively small survey samples. Location of overtime and intention to stay did not differ between the genders.
  • 12.
    12 Selection &Development Review, Vol. 24, No. 2, 2008 There were fewer differences between the age groups. Those reaching significance were older respondents reporting greater ‘belief in job’ and ‘job enjoyment’. They also intended to stay in post longer in the first survey, whereas those less than 21 years old intended to leave sooner in the second, which corresponds with other data (Clark, 2001). One might intuitively expect an interaction between general ‘happiness’, ‘levels of over- time’, ‘sickness absence’ and ‘intention to leave’, which managers should take into account in trying to optimise organisation performance. Surprisingly, we found no other studies that had investigated how these four variables interact. Although the association is quite weak, the posi- tive relationships that we found between ‘happi- ness’, ‘overtime’ and ‘intention to stay’ and the negative one between happiness and sick leave, together with the close association between ‘belief in the job’ and ‘job enjoyment’, sit comfortably with the findings of Boehm & Lyubormirsky (2008) that ‘happiness’ or ‘well being’ pre-dispose employees to be productive and successful. As well as supporting these results, our findings give some support to the proposition that employees who are happy in and committed to their jobs, may happily work overtime for no extra pay, with no adverse conse- quences in terms of increase sickness absence or increased likelihood of leaving. However, this requires more investigation, particularly of the boundary conditions beyond which the amount of overtime has adverse consequences, however committed the employee is to start with. It is general unhappiness (probably contributed to by negative feelings about the job) that is likely to lead to increased sickness absence and intention to leave, irrespective of overtime worked. This study adds support to the proposition that managerial practices and work environments that generate positive emotion, a sense of well-being and commitment are benefi- cial to both employers and employees and allow additional demands to be made on employees at time of need, with minimal cost (there may be some cost in terms of distracting people from commitments outside of work) to either the employees or the organisation. References Boehm, J.K. & Lyubomirsky, S. (2008). Does happiness promote career success? Journal of Career Assessment, 16, 101–116. Brett, J.M. & Stroh, L.K. (2003). Working 61 plus hours a week? Why do managers do it? Journal of Applied Psychology, 88, 67–78. Brown, S. (1999). Worker absenteeism and overtime bans. Applied Economics, 31, 165–174. CBI (2007). Absence and labour turnover survey 2007. London: Confederation of British Industry. Clark, A.E. (2001). What really matters in a job? Hedonic measurement using quit data. Labour Economics, 8, 223–242. Csikszentmihalyi, M. (1975). Beyond boredom and anxiety. San Francisco: Jossey-Bass. Faragher, E.B., Cass, M. & Cooper, C.L. (2005). The relationship between job-satisfaction and health: A meta-analysis. Occupational and Environmental Medicine, 62, 105–112. Johns, G. (1994). How often were you absent? A review of the use of self-reported absence data. Journal of Applied Psychology, 79, 574–591. Lyubomirsky, S. & Lepper, H. (1999). A measure of subjective happiness: Preliminary reliability and construct validation. Social Indicators Research, 46, 137–155. Tucker, P. & Rutherford, C. (2005). Moderators of the relationships between long work hours and health. Journal of Occupational Health Psychology, 10, 465–476. Wegge, J., Schmidt, k-H., Parkes, C. & van Dyck, R. (2007). ‘Taking a sickie’: Job satisfaction and job involvement as interactive predictors of absenteeism in a public organisation. Journal of Occupational and Organisational Psychology, 80, 77–89. Correspondence Laurel Edmunds Head of Research, iOpener Ltd, Twining House, 294 Banbury Road, Oxford OX2 7ED. Tel 01856 517785 E-mail: laurel.edmunds@iopener.co.uk
  • 13.
    ALMOST A DECADEAGO Selection and Development Review published ‘360 Feedback – for once the research is useful’ (Goodge and Burr 1999). It reviewed the research on 360 Feedback, and found it surprisingly helpful to practitioners. Very briefly, Goodge and Burr concluded… ● 360 often has positive outcomes, and the benefits are sustained. However, some 360 interventions adversely affect people and performance. ● Below average performers benefit most from 360, but the small percentage of worst performers don’t improve. ● The key things to get right are clear/relevant questions, feedback from eight or more people, and ensuring some critical feedback. ● Feedback reports should be simple and visual2 with few, if any, averages or graphs3 . ‘Expert’ comments on reports don’t help - individuals need to draw their own conclusions. Nothing in the more recent research conflicts with those conclusions; some of the new research provides further support for them. In particular, there is a growing body of evidence for 360’s positive impact (see Walker & Smither, 1999) however there are some important new things to think about. Broadly, the current research addresses three areas: self-awareness, performance improve- ment, and what might be described as ‘noise’ in 360 Feedback. Self-awareness In the research, self-awareness is often measured by the difference between the ratings given for an individual and his/her own ratings. If a person rates him/herself similarly to the ratings given by others he/she is considered to be more self-aware. It’s a crude measure, but an impor- tant one. Self-awareness may influence performance. Fletcher’s (1997) helpful review of self-awareness research concluded ‘Some evidence suggests that greater self-awareness… is linked to… higher performance’. More recent research has confirmed that those with greatest self-awareness tend to be the strongest performers (Ostroff et. al., 2004). Low self-awareness might result in an indi- vidual rating his/herself more favourably than others do – so-called ‘overrating’. Or, rating him/herself more critically than others – ‘under- rating’. It’s an important distinction, because… ● Extreme overrating might be associated with poor performance (Atkins & Wood, 2002). ● It may be that those who overrate themselves benefit more from 360 Feedback. Johnson & Ferstl (1999) found that 360 improved over- raters’ self-awareness – their self-assessment became more modest whilst the ratings given by others became more favourable. ● Over-raters tend to be particular kinds of people: male, older, better paid, confident and innovative (Ostoff et al., 2004; Warr & Ainsworth, 1999). Over-rating seems specific to some competen- cies. An individual who overrates him/herself tends to misjudge his/her interpersonal skills, e.g. leadership, sensitivity. Technical competen- cies do not seem to be over-rated (Warr & Ainsworth, 1999). It is probable that good self-awareness enables a person to work with others more effectively. Accurate perceptions of how others see you helps anticipate their reactions to your ideas and deci- sions and judge how you might best influence Selection & Development Review, Vol. 24, No. 2, 2008 13 SDR 360 Feedback – once again the research is useful! Peter Goodge & Jane Coomber1 1 Our thanks to Senate House and Birkbeck libraries for their help during the development of this article. 2 A simple traffic-light format with critical ratings in red and favourable ratings in green works well. There is an example at www.simply360.co.uk/samplereport.pdf . 3 The research suggests that averages for competencies and for respondent types (e.g. direct reports) have no psychometric validity, but may hide important differences and patterns.
  • 14.
    14 Selection &Development Review, Vol. 24, No. 2, 2008 them. There is also anecdotal evidence - the very poor performers we coach are often clumsy with people and decisions precisely because they have mistaken views about others’ perceptions of them. Performance improvement A growing body of evidence suggests that 360 feedback works well if… ● The feedback itself suggests personal change is needed. Unsurprisingly, individuals who respond nega- tively or angrily to critical feedback don’t improve (Atwater & Brett 2006; Brett & Atwater 2001). However, without some differences between a person’s view of him/herself and the views of others there is no reason for them to change. Johnson and Ferstl (1999) concluded that managers ‘improve their performance to a greater extent the more their self-ratings exceed their subordinate ratings’. ● The individual and his/her organisation values feedback and development. Mauer et al. (2002) found that individuals who believed they could improve tended to value 360 feedback and engage in personal development. Warr and Ainsworth (1999) concluded ‘360 feedback is likely to be most effective when it is part of a corporate culture that supports ... its aims and procedures’. ● There is practical support for understanding and using feedback. In a five-year study, Walker and Smither (1999) found that ‘managers who held feed- back sessions to discuss their upward feedback with direct reports, improved more than other managers.’ And, they found ‘managers improve more in years when they hold feed- back meetings than in years when they do not.’ Seifert et al. (2003) report significant behaviour change when 360 feedback was part of a facilitated workshop, but no change when managers just received their feedback report. A key aspect of support seems to be the provi- sion of opportunities for individuals to manage and interpret things for themselves. Keeping and Levy (1998) found that attitudes to 360 were significantly affected by the extent to which individuals could express their opin- ions and interpretations. Smither et al.’s (2005) impressive meta-analysis of 360’s impact drew similar conclusions about the importance of feedback suggesting change, a positive development culture and practical support. Interestingly, Goodge (1995) found very similar things to be important with development centres. Centres that provided clear, critical feed- back, helpful coaching, and post-centre support had significantly better outcomes. Perhaps there’s a bigger message here? Noise The 360 feedback a person receives doesn’t just depend on his/her skills and abilities; many other factors influence the ratings. In particular, who gives the ratings matters. For example, Ostroff et al. (2004) found that women gave more favourable ratings; hence more women completing questionnaires for an individual meant the more favourable feedback. And, Murphy et al. (2004) showed that a rater’s reason for giving feedback influenced his/her ratings even when observing the same performance. In most 360 feedback there is probably a great deal of noise. Perhaps more noise than anything else. Greguras et al. (2003) found ‘the combined rater and rater-by-ratee interaction effects and the residue effects were substantially larger than the person effect’. In plain language, a person’s feedback was more to do with who completes questionnaires than the person’s abilities. However, noise can be reduced. Fletcher et al. (1998) demonstrated that good questionnaire design transformed the psychometric properties of a 360 questionnaire, which improved the quality of feedback. Implications for practice What can we add to Goodge and Burr’s recom- mendations of a decade ago? The new research suggests three additional implications for practice… ● Because 360 only works if it’s supported, organisations need to plan briefings, coaching, workshops and development resources from the outset. 360 needs to be part of a bigger, integrated project, not seen as a stand-alone tool. With limited budgets and resources it might be more cost-effective to limit 360 feedback to smaller, targeted groups of managers with whom it is done without cutting corners. It’s very naïve to buy 360 software, make it available to hundreds of managers, and offer minimal support. Yet, a worrying number of organisations seem to do exactly that.
  • 15.
    ● Individuals needto own and influence their 360 feedback. In practice that might mean … – Feedback on the competencies personally important to the individual, not a set completely prescribed by HR. – The individual chooses who completes questionnaires for him/her, not a predeter- mined sample of direct reports, colleagues, etc. We suggest individuals ask their key ‘customers’ to complete questionnaires, and involve their manager when making those choices. – A simple feedback report that enables indi- viduals to interpret feedback easily them- selves. Complex reports are obstacles to understanding and ownership. If an indi- vidual can’t interpret his/her report for themselves in five or 10 minutes we think it’s too complicated. – A coaching process that focuses upon personal goals, and offers a variety of prac- tical, relevant ways of improving perfor- mance. – The individual’s manager closely involved from beginning to end. Managers also need to own and influence their peoples’ feed- back. ● Good questionnaire design to reduce 360’s noise. The rules of good design are simple and have been around for decades, but many 360 questionnaires seem to disregard them. Very briefly, the rules are plain-English, one specific, observable behaviour per question, and explicit performance standards. References Atkins, P.W. & Wood, R.E. (2002). Self versus others’ ratings as predictors of assessment centre ratings: validation evidence for 360° feedback programs. Personnel Psychology, 55(4), 871–904. Atwater, L. & Brett, J. (2006). Feedback format: Does it influence manager’s reactions to feedback? Journal of Occupational and Organisational Psychology, 79, 517–532. Brett, J.F. & Atwater, L.E. (2001). 360 feedback: accuracy, reactions, and perceptions of usefulness. Journal of Applied Psychology, 86(5), 930-942. Fletcher, C. (1997). Self-awareness – a neglected attribute in selection and assessment? International Journal of Selection and Assessment, 5(3), 183–187. Fletcher, C., Baldry, C. & Cunningham-Snell, N. (1998). The psychometric properties of 360° feedback: an empirical study and cautionary tale. International Journal of Selection and Assessment, 6(1), 19–34. Goodge, P. (1995). Design options and outcomes. Progress in development centre research. Journal of Management Development, 14(8), 55–59. Goodge, P. & Burr, J. (1999). 360 Feedback – for once the research is useful. Selection and Development Review, 15(2), 3–7. Greguras, G.J., Robie, C., Schleicher, D.J. & Goff, M. (2003). A field study of the effects of rating purposes on the quality of multisource ratings. Personnel Psychology, 56(1), 1–21. Johnson, J.W. & Ferstl, K.L. (1999). The effects of inter-rater and self-other agreement on performance improvement following upward feedback. Personnel Psychology, 52(1), 271–303. Keeping L.M. & Levy, P. (1998). Performance appraisal attitudes: what are we really measuring? Paper presented to the Annual Conference of the Society for Industrial and Organisational Psychology, Dallas. Reported by Warr & Ainsworth (1999). Maurer, T.J., Mitchell, D.R.D. & Barbeite F.G. (2002). Predictors of attitudes toward a 360° feedback system and involvement in post- feedback management development activity. Journal of Occupational and Organisational Psychology, 75, 87–107. Murphy, K.R., Cleveland, J.N., Skattebo, A.L. & Kinney T.B. (2004). Raters who pursue goals give different ratings. Journal of Applied Psychology, 89(1), 158–164. Ostoff, C., Atwater, L.E. & Feinburg B.J. (2004). Understanding self-other agreement: A look at rater and ratee characteristics, context and outcomes. Personnel Psychology, 57(2), 333–375. Seifert, C.F., Yukl, G. & McDonald, R.A. (2003). Effects of multi-source feedback and a feedback facilitator on the influence behaviour of managers towards subordinates. Journal of Applied Psychology, 88(3), 561–569. Smither, J.W., London, M. & Reilly, R.R. (2005). Does performance improve following multisource feedback? A theoretical model, meta-analysis, and review of empirical findings. Personnel Psychology, 58(1), 33–66. Selection & Development Review, Vol. 24, No. 2, 2008 15
  • 16.
    16 Selection &Development Review, Vol. 24, No. 2, 2008 Walker, A.G. & Smither, J.W. (1999). A five-year study of upward feedback: what managers do with their results matters. Personnel Psychology, 52(1), 393–423. Warr, P. & Ainsworth, E. (1999). 360 feedback – some recent research. Selection and Development Review, 15(3), 3–6. Correspondence Peter Goodge and Jane Coomber are partners with Simply360. E-mail: peter.goodge@simply360.co.uk and jane.coomber@simply360.co.uk This article is part of Simply360’s free online 360 Handbook – see www.simply360.co.uk/handbook The 16PF User’s Group has become THE PSYCHOMETRICS USER FORUM an independently constituted users’ group which meets five times a year in central London. The main aims of the Forum are: ● To extend and deepen understanding of BPS accredited – personality instruments which map onto some or all of the Big Five factors; – cognitive tests; ● To improve members’ skills in the use and interpretation of these measures; ● To keep up-to-date with research and developments in personality and cognitive reasoning assessment. Guest speakers have included Prof Dave Bartram, Dr Meredith Belbin, Dr Julian Boon, Dr Rob Briner, Wendy Lord, Prof Fiona Patterson, Prof Steve Poppleton, Prof John Rust, Prof Peter Saville and Dr Mike Smith. You can join as a member or come as a visitor. Meetings are friendly and provide an opportunity for networking. For further information contact our administrator admin@leitzell.com
  • 17.
    Background IT IS GOODPRACTICE to give people feedback when they have taken a psychometric measure. This has become a standard benchmark, is incor- porated into the British Psychological Society’s guidelines and is taught religiously on Level A and B courses in Occupational Testing. However, are we clear about what we mean by feedback? Are there different situations that require (or can accept) different kinds of feedback? Verified Assessors for Levels A and B should be clear what the guidelines are and be able to present a consistent message. However, I believe that there may be a variety of interpretations and/or opin- ions within the industry and the psychologist’s profession. I am, therefore, writing this to stimu- late what I see as a necessary debate in order to ‘get the ferrets out into the open’ and leading to more general agreement about what we should advocate, when and why? This is overdue given that the industry has undergone significant change, current practice is more variable and ‘best practice’ needs to be clarified. Historically a decision was made to allow people other than psychologists to gain access to psychometric instruments, which some may regret. However the current situation introduced through the Steering Committee on Test Standards in the 1980s, is based on demonstrated competence (safeguarded through the whole Level A and B system). As a flagship system influ- encing practice across Europe and the globe it is important that the message delivered by different Level A and B Assessors is clear and consistent. Is our house in order – or do we need to challenge some sacred cows along the way? What has changed? Firstly, we need to recognise that the backdrop against which the original guidelines on feedback were developed has changed. Clearly today there is a far greater awareness and exposure to psycho- metrics – as witnessed by the balance sheets of test publishers and the number of qualified people on the Register of Competence in Psychological Testing. However, perhaps a more important change is the way access to psychomet- rics has increased through use of the internet. This means that the original model of face-to-face administration and feedback is being challenged (and even flouted). The whole process can be managed without any direct contact. Previously this could be done using the postal system but this was heavily frowned upon. The model in our minds was face-to-face feedback and even tele- phone feedback was barely acceptable. Anyone who simply sent a report in the post was definitely beyond the spirit of the guidelines (although I know this happened and I do not know of anyone being disciplined or struck off). Why feedback is considered to be ‘best practice’? The reasons for the strict code concerning feed- back can be summarised under three main head- ings as follows: ● Respect for the individual – a person has given their time to complete a psychometric instrument and so deserves a chance to learn and grow from their time investment (as long as the feedback is done in an appropriate manner). Selection & Development Review, Vol. 24, No. 2, 2008 17 SDR To give or not to give – that is a difficult question (Challenging assumptions regarding feedback of psycholmetric tests) Roy Childs
  • 18.
    18 Selection &Development Review, Vol. 24, No. 2, 2008 ● Validating the results – this is especially true for the use of self-report questionnaires but it also provides the ‘right of reply’ whereby people can comment, add to, or challenge the interpretations ● Reducing negative impact – if testing gets a bad name people will stop using them. Feedback can be seen as a way to engage/persuade the individual that the information is valid or that its use will be appropriately integrated in order to provide a balanced and holistic evaluation. All of these are worthy aims with which I cannot disagree. However, the mechanism for achieving these aims can be debated. It also raises the ques- tion of when is feedback not feedback? What is feedback and how good does it need to be? The image I have of feedback is of two people sitting together having an important conversa- tion. It involves a purpose, some exploring of certain information, attentive listening, correc- tions to possible misunderstandings and it could, potentially, challenge a person to think more deeply about themselves. It also strongly implies benefits for the individual. This picture makes it very hard to see how anyone would not get most benefit from this process being face-to-face rather than using the phone, text messaging, video- conferencing or simply reading written reports. However, some years ago Team Focus was involved in one of the first research projects to evaluate the effect and benefit of video-confer- encing as a way of providing psychometric feed- back. I must say that the results surprised me. The recipients not only valued the process, but many expressed the fact that they felt they got as much if not more than they expected – and they did not expect the face-to-face option to be able to deliver more. Such positive responses certainly challenged my expectations. I there- fore suggest that we should all remain open to other forms of feedback (telephone, online chat room, simple written reports) also adding value. Is this a holy cow? Even if we believe that face-to- face feedback is ‘the best’ should second best options be offered on the basis that they never- theless add value? Our current position could put us in the position where excellence becomes the enemy of the good. An analogy could be considering how we satisfy our thirst. If we picture a glass of water, how empty does it need to be before we say it is not worth the effort of drinking it? The parallel is how ‘full’ does the feedback need to be or how much value does it need to add? The internet has changed the nature of access to psychometrics and to different forms of feedback. Now is a good time to review the principles and examine what we mean by feedback and agree whether different situations allow different forms of feedback. What criteria do we use for deciding on the right form of feedback? A current principle guiding of the British Psychological Society in its recommendations for giving feedback, is that if people give up their time they deserve something back. Alongside this is the concept of adding value and avoiding harm. How can we apply these to a situation where a person chooses to give their time knowing that the feedback they will receive is a written report1 . Have they received feedback (perhaps minimal and not interactive) which adds value and does no harm? Does this meet the guidelines or not? Historically the guidelines were built around a model of deep psychological constructs requiring an ‘expert’ to interpret the results. I believe that this model does not apply to all situations today; two of which are described below: 1. Some modern day questionnaires are better described as competency frameworks that have been put through some psychometric analysis. ‘Persuasiveness’ or ‘Decisiveness’ may cover complex syndromes of behaviour, but they are not really deep psychological constructs. In fact, they are multi-factorial constructs covering a range of different attrib- utes and skills and they are usually measured quite simplistically in questionnaires. It is hard to stretch their interpretation in terms of deep psychological constructs and research. 2. Other questionnaires may be based on psychological theory, but their interpretation can be many layered, from quite straightfor- ward to involving complex psychological ideas. Some provide quite self-explanatory reports that are written in a style designed for end-user consumption. 1 Some people may argue that no-one should be allowed to complete any psychometric measure subject to this condition – especially online – but the reality is that this does happen.
  • 19.
    What constraints regardingfeedback apply to the two scenarios above – especially if the choice to complete the questionnaires is self-solicited? Is it possible that non-interactive feedback, whilst not making best advantage of the information, nevertheless adds value and does no harm? Some of the factors we need to address in this discussion are, therefore: ● Who is asking for the psychometric instru- ment to be completed? – Is it different if it is self-solicited by the individual (who believes s/he will benefit from the process) versus being asked for by a third party? ● What is being measured? – Is it different if we are measuring personal values, behavioural tendencies, behaviour under stress, ‘dark side’ tendencies, emotional reactions, emotional intelligence, cognitive abilities, etc.? ● What is the purpose? – Is it different if the person is asked to complete it by a third party where the purpose is the individual’s interest (as in a development context) versus the third party’s interest?(as in a selection context). ● What is the hoped for outcome? –Is it different if the hoped for outcome is to address a broken marriage versus gaining a few ideas about possible careers? Perhaps we would benefit from exploring a shift of perspective from the original one which asked whether a person was qualified to use and give feedback (and will not misuse the psychometric instrument) to asking how the ‘client’ will benefit from the feedback they receive. Some suggestions for acceptable guidelines My own ideas concerning the ethics of giving feedback are evolving. I still recognise that the best job will be done using face-to-face contact with experienced practitioners. However, when do we need a Rolls Royce and when a Mini? I recognise how people have got great value from completing a questionnaire and receiving other kinds of feedback. One of the most impor- tant elements to consider is the purpose of the feedback – and to differentiate when it is for the benefit of a third party (as in selection) or for the recipient. I would like to consider the following as clarifying the guidelines, which could then be presented as part of the Level A and Level B process: 1. face-to-face feedback should be offered wher- ever possible (logistically, financially and where there is the motivation from the recipient) 2. where face-to-face feedback is not possible some form of mediated feedback should be offered (video conference, phone, MSN chat, skype) 3. where only a written report is to be offered, this should be restricted to situations where the request for the psychometric instrument is self-solicited and the results are for the indi- vidual and not for any third party (although the individual may choose to share with a third party if they wish). The judgements required for applying the above and offering the minimum level of feedback would involve evaluating the purpose, the status of the information, the way an individual chooses or is invited to engage with the process and the nature and language of the written reports. The British Psychological Society guide- lines have often been interpreted to mean that psychometric instruments should never be used if only written reports are available – except that this is often over-ruled when the results are to be used purely for research. In such situations it is not unusual for the contract up-front to involve no feedback whatsoever. We therefore face the whole gamut – from no feedback to intensive face-to-face. Do we now need to become clearer about the stages in-between and agree where we should draw the line? Correspondence Roy Childs, C.Psychol AFBPsS, is Managing Director of Team Focus Ltd and can be contacted at e-mail: roy.childs@teamfocus.co.uk and + 44(0)1628 637338. Selection & Development Review, Vol. 24, No. 2, 2008 19
  • 20.
    20 Selection &Development Review, Vol. 24, No. 2, 2008 ROY CHILDS’ discussion of issues relating to the provision of feedback is a welcome and thoughtful piece for consideration at a time when test practice is undergoing very significant changes. In particular, we are seeing the rapid development of modes of test administration that use the internet as the delivery medium and which provide various participants in the assess- ment process (test takers, personnel profes- sionals, and line managers) with feedback in the form of computer-based reports. While Level A/B certified test users will still be able to access full details of test scores, norms and related reports, including outputs like personality scale profiles, others receive a variety of different products designed to cater for more specific needs and more limited psychometric expertise. The fact that practice has changed does not imply that current practice is better or worse than it was. It may be different and we may need to re-consider the guidelines we provide in terms of the principles that underlie them. What are most important are the principles on which guidelines or standards are based. Changes in technology often require us to rethink what we mean by good practice, but should not change the basic principles underlying that practice. In the article, there is much discussion about current guidelines on giving feedback, but there are no details of which guidelines are being referred to. As a starting point to developing this discussion it would be worth reviewing what the various current guidelines actually say and then consider the principles that underlay their development. What do the current guidelines actually say? The Society’s Code of Good Practice in Psychological Testing, states that people who use psychological tests are expected to: ‘Provide the test taker and other authorised persons with feedback about the results in a form which makes clear the implications of the results, is clear and in a style appropriate to their level of understanding.’ This does not say that you must always provide feedback, but only that when you do it must be in an appropriate form. Furthermore, this does not imply that one always has to give feedback in a face-to-face interview. Level A and Level B (Occupational) standards focus on the skills people need to develop in order to give feedback effectively and safely. They do not say that you must always provide feedback but rather set out the skills and exper- tise needed for when feedback is provided. For Level A, Unit 6. Does the Assessee provide feedback of informa- tion about results to the candidate which: 6.10 is in a form appropriate to his or her under- standing of the tests and the scales; 6.11 describes the meanings of scale names in lay terms which are accurate and mean- ingful; 6.12 provides the candidate with opportunities to ask questions, clarify points and comment upon the test and the administra- tion procedure; 6.13 encourages the candidate to comment on the perceived accuracy and fairness or otherwise of the information obtained from the test; 6.14 clearly informs the candidate about how the information will be presented (orally or in writing) and to whom. Level B, Unit 5. Test Use: Providing feedback The assessee: 5.1 Demonstrates sufficient knowledge of the instrument to provide competent interpre- tation and oral feedback to at least two candidates in each case and to produce SDR Giving feedback to test takers Dave Bartram* * The author is grateful to Dr P.A. Lindley for her suggestions and comments on drafts of this paper.
  • 21.
    balanced written reportsfor: (a) the candi- date; and (b) the client – where the assess- ment is being carried out for a third party. 5.2 Provides non-judgemental oral feedback of results to candidates with methodical use of the feedback interview to help confirm/ disconfirm hypotheses generated from the pattern of individual test results. 5.3 Provides an indication to the candidate and to the client (when there is a third party involved) of the status and value of the information obtained and how it relates to other information about the candidate's personality. Similar issues relate to the EFPA (European Federations of Psychology Associations) Standards for Test Use. In EFPA standard 1.1. ‘Act in a professional and ethical manner’ it is noted that: ‘1.1.d. You must ensure that you conduct communications and give feedback with due concern for the sensitivities of the test taker and other relevant parties.’ Providing feedback is identified as an ‘essential skill’ for EFPA Standard 2.5 ‘Communicate the results clearly and accurately to relevant others’: ‘2.5.b. You must ensure that you discuss results with test takers and relevant others in a constructive and supportive manner.’ Again, the importance of having the necessary skills and competence to conduct feedback is stressed, but nowhere is it stated that feedback must always be given, whatever the circum- stances. We find the same emphasis on how feedback is given, rather than whether it is given, in the ITC (International Test Commission) Test Use Guidelines in Section 2.8. ‘Communicate the results clearly and accurately to relevant others’. This simply states that: ‘Competent test users will: [2.8.10] Present oral feedback to test takers in a constructive and supportive manner.’ Within Appendix A of the ITC Guidelines (Guidelines for an outline policy on testing) it is noted that a policy on testing should cover, amongst other things, the provision of feedback to test takers. It goes on to say that relevant parties (which include test takers) need to have access to and be informed about the policy on testing and that responsibility for any organisa- tion’s testing policy should reside with a quali- fied test user who has the authority to ensure implementation of and adherence to the policy. Furthermore, in Appendix B, guidelines are provided for developing ‘contracts’ between parties involved in the testing process. This states that the contract between the test user and test takers should be consistent with good practice, legislation and the test user’s policy on testing. ‘Test users should endeavour to: b.5 inform test takers prior to testing about the purpose of the assessment, the nature of the test, to whom test results will be reported and the planned use of the results; b.6 give advance notice of when the test will be administered, and when results will be avail- able, and whether or not test takers or others may obtain copies of the test, their completed answer sheets, or their scores; b.10 ensure test takers know that they will have their results explained to them as soon as possible after taking the test in easily under- stood terms;’ The footnote to b.6 is actually very important in that it states: ‘While tests and answer sheets are not normally passed on to others, there is some variation between countries in practice relating to what test takers or others are permitted to have. However, there is much greater variation in the expectations of test takers concerning what information they will be given [my italics]. It is important that contracts make clear what they will not be given as well as what they will.’ What is emerging here is an emphasis on the need to establish a clear understanding with the test taker before they take the test regarding what they can expect in terms of feedback after- wards. This becomes much more explicit on the current draft of the standard being developed by the International Standards Organization (ISO) for assessment in work and organisational settings, which addresses feedback as follows: ‘Whether feedback is provided or not and the nature of that feedback, where it is to be provided, shall be defined within the context of organisational , legal, and cultural norms. The people who are being assessed shall have been notified of whether or not feedback will be provided and the nature of the feedback, if any, prior to the assessment taking place.’ Selection & Development Review, Vol. 24, No. 2, 2008 21
  • 22.
    22 Selection &Development Review, Vol. 24, No. 2, 2008 The development of this wording is inter- esting as it comes out of lengthy discussions between a large body of international experts and reflects differences in practice and legal requirements in different countries. For example, in the US it is general practice not to provide detailed feedback to job applicants on their test results (other than providing them with information on whether they were selected or not) as the purpose of the testing is regarded as being non-developmental and there is perceived to be a significant risk of litigation if people are given feedback that they might use to challenge the employer’s decision. Computer-based reports and feedback The ITC Guidelines on Computer Based and Internet Delivered Testing (2006) discuss the issue of using computer-generated reports (CBTI – computer based test interpretation) in the provision of feedback. The relevant section focuses on the need to provide guidance on giving feedback, training in the use of the report, advice to test users on how to use the report and the need for test users to consider all the prac- tical and ethical issues associated with providing feedback over the Internet. The Society’s guidance on using online assess- ment tools for recruitment state, in relation to reporting and feedback, that; ‘Reports are typically used by recruitment consultants or hiring managers who are not trained test users. As lay users they need clear, non-technical information in a form that directly addresses the issues they are concerned with. In recruitment, hiring managers are concerned with the risks associ- ated with a candidate in terms of likely fit or lack of fit to the job requirements. Reports should make clear the status of the informa- tion provided, in terms of the confidence that can be placed in it, and should always stress the value of corroboration through the use of multiple sources or methods of assessment. Similar considerations should be taken into account when designing reports for providing feedback to candidates. Candidates should always be provided with access to a qualified test user if they have any concerns or issues they need to raise that lie outside the compe- tence of the hiring manager.’ Principles relating to feedback provision I would like to suggest that what underlies all these various guidelines are three main princi- ples: Consent, accuracy and duty of care. Regarding consent, the test taker has a right to know why they are being tested, what will happen to their results and what feedback they will get. These rights are now enshrined in legal protection in this country through the Data Protection Act. Where test results are stored, the ‘data subject’ has the right to request a copy of the information provided in an intelligible form. The need for accuracy we almost take for granted. But feedback – whether oral or written – should be firmly grounded in the evidence provided by the test taker through their responses to the test instrument. Much of the training in providing feedback focuses on under- standing the properties of the instrument one is using and learning not to go beyond the data in over-elaborating interpretations. That is not to say that feedback is simply a process of echoing back to the test taker what they responded. It involves the generation of hypotheses that can be explored with the test taker, but those hypotheses must be evidence based. Regarding duty of care, a test user must ensure that the test taker is not harmed or treated inequitably as a result of the information that has been collected. This concerns how the information has been interpreted and used. Duty of care touches on the whole issue of conse- quential validity and the need to ensure that test results are used appropriately and fairly. I believe that the draft ISO statement quoted earlier (from their PC230 project to develop World Wide Standards for psychological testing) is consistent with these principles and rightly emphasises the need to make clear to the test taker whether detailed feedback will be provided and, if so, in what form. Where we need to go further is to establish good practice regarding the safeguards that need to be put in place to ensure the duty of care in those cases where feedback is provided. The more depth there is to the feedback the more important it becomes for the provider of feedback to have the skill and expertise necessary to deal with potential nega- tive consequences. The present discussion has been useful not only in raising the question of whether we should revise our current guidelines, but has also highlighted the fact that there may be a mismatch between people’s beliefs about what
  • 23.
    the guidelines sayregarding the need to give feedback and what they actually say. The current guidelines do not imply that test users must always provide face-to-face in-depth feedback interviews when someone completes a person- ality inventory. What they do require is that the nature of the feedback that is to be given must be made clear at the outset and should form part of the informed consent process. The form, amount and content of the feedback will depend a lot on why the instrument was used and what is being done with the data. For example, it is hard to see how one could use a personality inventory as part of a personal development assessment or for career guidance without discussing the results in some detail with the test taker. The competent test user should have the skills and expertise to provide feedback in a wide range of different situations and should be able to relate the form, amount and content of the feedback to the function of the assessment as well as antici- pating and making provision for possible conse- quences of feedback. Correspondence Dave Bartram, CPsychol, FBPsS Chair of the Steering Committee on Test Standards. Research Director SHL Group Ltd. Dave can be contacted at Dave.Bartram@shlgroup.com Selection & Development Review, Vol. 24, No. 2, 2008 23
  • 24.
    24 Selection &Development Review, Vol. 24, No. 2, 2008 BPS Code of Good Practice in Psychological Testing Issued by the BPS Psychological Testing Centre People who use psychological tests for assessment are expected by the British Psychological Society to: Responsibility for Competence 1. Take steps to ensure that they are able to meet all the standards of competence defined by the Society for the relevant Certificate(s) of Competence in Psychological Testing, and to endeavour, where possible, to develop and enhance their competence as test users. 2. Monitor the limits of their competence in psychometric testing and not to offer services which lie outside their competence nor encourage or cause others to do so. Procedures and Techniques 3. Only use tests in conjunction with other assessment methods and only when their use can be supported by the available technical information. 4. Administer, score and interpret tests in accordance with the instructions provided by the test distributor and to the standards defined by the Society. 5. Store test materials securely and to ensure that no unqualified person has access to them. 6. Keep test results securely, in a form suitable for developing norms, validation, and monitoring for bias. Client Welfare 7. Obtain the informed consent of potential test takers, or, where appropriate their legitimate representatives, making sure that they understand why the tests will be used, what will be done with their results and who will be provided with access to them. 8. Ensure that all test takers are well informed and well prepared for the test session, and that all have had access to practice or familiarisation materials where appropriate. 9. Give due consideration to factors such as gender, ethnicity, age, disability and special needs, educational background and level of ability in using and interpreting the results of tests. 10. Provide the test taker and other authorised persons with feedback about the results in a form which makes clear the implications of the results, is clear and in a style appropriate to their level of understanding. 11. Ensure that confidentiality is respected and that test results are stored securely, are not accessible to unauthorised or unqualified persons and are not used for any purposes other than those agreed with the test taker. Steering Committee for Test Standards 2002
  • 25.
    THE SPECIAL GROUPIN COACHING PSYCHOLOGY 1st European Coaching Psychology Conference 17th and 18th December 2008 To be held at the University of Westminster, Regent Street Campus, London, UK. Putting the Psychology into Coaching The conference where the European Coaching Psychology community will come together in 2008. This event gives you the opportunity to deepen your learning, enhance your skill base and to network. We know you will enjoy taking part in this warm and stimulating event. Building on four successful conferences to date, we are putting together an exciting and topical event examining the latest theory research and practice in Coaching Psychology with keynote papers, masterclasses, research and case study presentations, skills-based sessions and round-table discussions. Established and emerging speakers from across Europe will be invited to present and discuss the latest developments in the field. In addition, a carefully chosen suite of Masterclasses is being prepared to provide you with advanced coaching skills and a deeper understanding of coaching theory and practice. Call for papers We would encourage you to submit posters, papers, and symposium proposals for inclusion at our conference. We would also welcome you to send in details of research you are conducting as we can provide space for a number of research projects to be profiled at the conference. Deadline for individual submissions: June 15th 2008. For further information about the conference and details regarding exhibitor and sponsorship opportunities please see the SGCP website: http://www.sgcp.org.uk/conference/conference_home.cfm or email sgcpcom@bps.org.uk The 2008 membership fee to join SGCP is £3.50. SGCP membership benefits include membership rates at our events and free copies of the ‘International Coaching Psychology Review’ and ‘The Coaching Psychologist’. Join now and obtain the discounted conference fee. Selection & Development Review, Vol. 24, No. 2, 2008 25
  • 26.
    26 Selection &Development Review, Vol. 24, No. 2, 2008 Notes
  • 27.
    Research. Digested. Free. Giveyourself the edge with the British Psychological Society’s fortnightly e-mail and internationally renowned blog. Get it or get left behind. To subscribe, e-mail: subscribe-rd@lists.bps.org.uk or see www.researchdigest.org.uk/blog
  • 28.
    Selection & DevelopmentReview, Vol. 24, No. 2, 2008 28 St Andrews House, 48 Princess Road East, Leicester LE1 7DR, UK Tel 0116 254 9568 Fax 0116 227 1314 E-mail mail@bps.org.uk www.bps.org.uk © The British Psychological Society 2008 Incorporated by Royal Charter Registered Charity No 229642