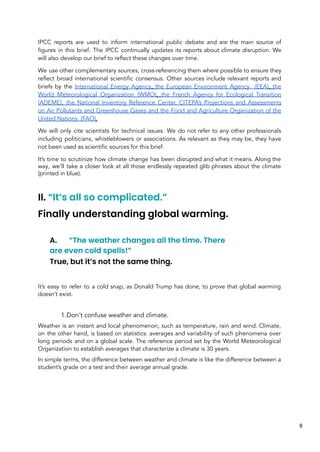
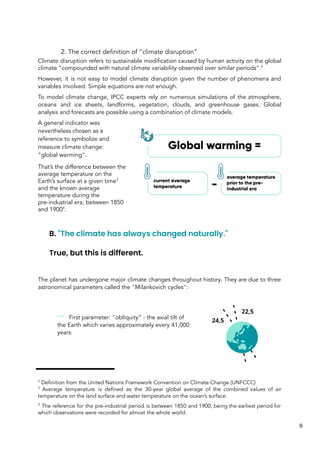
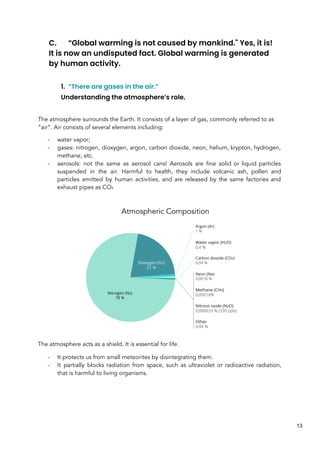
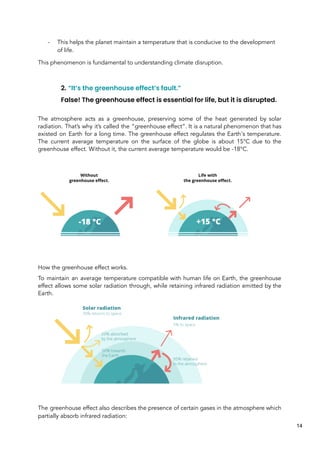
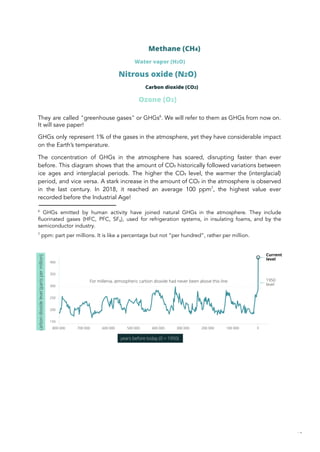
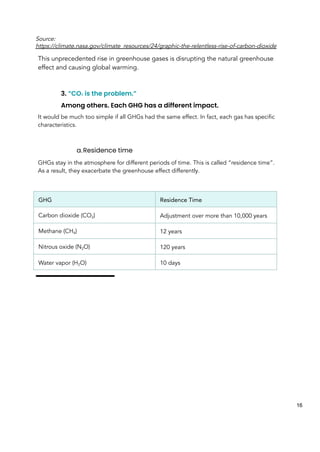
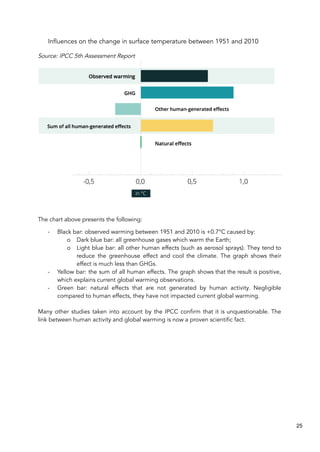
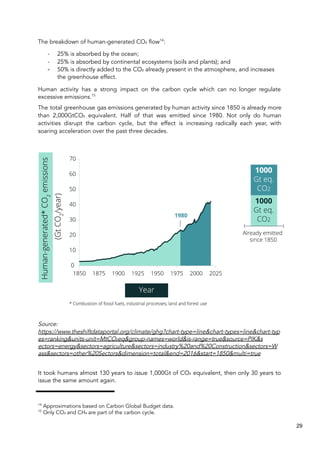
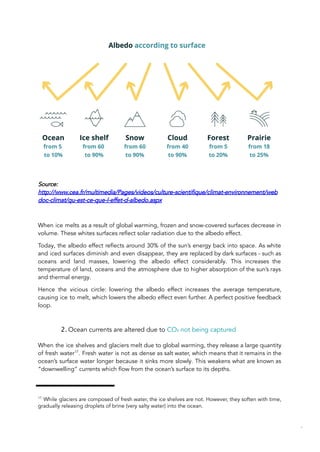
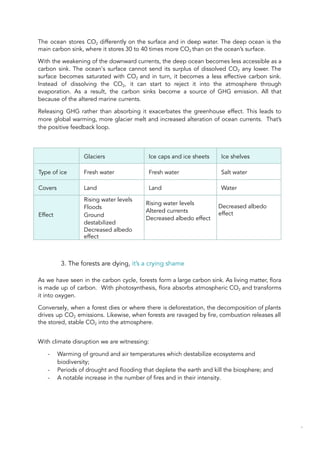
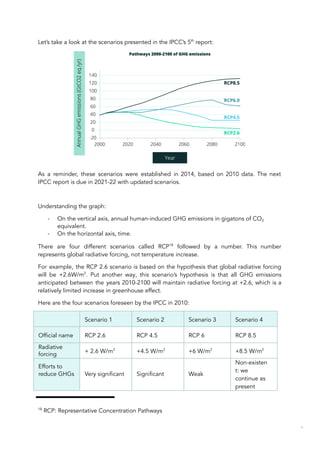
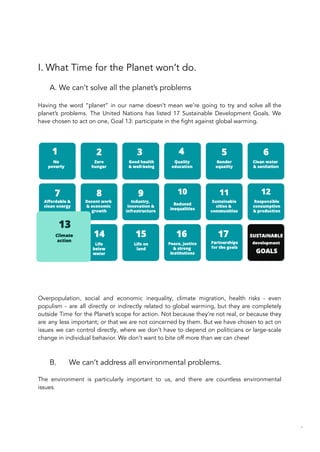
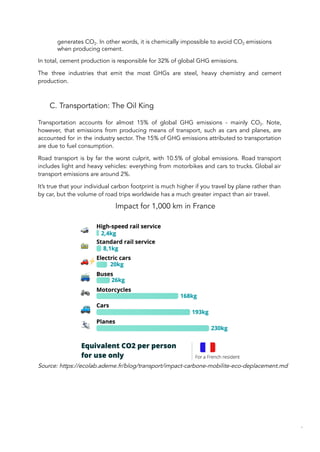
The document provides an overview of climate change and its causes according to scientific consensus. It explains that climate change refers to long-term shifts in weather patterns caused by both natural factors and human activity. While the climate has changed naturally in the past due to factors like orbital shifts, the current warming trend is both faster and of a greater magnitude than past natural changes, making today's climate change unprecedented. The document attributes the current changes to a sharp rise in greenhouse gas emissions from human activities like burning fossil fuels, which have disrupted the natural carbon cycle and caused global temperatures to increase at a dangerous rate.

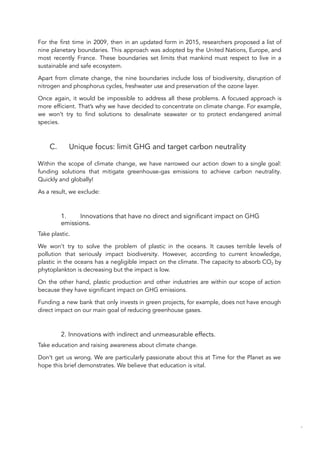
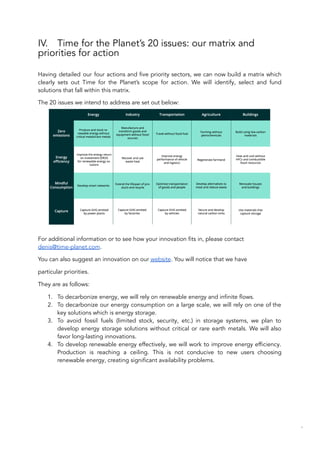
![2. Even the IPCC’s worst-case scenarios were optimistic in the end.
Since the 2014 IPCC report, and until the next report, other scientific groups have updated
these scenarios.
The Coupled Model Intercomparison Project brings together around 20 major laboratories
worldwide. They have created climate models that will serve as the basis for the IPCC and
will need to be included in its next report.
What changed?
- They were able to model the effect of clouds and aerosols more precisely;
- Computer processing power has improved even more; and
- They took into account countries’ efforts since 2010 to significantly reduce GHG
emissions.
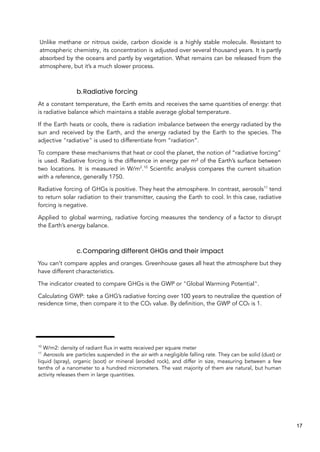
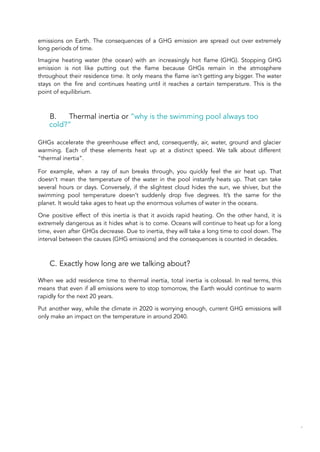
And the result? The new Shared Socio-economic Pathway (SSP) models are even more
troubling than the RCP scenarios. Here are the new scenarios proposed by the scientists:
Source CEA.
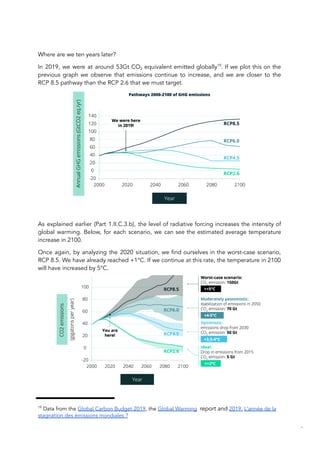
The worst-case scenario forecasts an average global temperature increase of +7°C by 2100.
That’s well above the IPCC’s worst-case scenario of +5°C. The curve simulates climate
evolution if we don’t change our consumption patterns and production methods.
Even the most favorable scenario, represented in light green, is not terribly optimistic. Even
the most optimistic scenario stabilizes around a +2°C warming, but “only just, [with] a
significant mitigation effort (...), and at the cost of temporarily exceeding the 2°C objective
over the course of the century”.
51](https://image.slidesharecdn.com/dossierscientifiqueenglishfinal-210419101042/85/Scientific-brief-for-the-Planet-52-320.jpg)

![Bibliography
IPCC (2018). Summary for Policy Makers, Global Warming of 1.5°C
An IPCC special report on the impacts of global warming of 1.5 °C above pre-industrial
levels and related global greenhouse gas emission pathways, in the context of
strengthening the global response to the threat of climate change, sustainable
development, and efforts to eradicate poverty. [Publication directed by V.
Masson-Delmotte, P. Zhai, H. O. Pörtner, D. Roberts, J. Skea, P.R. Shukla, A. Pirani, W.
Moufouma-Okia, C. Péan, R. Pidcock, S. Connors, J. B. R. Matthews,
Y. Chen, X. Zhou, M. I. Gomis, E. Lonnoy, T. Maycock, M. Tignor and T. Waterfield]. World
Meteorological Organization, Switzerland, 32 pp.https://www.ipcc.ch/sr15/
IPCC (2014). Climate Change 2014: This Synthesis Report is based on the reports of the
three Working Groups of the Intergovernmental Panel on Climate Change (IPCC), including
relevant Special Reports. [Publication directed by R.K. Pachauri and L.A. Meyer]. IPCC,
Geneva, Switzerland, 161 pp. https://www.ipcc.ch/report/ar5/syr/
IPCC (2013). Climate Change 2013: The Physical Science Basis
The Working Group I contribution to the Fifth Assessment Report of the Intergovernmental
Panel on Climate Change (IPCC) provides a comprehensive assessment of the physical
science basis of climate change. [Directed by Stocker, T.F., D. Qin, G.-K. Plattner, M. Tignor,
S. K. Allen, J. Boschung, A. Nauels, Y. Xia, V. Bex and P.M. Midgley].
Cambridge University Press, Cambridge, United Kingdom and New York (State of New
York), United States of America. 204 pages. https://www.ipcc.ch/report/ar5/wg1/
IPCC (2014). Climate Change 2014: Impacts, Adaptation and Vulnerability Summaries, FAQs
and Themes Working Group II contribution to the IPCC’s Fifth Assessment Report (WGII
AR5) evaluates how patterns of risks and potential benefits are shifting due to
climate change [Publication managed by Field, C.B., V.R. Barros, D.J. Dokken, K.J. Mach,
M.D. Mastrandrea, T.E. Bilir, M. Chatterjee, K.L. Ebi, Y.O. Estrada, R.C. Genova, B. Girma,
E.S. Kissel, A.N. Levy, S. MacCracken, P.R. Mastrandrea and L.L. White]. World
Meteorological Organization( Switzerland), 201 pp.https://www.ipcc.ch/report/ar5/wg2/
IPCC (2014). Climate Change 2014, Mitigation of Climate Change. The Working Group III
contribution to the IPCC’s Fifth Assessment Report (AR5) assesses literature on the
scientific, technological, environmental, economic and social aspects of mitigation of
climate change [Directed by Edenhofer, O., R.
Pichs-Madruga, Y. Sokona, E. Farahani, S. Kadner, K. Seyboth, A. Adler, I. Baum, S.
Brunner, P. Eickemeier, B. Kriemann, J. Savolainen, S. Schlömer, C. von Stechow, T.
Zwickel and J.C. Minx]. Cambridge University Press, Cambridge, United Kingdom and
New York (State of New York), United States of America. 158 pages.
https://www.ipcc.ch/report/ar5/wg3/
90](https://image.slidesharecdn.com/dossierscientifiqueenglishfinal-210419101042/85/Scientific-brief-for-the-Planet-91-320.jpg)
![IPCC (2012). Summary for Policy Makers. Managing the Risks of Extreme Events and
Disasters to Advance Climate Change Adaptation [Directed by Field, C.B., V. Barros, T.F.
Stocker, D. Qin, D.J. Dokken, K.L. Ebi, M.D. Mastrandrea, K.J. Mach, G.-K. Plattner, S.K.
Allen, M. Tignor and P.M. Midgley]. Special Report by IPCC Working Groups I and II about
climate change. Cambridge University Press, Cambridge, United Kingdom and New York
(State of New York), United States of America, 20 pages.
https://www.ipcc.ch/report/managing-the-risks-of-extreme-events-and-disasters-to-advance-
climate-change-adaptation/
IPCC (2019). Summary for Policy Makers. Special Report on the Ocean and Cryosphere in a
Changing Climate Special Report on the Ocean and Cryosphere in a Changing Climate by
the IPCC [Directed by H.-O. Pörtner, D.C. Roberts, V. Masson-Delmotte, P. Zhai, M. Tignor,
E. Poloczanska, K. Mintenbeck, M. Nicolai, A. Okem,
J. Petzold, B. Rama and N. M. Weyer]. 33 pages. https://www.ipcc.ch/srocc/
IPCC (2019). Summary for Policy Makers, Climate Change and Land. An IPCC Special
Report on climate change, desertification, land degradation, sustainable land management,
food security, and greenhouse gas fluxes in terrestrial ecosystems. [P.R. Shukla, J. Skea, E.
Calvo Buendia, V. Masson-Delmotte, H.- O. Pörtner, D. C. Roberts, P. Zhai, R. Slade, S.
Connors, R. van Diemen, M. Ferrat, E. Haughey, S. Luz, S. Neogi, M. Pathak, J. Petzold, J.
Portugal Pereira,
P. Vyas, E. Huntley, K. Kissick, M. Belkacemi, J. Malley, (Publ. Dir.)]. 36
pages.https://www.ipcc.ch/srccl/
UNEP (2019). Frontiers 2018/19, Emerging Issues of Environmental Concern, United
Nations Environment Programme, Nairobi. 78 pages.
https://www.unenvironment.org/resources/frontiers-201819-emerging-issues-environmental
-concern
WMO (2018) Climate Change: Science and solutions. World Meteorological Organization
Journal - volume 67 (2). 75 pages.
https://public.wmo.int/en/resources/bulletin?tid-type-bulletin=516
WMO (2019). The global climate 2015-2019. [Peter Siegmund, Jacob Abermann, Omar
Baddour, Pep Canadell, Anny Cazenave, Chris Derksen, Arthur Garreau (Météo-France),
Stephen Howell, Matthias Huss, Kirsten Isensee, John Kennedy, Ruth Mottram, Rodica Nitu,
Selvaraju Ramasamy, Katherina Schoo, Michael Sparrow, Oksana Tarasova, Blair Trewin,
Markus Ziese]. 21 pages.
https://public.wmo.int/en/media/press-release/global-climate-2015-2019-climate-change-ac
celerates ng
91](https://image.slidesharecdn.com/dossierscientifiqueenglishfinal-210419101042/85/Scientific-brief-for-the-Planet-92-320.jpg)
![UNEP, Christensen, J. and Olhoff, A. (2019). Lessons from a decade of emissions gap
assessments. United Nations Environment Programme, Nairobi. 18 pages.
https://wedocs.unep.org/bitstream/handle/20.500.11822/30022/EGR10.pdf?sequence=
1&isAllowed=y*
Global Carbon Project (2019). Global Energy Growth Is Outpacing Decarbonization. A
special report for the United Nations Climate Action Summit September 2019. [Jackson
RB, Le Quéré C, Andrew RM , Canadell JG, Korsbakken JI , Liu Z, Peters GP , Zheng B,
Friedlingstein], International Project Office, Canberra Australia. 12 pages.
https://iopscience.iop.org/article/10.1088/1748-9326/aaf303
Global Carbon Project (2019). Carbon budget and trends 2019.
[www.globalcarbonproject.org/carbonbudget] published on 4 December 2019, along with
any other original peer-reviewed papers and data sources as appropriate. 90 slides.
www.globalcarbonproject.org/carbonbudget
Citepa (2019). Gaz à effet de serre et polluants atmosphériques, Bilan des émissions en
France de 1990 à 2017. Rapport national d’inventaire. 447 pages.
https://www.citepa.org/fr/2020_06_a07/
Ministère de la transition écologique et solidaire et I4CE (2020). Datalab - Chiffres clés du
climat 2020 - France, Europe et Monde. 88 pages.
https://www.i4ce.org/download/datalab-chiffres-cles-du-climat-france-europe-et-monde/
ONERC, 2018. Les événements météorologiques extrêmes dans un contexte de
changement climatique. Rapport de l’ONERC au Premier ministre et au Parlement. 199
pages.
https://www.ecologie.gouv.fr/observatoire-national-sur-effets-du-rechauffement-climatiqu
e-onerc
International Energy Agency (2020). The impacts of the Covid-19 crisis on global energy
demand and CO₂ emissions. Global Energy Review 2020, Paris. 52 pages.
https://www.iea.org/reports/global-energy-review-2020
International Energy Agency (2020), Accelerating technology progress for a sustainable
future. Special Report on Clean Energy Innovation, Paris. 183 pages.
https://www.iea.org/reports/clean-energy-innovation
United Nations Population, Department of Economic and Social Affairs, Population
Division (2019). World Population Prospects 2019: Highlights. 46 pages.
https://population.un.org/wpp/
92](https://image.slidesharecdn.com/dossierscientifiqueenglishfinal-210419101042/85/Scientific-brief-for-the-Planet-93-320.jpg)
![Global Alliance for Buildings and Construction, International Energy Agency and the United
Nations Environment Programme (2019). Towards a zero-emission, efficient and resilient
buildings and construction sector. 2019 global status report for buildings and construction.
39 pages.
https://globalabc.org/resources/publications
European Environment Agency, 2015. Living in a Changing Climate Signals 2015. 37 pages.
https://www.eea.europa.eu/publications/signals-2015
HLPE (2012). Food Security and Climate Change. Report by the high level of experts on
food security and nutrition of the International Food Security Committee, Rome. 115
pages. http://www.fao.org/cfs/cfs-hlpe/reports/en/
United Nations Food and Agriculture Organization (2016). Breeding and Climate Change.
FAO Work on Climate Change. 16 pages.
http://www.fao.org/publications/en/?page=1&ipp=4&tx_dynalist_pi1[par]=YToxOntzOjE6Ik
wiO3M6MToiMCI7fQ==
United Nations Food and Agriculture Organization (2016). Adapting Agriculture to
Climate Change. FAO Work on Climate Change. 16 pages.
http://www.fao.org/publications/en/?page=1&ipp=4&tx_dynalist_pi1[par]=YToxOntzOjE6IkwiO3M6
MToiMCI7fQ==
United Nations Food and Agriculture Organization (2016). Energy, Agriculture and Climate
Change: FAO Work on Climate Change. 16 pages.
http://www.fao.org/climate-change/en/
IPCC (2011). Summary for Policy Makers and Technical Summary Special IPPC report about
renewable energy and climate change mitigation [Directed by O. Edenhofer, R.
Pichs-Madruga, Y. Sokona, K. Seyboth, P. Matschoss, S. Kadner, T. Zwickel, P. Eickemeier, G.
Hansen, S. Schlömer et C. von Stechow], Cambridge University Press, Cambridge, United
Kingdom and New York (State of New York), United States of America. 242 pages.
https://www.ipcc.ch/reports/
ADEME (2015). Un mix électrique 100% renouvelable ? Analyses et optimisations. Rapport.
163 pages. https://www.ademe.fr/mix-electrique-100-renouvelable-analyses-optimisations
ADEME (2018). Intégration des énergies renouvelables et de récupération dans l’industrie :
à chaque secteur ses solutions. Rapport. [Marina BOUCHER, Manon GERBAUD, ENEA
Consulting, David BARDINA, Suzan HMOUD, Céline HUITRIC, KERDOS Energy, Mehdi
GUELLIL, Etienne MARTIN]. 148 pages.
https://www.ademe.fr/integration-energies-renouvelables-recuperation-lindustrie
ADEME (2017). Actualisation du scénario Energie-Climat ADEME 2035-2050. [Guilain Cals,
Patricia Sidat, Robert Bellini, Vincent Guenard, Nadine Berthomieu, David Canal, Philippe
Laplaige, Julien Delanoe, Rodolphe Morlot, Stéphane Biscaglia, Astrid Cardona Maestro,
Simon Thouin, Marc Bardinal, Thomas Eglin, Bruno Gagnepain, Sarah Martin, Florence
93](https://image.slidesharecdn.com/dossierscientifiqueenglishfinal-210419101042/85/Scientific-brief-for-the-Planet-94-320.jpg)
![Proharam, Frédéric Streiff, Aicha El Khamlichi, Luc Bodineau, Guillaume Bastide, Yves Moch,
Solène Marry, Anne Lefranc, Mathieu Mefflet-Piperel, Mathieu Chassignet, Séverine
Boulard, Sandrine Carballes, Bertrand Olivier Ducreux, Stéphane Barbusse, Gabriel Plassat,
Maxime Pasquier, Yann Tréméac, Marie-Laure Nauleau, Laurent Meunier, Gaël Callonnec].
42 pages.
https://www.ademe.fr/actualisation-scenario-energie-climat-ademe-2035-2050
ADEME, I-CARE & Consult (2016). Sols et Changement climatique : Impacts et Adaptation.
Etat des lieux de la recherche et identification de pistes de recherche. 93 pages.
https://www.ademe.fr/etat-lieux-connaissances-apportees-etudes-experimentales-sources-
particules-fines-france
94](https://image.slidesharecdn.com/dossierscientifiqueenglishfinal-210419101042/85/Scientific-brief-for-the-Planet-95-320.jpg)


