Download to read offline


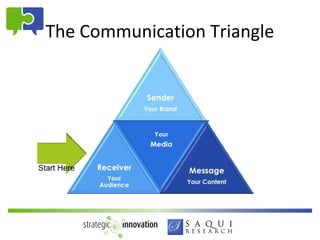
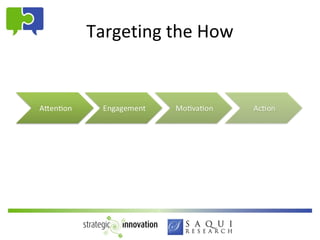
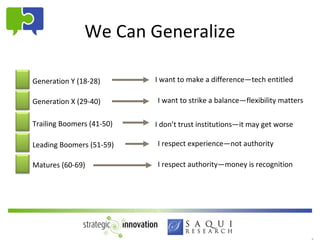
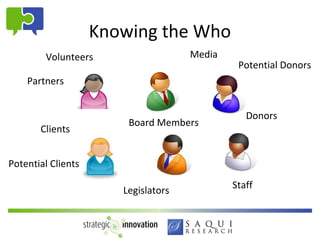


The document discusses data-driven strategies for effective communication targeting different generational groups, emphasizing the importance of understanding their values and preferences. It outlines various research methods (both primary and secondary) to gather insights from potential donors, volunteers, and clients, while also addressing common pitfalls in survey design. The document further highlights the significance of collaborative interpretation of research findings and effective communication of results to internal and external stakeholders.


