Download to read offline
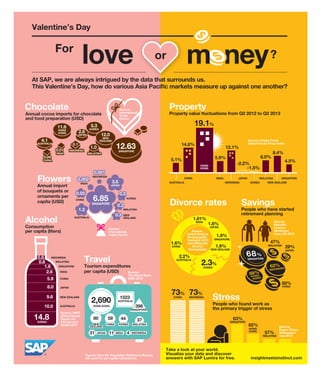
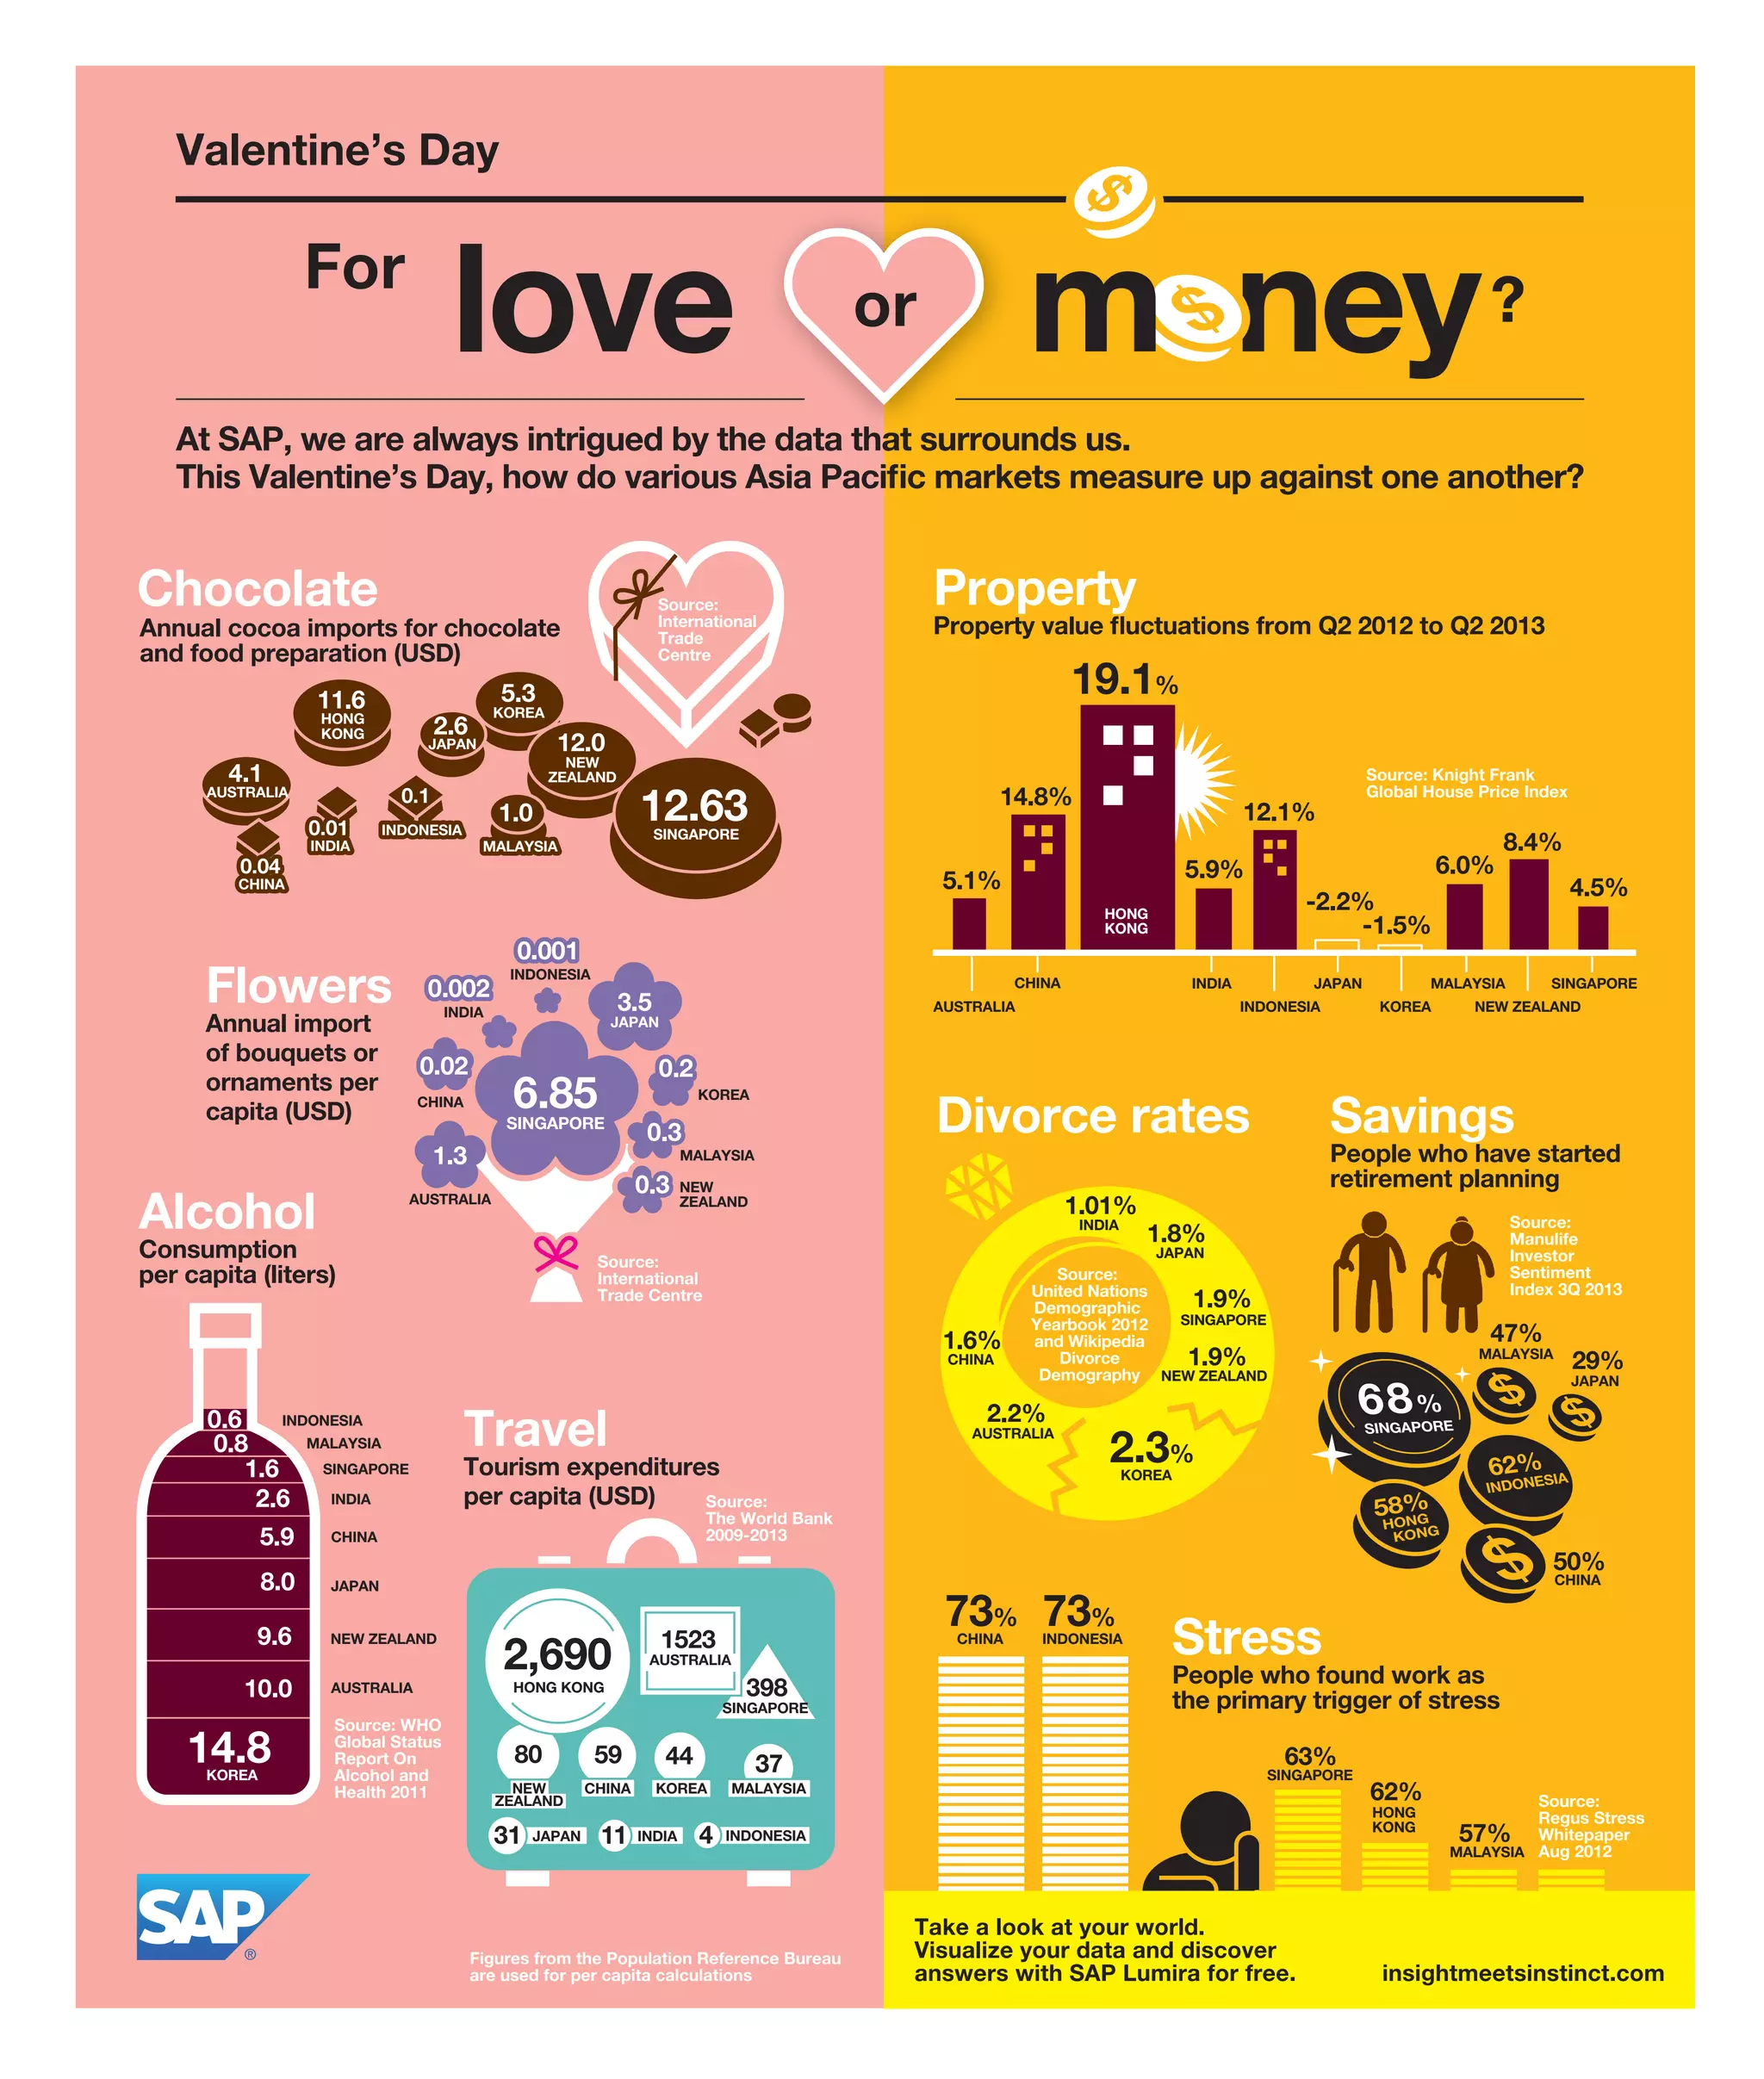

The document analyzes Valentine's Day spending and related data across various Asia Pacific markets, highlighting imports for chocolate, flowers, and consumer behavior. It includes statistics on property values, tourism expenditures, divorce rates, and alcohol consumption per capita. The data aims to provide insights into market comparisons and consumer sentiment in the region.


