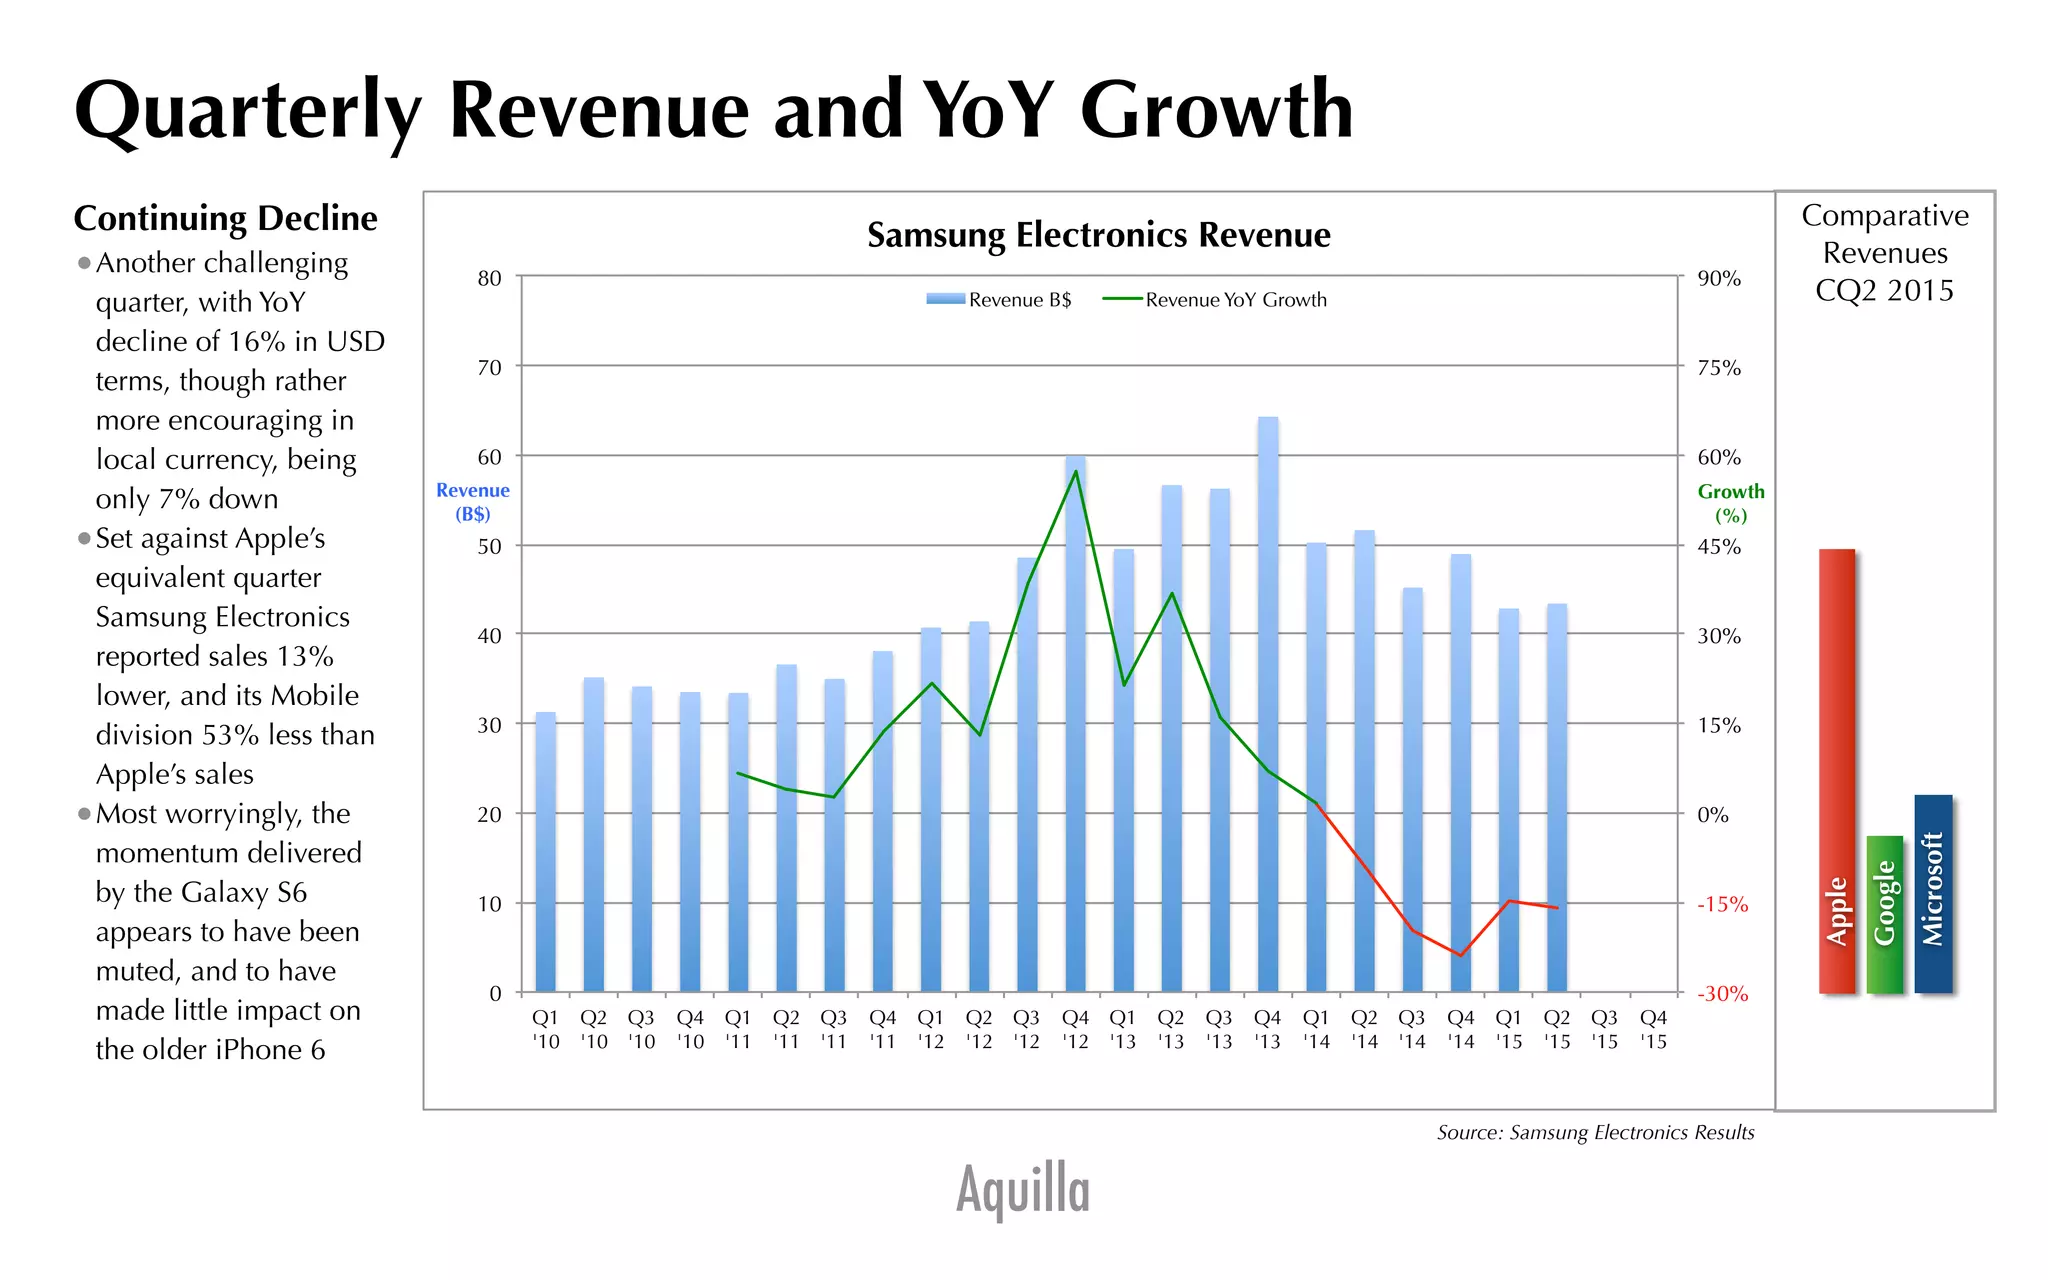
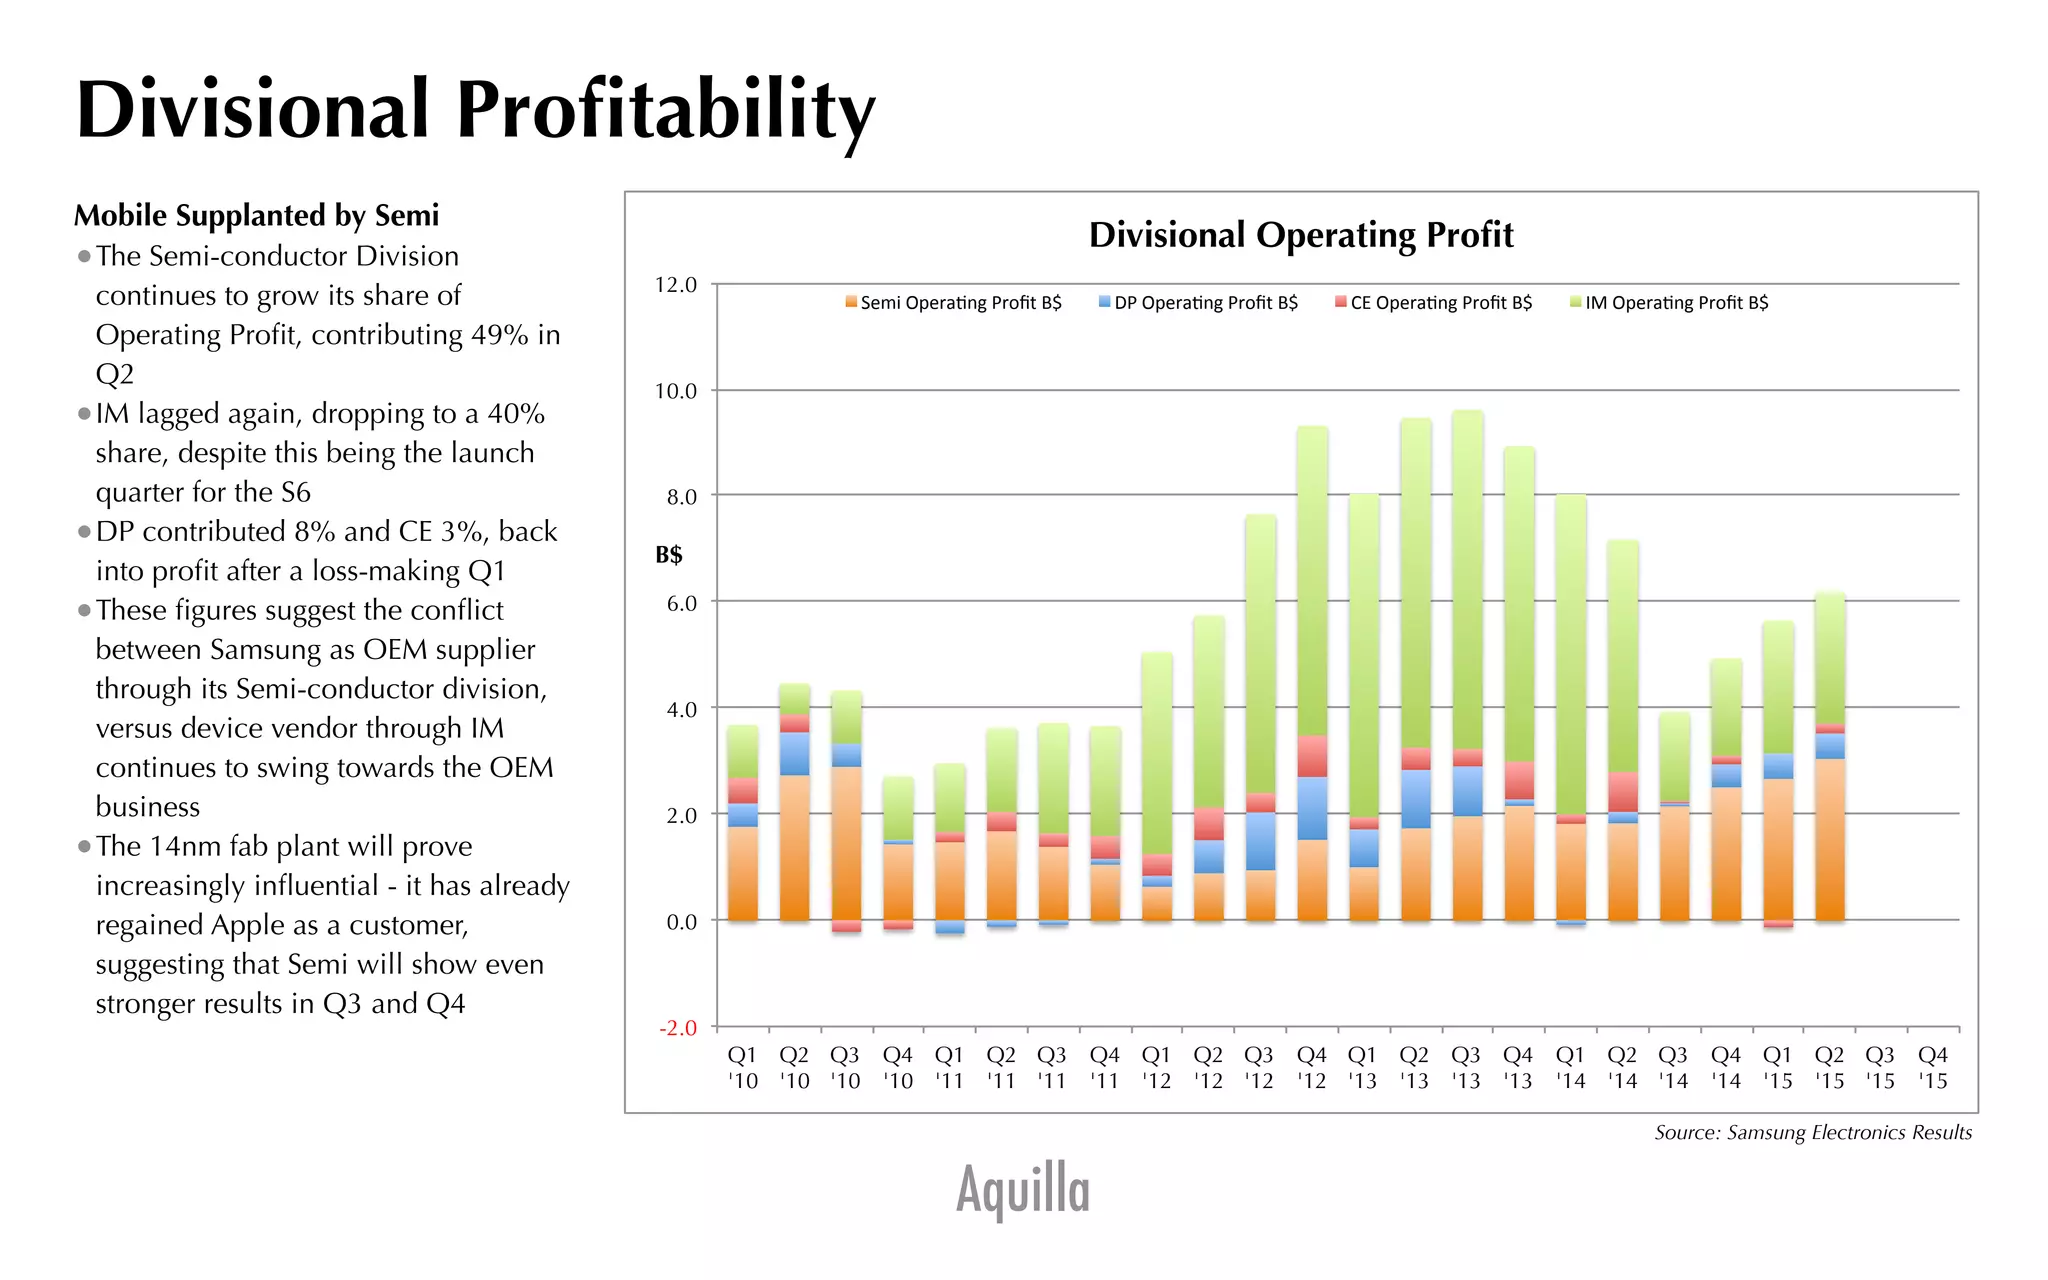
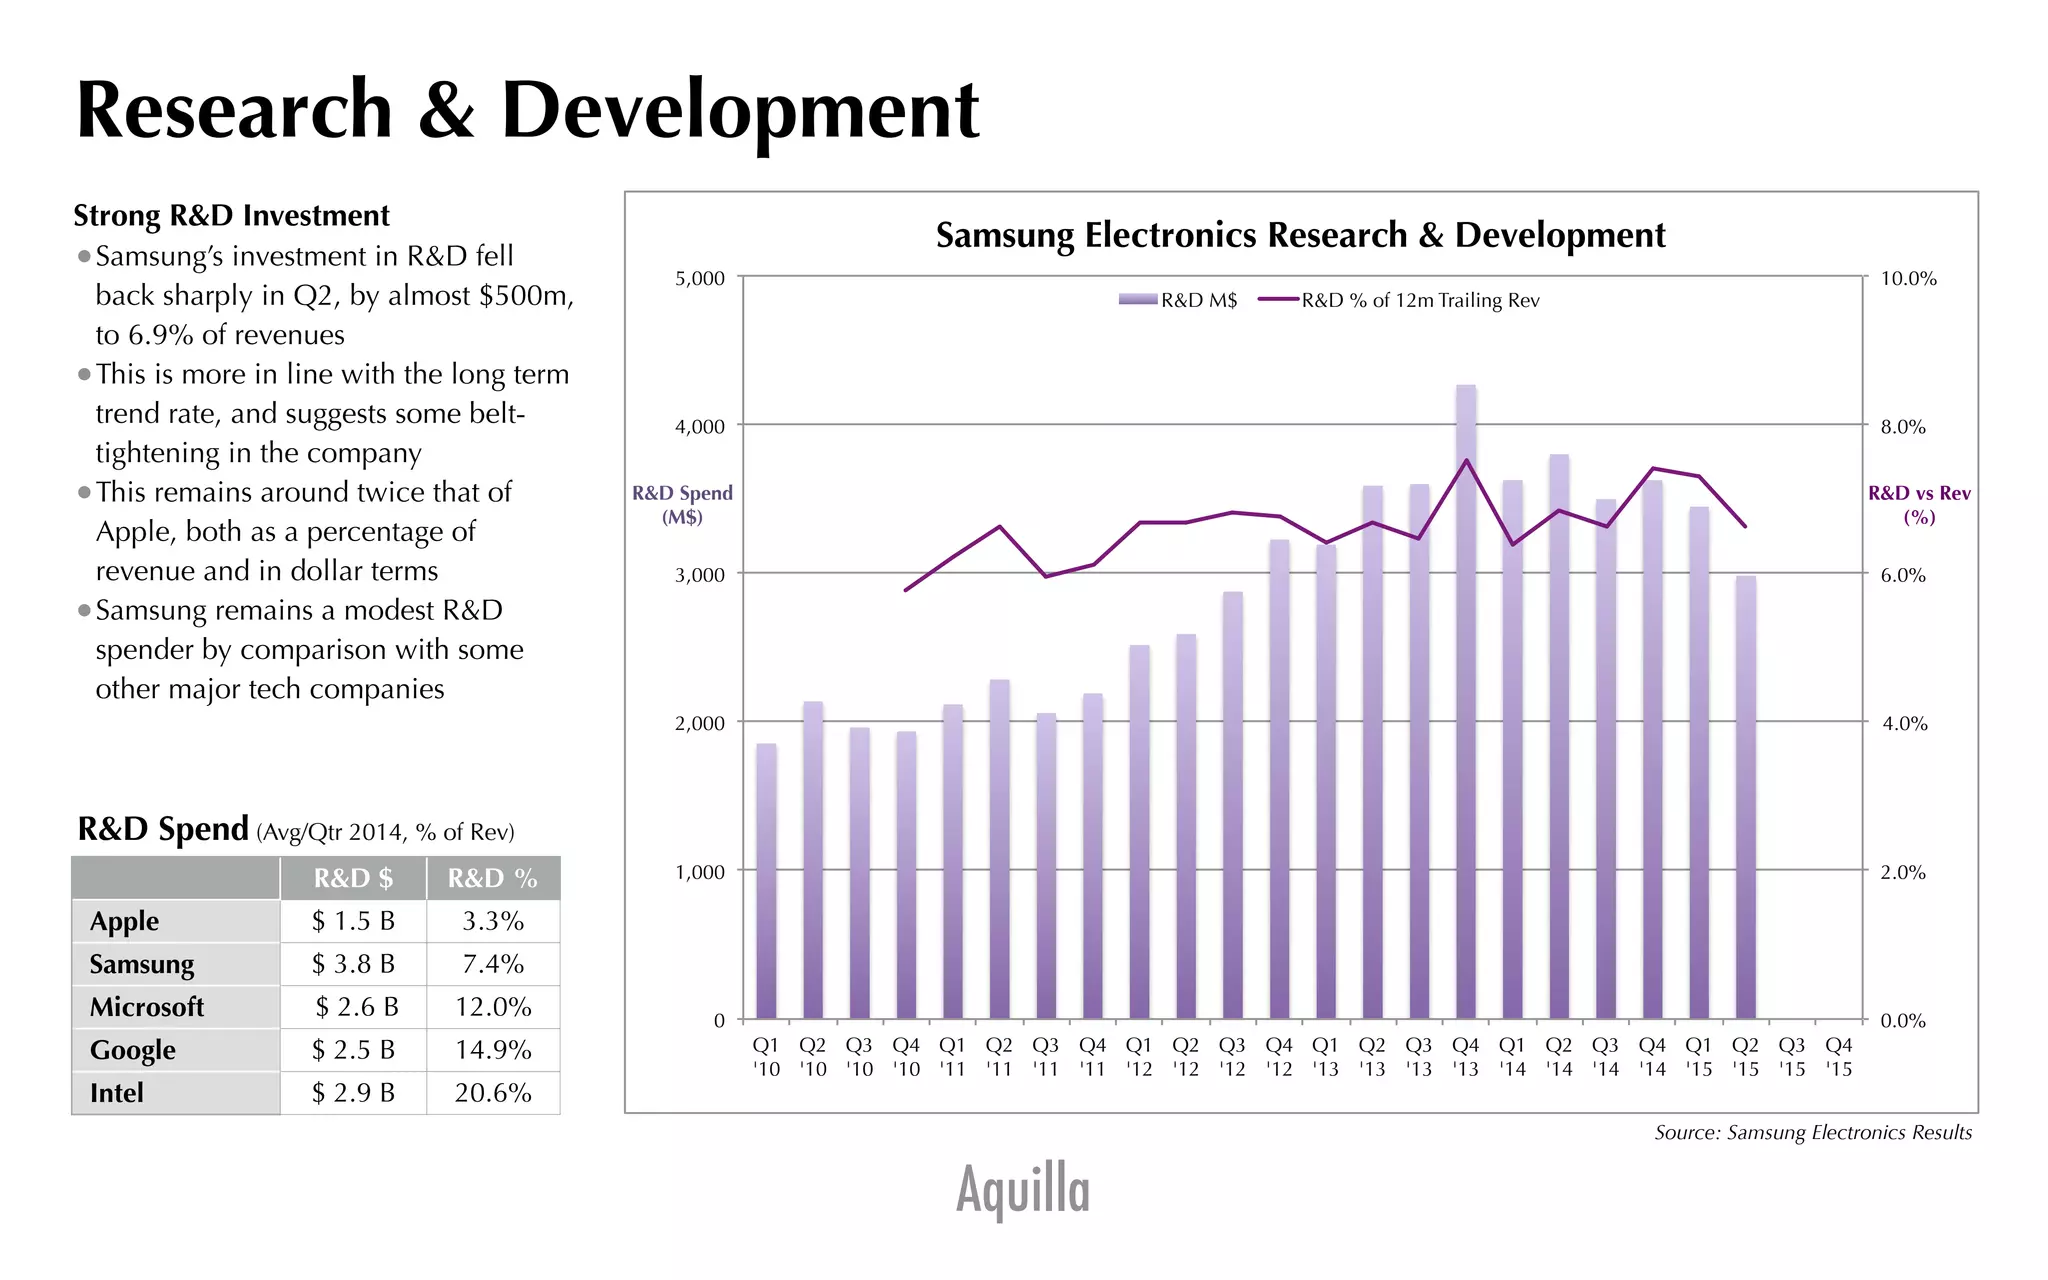
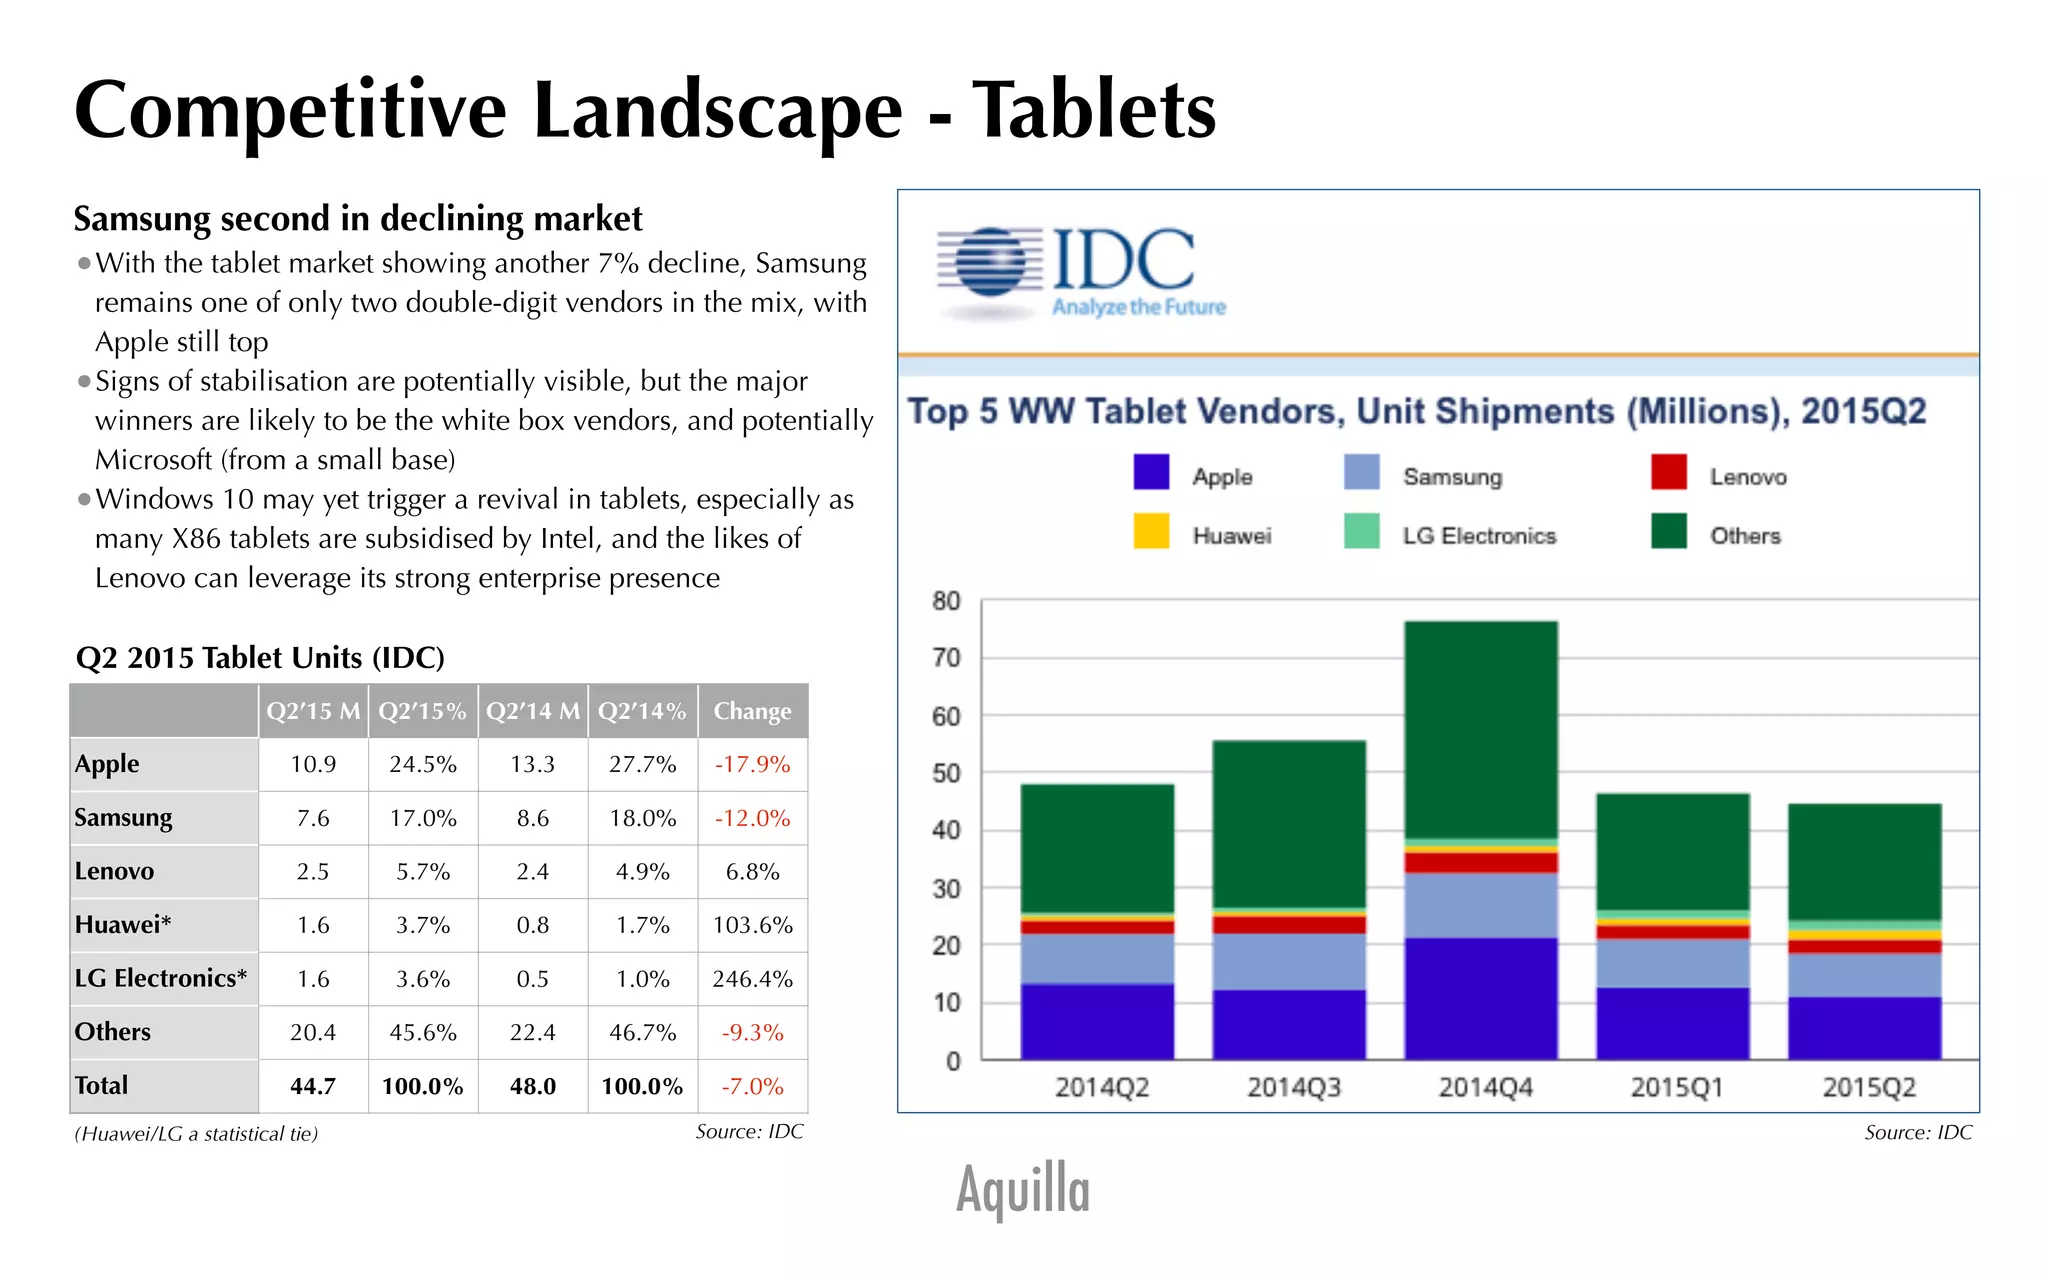
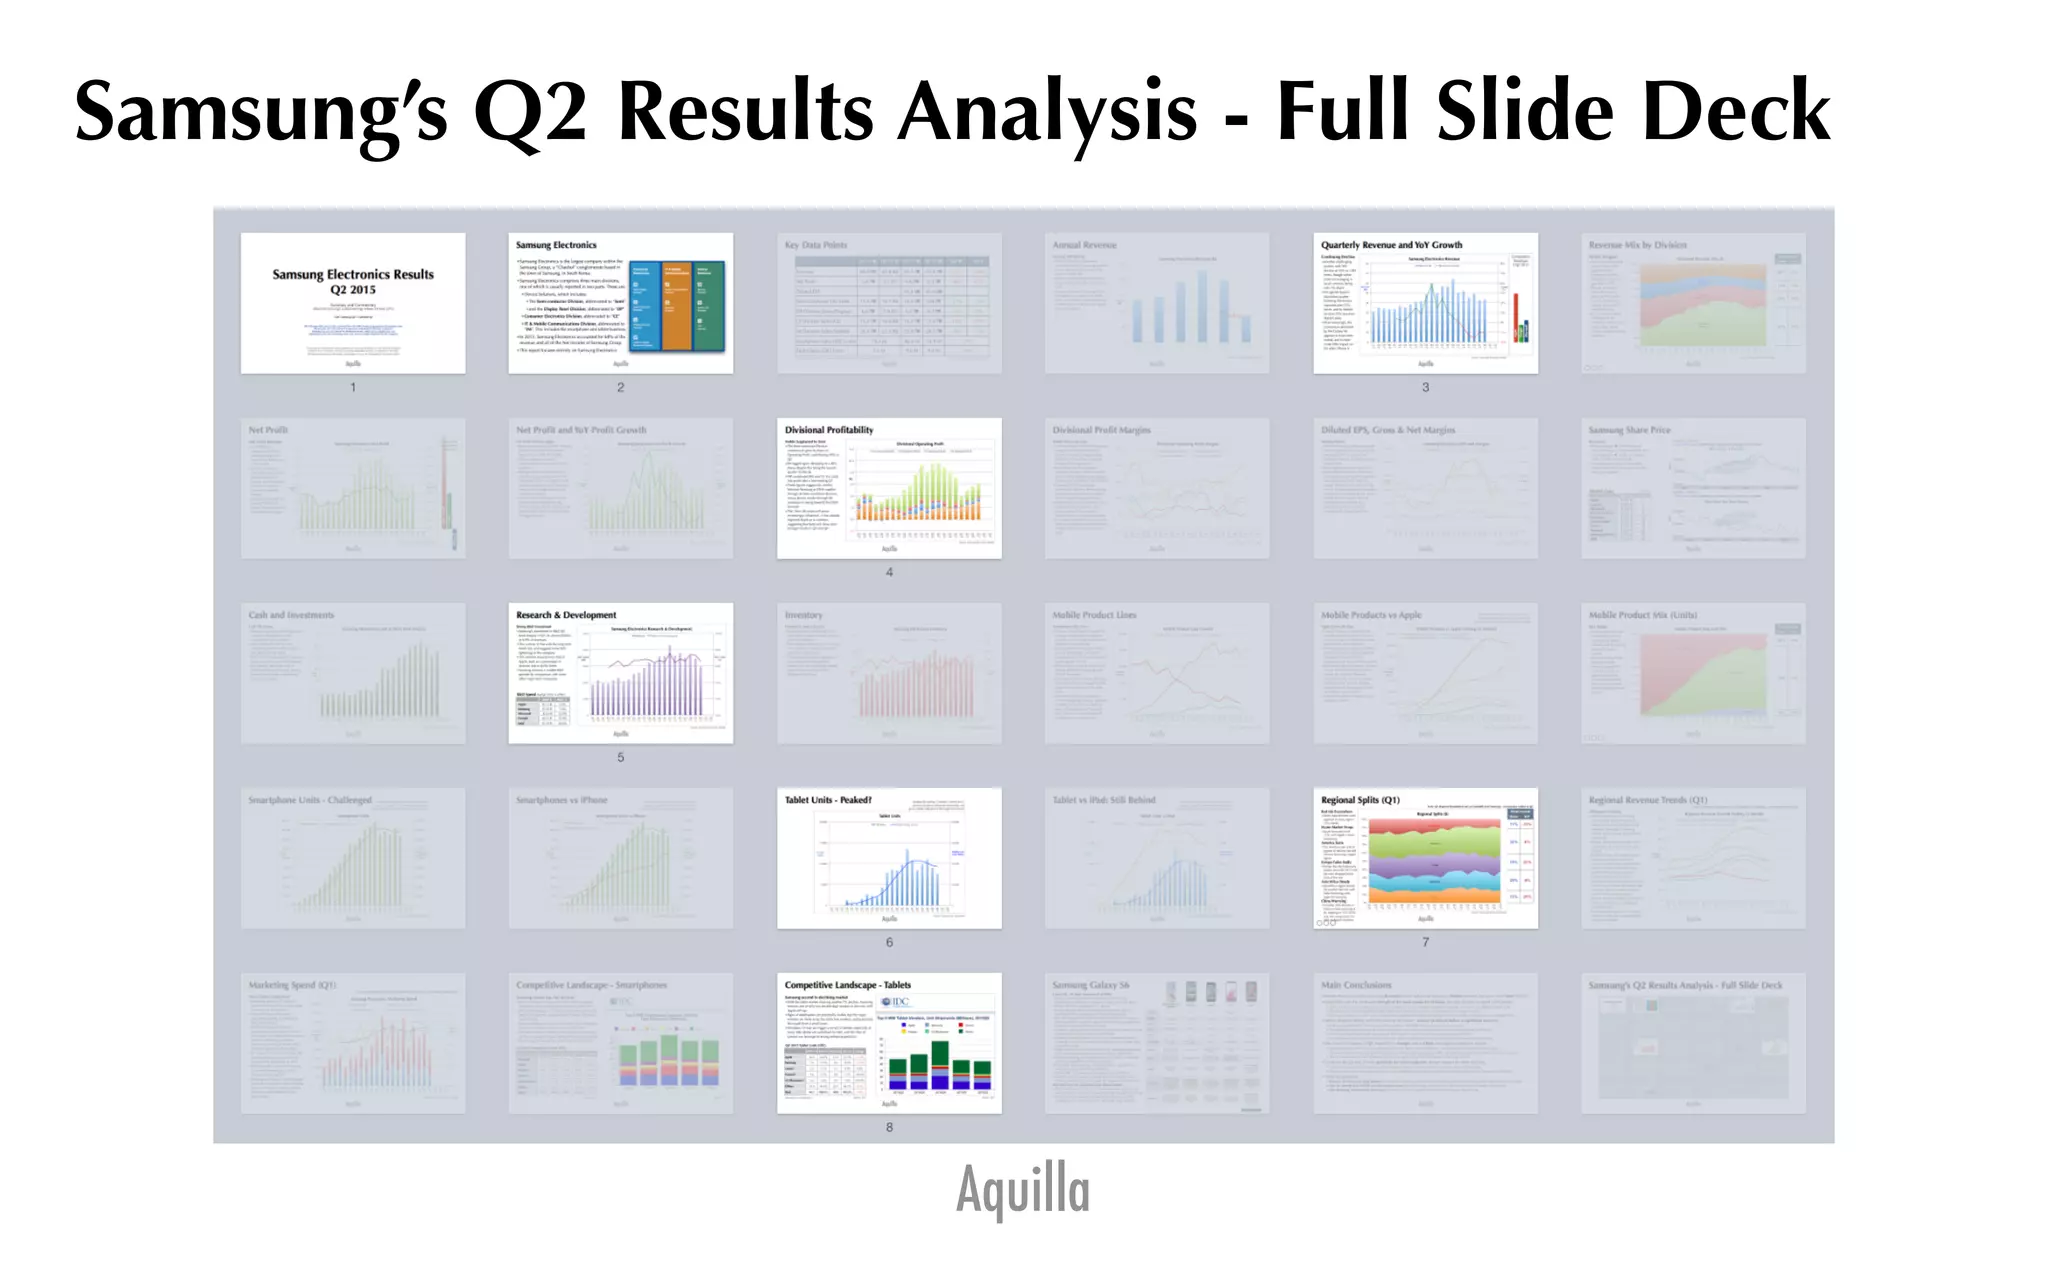
Aquilla
Results Q2 2015
Summary and Commentary
(Based on Samsung Electronics’ un-audited earnings release of 30th July 2015)
Note: Samsung Q2 = Calendar Q2
The following slides are in USD, converted from the KRW results using quarter-end exchange rates.
This provides the most relevant comparisons with global technology companies.
(Samsung has not yet released its Dollarised results, which when available may vary
depending on the mix of exchange rates and currency hedges employed by the company)
These data are derived from results published by Samsung Electronics Co Ltd, from the published
results of other companies, and from assorted independent analysts, as identified in the slides.
The opinions are those of the author, and should in no way be interpreted as investment advice.
Aquilla
Samsung Electronics
•Samsung Electronics is the largest company within the
Samsung Group, a “Chaebol” conglomerate based in
the town of Samsung, in South Korea.
•Samsung Electronics comprises three main divisions,
one of which is usually reported in two parts. These are:
•Device Solutions, which includes:
•The Semi-conductor Division, abbreviated to “Semi”
•and the Display Panel Division, abbreviated to “DP”
•Consumer Electronics Division, abbreviated to “CE”
•IT & Mobile Communications Division, abbreviated to
“IM”. This includes the smartphone and tablet business.
•In 2013, Samsung Electronics accounted for 68% of the
revenue and all of the Net Income of Samsung Group
•This report focuses entirely on Samsung Electronics
Aquilla
Source: Samsung Electronics Results
Quarterly Revenue and YoY Growth
Continuing Decline
•Another challenging
quarter, with YoY
decline of 16% in USD
terms, though rather
more encouraging in
local currency, being
only 7% down
•Set against Apple’s
equivalent quarter
Samsung Electronics
reported sales 13%
lower, and its Mobile
division 53% less than
Apple’s sales
•Most worryingly, the
momentum delivered
by the Galaxy S6
appears to have been
muted, and to have
made little impact on
the older iPhone 6
Comparative
Revenues
CQ2 2015
Apple
Microsoft
Google
-30%
-15%
0%
15%
30%
45%
60%
75%
90%
0
10
20
30
40
50
60
70
80
Q1
'10
Q2
'10
Q3
'10
Q4
'10
Q1
'11
Q2
'11
Q3
'11
Q4
'11
Q1
'12
Q2
'12
Q3
'12
Q4
'12
Q1
'13
Q2
'13
Q3
'13
Q4
'13
Q1
'14
Q2
'14
Q3
'14
Q4
'14
Q1
'15
Q2
'15
Q3
'15
Q4
'15
Growth
(%)
Revenue
(B$)
Samsung Electronics Revenue
Revenue B$ Revenue YoY Growth
Aquilla
Source: Samsung Electronics Results
Divisional Profitability
Mobile Supplanted by Semi
•The Semi-conductor Division
continues to grow its share of
Operating Profit, contributing 49% in
Q2
•IM lagged again, dropping to a 40%
share, despite this being the launch
quarter for the S6
•DP contributed 8% and CE 3%, back
into profit after a loss-making Q1
•These figures suggest the conflict
between Samsung as OEM supplier
through its Semi-conductor division,
versus device vendor through IM
continues to swing towards the OEM
business
•The 14nm fab plant will prove
increasingly influential - it has already
regained Apple as a customer,
suggesting that Semi will show even
stronger results in Q3 and Q4
-2.0
0.0
2.0
4.0
6.0
8.0
10.0
12.0
Q1
'10
Q2
'10
Q3
'10
Q4
'10
Q1
'11
Q2
'11
Q3
'11
Q4
'11
Q1
'12
Q2
'12
Q3
'12
Q4
'12
Q1
'13
Q2
'13
Q3
'13
Q4
'13
Q1
'14
Q2
'14
Q3
'14
Q4
'14
Q1
'15
Q2
'15
Q3
'15
Q4
'15
B$
Divisional Operating Profit
Semi%Opera*ng%Profit%B$% DP%Opera*ng%Profit%B$% CE%Opera*ng%Profit%B$% IM%Opera*ng%Profit%B$%
Aquilla
Source: Samsung Electronics Results
Research & Development
Strong R&D Investment
•Samsung’s investment in R&D fell
back sharply in Q2, by almost $500m,
to 6.9% of revenues
•This is more in line with the long term
trend rate, and suggests some belt-
tightening in the company
•This remains around twice that of
Apple, both as a percentage of
revenue and in dollar terms
•Samsung remains a modest R&D
spender by comparison with some
other major tech companies
R&D $ R&D %
Apple $ 1.5 B 3.3%
Samsung $ 3.8 B 7.4%
Microsoft $ 2.6 B 12.0%
Google $ 2.5 B 14.9%
Intel $ 2.9 B 20.6%
R&D Spend (Avg/Qtr 2014, % of Rev)
0.0%
2.0%
4.0%
6.0%
8.0%
10.0%
0
1,000
2,000
3,000
4,000
5,000
Q1
'10
Q2
'10
Q3
'10
Q4
'10
Q1
'11
Q2
'11
Q3
'11
Q4
'11
Q1
'12
Q2
'12
Q3
'12
Q4
'12
Q1
'13
Q2
'13
Q3
'13
Q4
'13
Q1
'14
Q2
'14
Q3
'14
Q4
'14
Q1
'15
Q2
'15
Q3
'15
Q4
'15
R&D vs Rev
(%)
R&D Spend
(M$)
Samsung Electronics Research & Development
R&D M$ R&D % of 12m Trailing Rev
Aquilla
Tablet Units - Peaked?
Source: Gartner, IDC and others
0
20,000
40,000
60,000
80,000
0
5,000
10,000
15,000
20,000
Q1
'10
Q2
'10
Q3
'10
Q4
'10
Q1
'11
Q2
'11
Q3
'11
Q4
'11
Q1
'12
Q2
'12
Q3
'12
Q4
'12
Q1
'13
Q2
'13
Q3
'13
Q4
'13
Q1
'14
Q2
'14
Q3
'14
Q4
'14
Q1
'15
Q2
'15
Q3
'15
Q4
'15
Trailing 12m
Units (000s)
Q Units
(000s)
Tablet Units
Tablets kU Tablets Trailing 12m kU
Tracking the trailing 12 months (current and 3
previous Quarters) eliminates seasonality, and
gives a better indication of the longer term trends
Aquilla
Source: Samsung Electronics Results
Regional Splits (Q1)
Red Ink Everywhere
•More sharp declines were
reported in every region -
15% overall
Home Market Drops
•South Korea declined
12%, with Apple a major
beneficiary
America Turns
•The Americas saw a third
quarter of decline, but still
remains Samsung’s largest
region
Europe Fades Badly
•Europe has declined every
quarter since Q3 2013 and
has now dropped below
20% of the mix
Asia/Africa Steady
•Asia/Africa region posted
the smallest decline, with
India becoming a key
target for Samsung
China Worrying
•A further 29% decline in
China is most worrying of
all, slipping to 15% of the
mix. For comparison it is
29% of Apple’s business
Most recent
Share YoY
11% -12%
32% -6%
19% -25%
23% -4%
15% -29%China
Asia/Africa
Europe
Americas
South Korea
0%
10%
20%
30%
40%
50%
60%
70%
80%
90%
100%
Q1
'10
Q2
'10
Q3
'10
Q4
'10
Q1
'11
Q2
'11
Q3
'11
Q4
'11
Q1
'12
Q2
'12
Q3
'12
Q4
'12
Q1
'13
Q2
'13
Q3
'13
Q4
'13
Q1
'14
Q2
'14
Q3
'14
Q4
'14
Q1
'15
Regional Splits ($)
Note: Q1 Regional Breakdowns not yet available from Samsung - commentary relates to Q1
Aquilla
Source: Samsung Electronics Results
Competitive Landscape - Tablets
Samsung second in declining market
•With the tablet market showing another 7% decline, Samsung
remains one of only two double-digit vendors in the mix, with
Apple still top
•Signs of stabilisation are potentially visible, but the major
winners are likely to be the white box vendors, and potentially
Microsoft (from a small base)
•Windows 10 may yet trigger a revival in tablets, especially as
many X86 tablets are subsidised by Intel, and the likes of
Lenovo can leverage its strong enterprise presence
Source: IDCSource: IDC
Q2’15 M Q2’15% Q2’14 M Q2’14% Change
Apple 10.9 24.5% 13.3 27.7% -17.9%
Samsung 7.6 17.0% 8.6 18.0% -12.0%
Lenovo 2.5 5.7% 2.4 4.9% 6.8%
Huawei* 1.6 3.7% 0.8 1.7% 103.6%
LG Electronics* 1.6 3.6% 0.5 1.0% 246.4%
Others 20.4 45.6% 22.4 46.7% -9.3%
Total 44.7 100.0% 48.0 100.0% -7.0%
Q2 2015 Tablet Units (IDC)
(Huawei/LG a statistical tie)
Aquilla
Samsung’s Q2 Results Analysis - Full Slide Deck
Aquilla
Samsung’s Q2 2015 Audited Results Analysis
These popular slides cover an in-depth analysis of Samsung’s Q2 results
The slides shown are an introduction
To receive the full set, including
charts, commentary, interpretation and outlook
plus all slides in full colour
contact
Aquilla Europe
nick@aquilla-europe.com
Aquilla
Nick Graves, CEO • nick@aquilla-europe.com • +44 780 225 6536
Aquilla Europe Ltd • Kennett Cottage • OX9 3QS • UK • www.aquilla-europe.com

Samsung q2'15 commentary intro

  • 1.
    Aquilla Results Q2 2015 Summaryand Commentary (Based on Samsung Electronics’ un-audited earnings release of 30th July 2015) Note: Samsung Q2 = Calendar Q2 The following slides are in USD, converted from the KRW results using quarter-end exchange rates. This provides the most relevant comparisons with global technology companies. (Samsung has not yet released its Dollarised results, which when available may vary depending on the mix of exchange rates and currency hedges employed by the company) These data are derived from results published by Samsung Electronics Co Ltd, from the published results of other companies, and from assorted independent analysts, as identified in the slides. The opinions are those of the author, and should in no way be interpreted as investment advice.
  • 2.
    Aquilla Samsung Electronics •Samsung Electronicsis the largest company within the Samsung Group, a “Chaebol” conglomerate based in the town of Samsung, in South Korea. •Samsung Electronics comprises three main divisions, one of which is usually reported in two parts. These are: •Device Solutions, which includes: •The Semi-conductor Division, abbreviated to “Semi” •and the Display Panel Division, abbreviated to “DP” •Consumer Electronics Division, abbreviated to “CE” •IT & Mobile Communications Division, abbreviated to “IM”. This includes the smartphone and tablet business. •In 2013, Samsung Electronics accounted for 68% of the revenue and all of the Net Income of Samsung Group •This report focuses entirely on Samsung Electronics
  • 3.
    Aquilla Source: Samsung ElectronicsResults Quarterly Revenue and YoY Growth Continuing Decline •Another challenging quarter, with YoY decline of 16% in USD terms, though rather more encouraging in local currency, being only 7% down •Set against Apple’s equivalent quarter Samsung Electronics reported sales 13% lower, and its Mobile division 53% less than Apple’s sales •Most worryingly, the momentum delivered by the Galaxy S6 appears to have been muted, and to have made little impact on the older iPhone 6 Comparative Revenues CQ2 2015 Apple Microsoft Google -30% -15% 0% 15% 30% 45% 60% 75% 90% 0 10 20 30 40 50 60 70 80 Q1 '10 Q2 '10 Q3 '10 Q4 '10 Q1 '11 Q2 '11 Q3 '11 Q4 '11 Q1 '12 Q2 '12 Q3 '12 Q4 '12 Q1 '13 Q2 '13 Q3 '13 Q4 '13 Q1 '14 Q2 '14 Q3 '14 Q4 '14 Q1 '15 Q2 '15 Q3 '15 Q4 '15 Growth (%) Revenue (B$) Samsung Electronics Revenue Revenue B$ Revenue YoY Growth
  • 4.
    Aquilla Source: Samsung ElectronicsResults Divisional Profitability Mobile Supplanted by Semi •The Semi-conductor Division continues to grow its share of Operating Profit, contributing 49% in Q2 •IM lagged again, dropping to a 40% share, despite this being the launch quarter for the S6 •DP contributed 8% and CE 3%, back into profit after a loss-making Q1 •These figures suggest the conflict between Samsung as OEM supplier through its Semi-conductor division, versus device vendor through IM continues to swing towards the OEM business •The 14nm fab plant will prove increasingly influential - it has already regained Apple as a customer, suggesting that Semi will show even stronger results in Q3 and Q4 -2.0 0.0 2.0 4.0 6.0 8.0 10.0 12.0 Q1 '10 Q2 '10 Q3 '10 Q4 '10 Q1 '11 Q2 '11 Q3 '11 Q4 '11 Q1 '12 Q2 '12 Q3 '12 Q4 '12 Q1 '13 Q2 '13 Q3 '13 Q4 '13 Q1 '14 Q2 '14 Q3 '14 Q4 '14 Q1 '15 Q2 '15 Q3 '15 Q4 '15 B$ Divisional Operating Profit Semi%Opera*ng%Profit%B$% DP%Opera*ng%Profit%B$% CE%Opera*ng%Profit%B$% IM%Opera*ng%Profit%B$%
  • 5.
    Aquilla Source: Samsung ElectronicsResults Research & Development Strong R&D Investment •Samsung’s investment in R&D fell back sharply in Q2, by almost $500m, to 6.9% of revenues •This is more in line with the long term trend rate, and suggests some belt- tightening in the company •This remains around twice that of Apple, both as a percentage of revenue and in dollar terms •Samsung remains a modest R&D spender by comparison with some other major tech companies R&D $ R&D % Apple $ 1.5 B 3.3% Samsung $ 3.8 B 7.4% Microsoft $ 2.6 B 12.0% Google $ 2.5 B 14.9% Intel $ 2.9 B 20.6% R&D Spend (Avg/Qtr 2014, % of Rev) 0.0% 2.0% 4.0% 6.0% 8.0% 10.0% 0 1,000 2,000 3,000 4,000 5,000 Q1 '10 Q2 '10 Q3 '10 Q4 '10 Q1 '11 Q2 '11 Q3 '11 Q4 '11 Q1 '12 Q2 '12 Q3 '12 Q4 '12 Q1 '13 Q2 '13 Q3 '13 Q4 '13 Q1 '14 Q2 '14 Q3 '14 Q4 '14 Q1 '15 Q2 '15 Q3 '15 Q4 '15 R&D vs Rev (%) R&D Spend (M$) Samsung Electronics Research & Development R&D M$ R&D % of 12m Trailing Rev
  • 6.
    Aquilla Tablet Units -Peaked? Source: Gartner, IDC and others 0 20,000 40,000 60,000 80,000 0 5,000 10,000 15,000 20,000 Q1 '10 Q2 '10 Q3 '10 Q4 '10 Q1 '11 Q2 '11 Q3 '11 Q4 '11 Q1 '12 Q2 '12 Q3 '12 Q4 '12 Q1 '13 Q2 '13 Q3 '13 Q4 '13 Q1 '14 Q2 '14 Q3 '14 Q4 '14 Q1 '15 Q2 '15 Q3 '15 Q4 '15 Trailing 12m Units (000s) Q Units (000s) Tablet Units Tablets kU Tablets Trailing 12m kU Tracking the trailing 12 months (current and 3 previous Quarters) eliminates seasonality, and gives a better indication of the longer term trends
  • 7.
    Aquilla Source: Samsung ElectronicsResults Regional Splits (Q1) Red Ink Everywhere •More sharp declines were reported in every region - 15% overall Home Market Drops •South Korea declined 12%, with Apple a major beneficiary America Turns •The Americas saw a third quarter of decline, but still remains Samsung’s largest region Europe Fades Badly •Europe has declined every quarter since Q3 2013 and has now dropped below 20% of the mix Asia/Africa Steady •Asia/Africa region posted the smallest decline, with India becoming a key target for Samsung China Worrying •A further 29% decline in China is most worrying of all, slipping to 15% of the mix. For comparison it is 29% of Apple’s business Most recent Share YoY 11% -12% 32% -6% 19% -25% 23% -4% 15% -29%China Asia/Africa Europe Americas South Korea 0% 10% 20% 30% 40% 50% 60% 70% 80% 90% 100% Q1 '10 Q2 '10 Q3 '10 Q4 '10 Q1 '11 Q2 '11 Q3 '11 Q4 '11 Q1 '12 Q2 '12 Q3 '12 Q4 '12 Q1 '13 Q2 '13 Q3 '13 Q4 '13 Q1 '14 Q2 '14 Q3 '14 Q4 '14 Q1 '15 Regional Splits ($) Note: Q1 Regional Breakdowns not yet available from Samsung - commentary relates to Q1
  • 8.
    Aquilla Source: Samsung ElectronicsResults Competitive Landscape - Tablets Samsung second in declining market •With the tablet market showing another 7% decline, Samsung remains one of only two double-digit vendors in the mix, with Apple still top •Signs of stabilisation are potentially visible, but the major winners are likely to be the white box vendors, and potentially Microsoft (from a small base) •Windows 10 may yet trigger a revival in tablets, especially as many X86 tablets are subsidised by Intel, and the likes of Lenovo can leverage its strong enterprise presence Source: IDCSource: IDC Q2’15 M Q2’15% Q2’14 M Q2’14% Change Apple 10.9 24.5% 13.3 27.7% -17.9% Samsung 7.6 17.0% 8.6 18.0% -12.0% Lenovo 2.5 5.7% 2.4 4.9% 6.8% Huawei* 1.6 3.7% 0.8 1.7% 103.6% LG Electronics* 1.6 3.6% 0.5 1.0% 246.4% Others 20.4 45.6% 22.4 46.7% -9.3% Total 44.7 100.0% 48.0 100.0% -7.0% Q2 2015 Tablet Units (IDC) (Huawei/LG a statistical tie)
  • 9.
    Aquilla Samsung’s Q2 ResultsAnalysis - Full Slide Deck
  • 10.
    Aquilla Samsung’s Q2 2015Audited Results Analysis These popular slides cover an in-depth analysis of Samsung’s Q2 results The slides shown are an introduction To receive the full set, including charts, commentary, interpretation and outlook plus all slides in full colour contact Aquilla Europe nick@aquilla-europe.com
  • 11.
    Aquilla Nick Graves, CEO• nick@aquilla-europe.com • +44 780 225 6536 Aquilla Europe Ltd • Kennett Cottage • OX9 3QS • UK • www.aquilla-europe.com