Download as PDF, PPTX

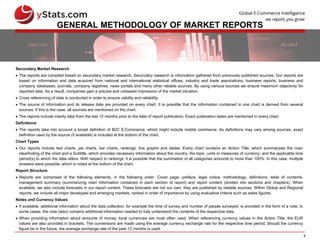
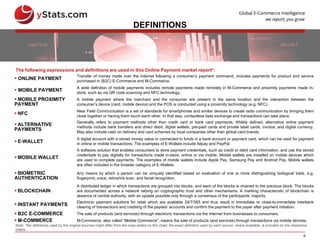


The document provides an overview of the methodology used in market reports on the global online payment market. It discusses secondary market research sources and definitions used. It also outlines the structure and contents of the report, including sections on global developments, regional analyses of advanced and emerging markets, definitions of terms, charts, and a table of contents.


