This chart and graph illustrates sales history of building lots in Harford County as reported by MRIS (MLS). It does not count any multiple lot sales between developers and builders.
Vancouver real estate stats package, january 2013Matt Collinge
VANCOUVER, B.C. – February 4, 2013 – Home buyer demand remains below historical
averages in the Greater Vancouver housing market. This has led some home sellers to remove their homes from the market in recent months.
office space toronto, toronto office space, office search toronto, office space in toronto, office rentals toronto, commercial office space, commercial real estate toronto, office rent toronto, toronto offices for lease
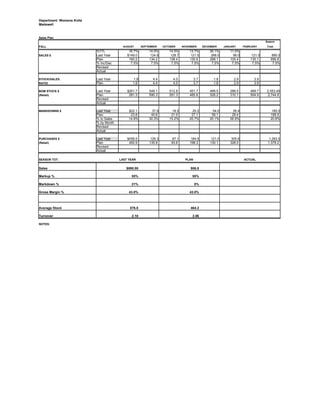
1. Department: Womens Knits
Madewell
Sales Plan
Season
FALL AUGUST SEPTEMBER OCTOBER NOVEMBER DECEMBER JANUARY FEBRUARY Total
%TTL 16.7% 14.0% 14.5% 13.7% 30.1% 11.0%
SALES $ Last Year $149.0 124.8 128.7 121.5 268.0 98.0 121.0 890.0
Plan 160.2 134.2 138.4 130.6 288.1 105.4 130.1 956.8
% Inc/Dec 7.5% 7.5% 7.5% 7.5% 7.5% 7.5% 7.5% 7.5%
Revised
Actual
STOCK/SALES Last Year 1.8 4.4 4.0 3.7 1.8 2.9 3.9
RATIO Plan 1.8 4.4 4.0 3.7 1.8 2.9 3.9
BOM STOCK $ Last Year $261.7 549.1 512.8 451.7 489.5 288.5 469.7 2,553.40
(Retail) Plan 281.3 590.3 551.3 485.6 526.2 310.1 504.9 2,744.8
Revised
Actual
MARKDOWNS $ Last Year $22.1 37.8 19.5 25.2 54.0 26.4 185.0
Plan 23.8 40.6 21.0 27.1 58.1 28.4 198.9
% to Sales 14.8% 30.3% 15.2% 20.7% 20.1% 26.9% 20.8%
% by Month
Revised
Actual
PURCHASES $ Last Year $458.5 126.3 87.1 184.5 121.0 305.6 1,283.0
(Retail) Plan 492.9 135.8 93.6 198.3 130.1 328.5 1,379.2
Revised
Actual
SEASON TOT. LAST YEAR PLAN ACTUAL
Sales $890.00 956.8
Markup % 55% 55%
Markdown % 21% 0%
Gross Margin % 43.0% 43.0%
Average Stock 876.8 464.2
Turnover 2.10 2.06
NOTES: