1. SALES FORCE ALIGNMENT
Ricky Bilakhia
Instructor – Prof. Khasha Dehnad
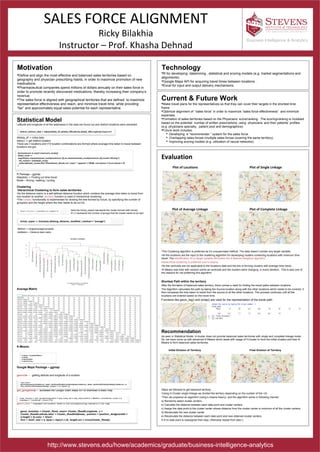
Evaluation
Plot of Locations Plot of Single Linkage
Plot of Average Linkage Plot of Complete Linkage
•The Clustering algorithm is preferred as it’s unsupervised method. The data doesn’t contain any target variable.
•All the locations are the input to the clustering algorithm for developing clusters containing locations with minimum time
travel. The identification of no target variable eliminates the K-Nearest Neighbor algorithm.
Hierarchical clustering is preferred over k-means,
•As the centroids are not applicable to the locations data and the aim is forming clusters with average time travel.
•K-Means was tried with random points as centroids and the clusters were changing in every iteration. This is also one of
the reasons for not preferring this algorithm.
Shortest Path within the territory
After the formation of balanced sales territory, there comes a need for finding the travel paths between locations.
The Algorithm calculates the path by taking the Source location along with the other locations which needs to be covered. It
then compares the time taken to travel from the source to all the other locations. This process continues until all the
locations are ordered based on the travel time.
Functions like geom_leg() and qmap() are used for the representation of the travel path.
Recommendation
As seen in Statistical Model, H-cluster does not provide balanced sales territories with single and complete linkage mode.
So, we have come up with advanced K-Means which deals with usage of H-cluster to form the initial clusters and then K-
Means to form balanced sales territories.
Initial Division of Territory Final Division of Territory
Steps we followed to get balanced territory:
•Using H-Cluster single linkage we divided the territory depending on the number of K(k =2).
•Then we prepared an algorithm (using k-means theory), and the algorithm works in following manner:
a) Randomly select cluster centers.
b) Calculate the distance between each data point and cluster centers.
c) Assign the data point to the cluster center whose distance from the cluster center is minimum of all the cluster centers.
d) Recalculate the new cluster center
e) Recalculate the distance between each data point and new obtained cluster centers.
f) If no data point is reassigned then stop, otherwise repeat from step c.
Business Intelligence & Analytics
http://www.stevens.edu/howe/academics/graduate/business-intelligence-analytics
Motivation
Define and align the most effective and balanced sales territories based on
geography and physician prescribing habits, in order to maximize promotion of new
medications.
Pharmaceutical companies spend millions of dollars annually on their sales force in
order to promote recently discovered medications, thereby increasing their company’s
revenue.
The sales force is aligned with geographical territories that are defined to maximize
representative effectiveness and reach, and minimize travel time, while providing
“fair” and approximately equal sales potential for each representative.
Technology
R for developing datamining , statistical and scoring models (e.g. market segmentations and
alignments).
Google Maps API for acquiring travel times between locations .
Excel for input and output delivery mechanisms.
Current & Future Work
Make travel plans for the representatives so that they can cover their targets in the shortest time
frame.
Optimize alignment of “sales force” in order to maximize “sales force effectiveness” and minimize
expenses.
Formation of sales territories based on the Physicians’ score/ranking. The scoring/ranking is modeled
based on the potential number of written prescriptions, using physicians’ and their patients’ profiles
(e.g. physicians specialty, patient pool and demographics).
Future work includes:
Developing a “recommender “ system for the sales force.
Overlapping sales forces (multiple sales forces covering the same territory).
Improving scoring models (e.g. utilization of neural networks).
Statistical Model
Latitude and longitude of all the addresses in the data are found out and distinct locations were extracted.
Alldata_df -> initial data
ddply() -> get distinct location
There are n locations and n^2 location combinations are formed where average time taken to travel between
locations are got.
R Package – ggmap
Mapdist() -> Finding out time travel
Mode – driving / walking / cycling
Clustering
Hierarchical Clustering to form sales territories:
•As the distance matrix is a self-defined distance function which contains the average time taken to travel from
one location to another, as.dist() function is used in hierarchical clustering.
•The cutree() functionality is implemented for dividing the tree formed by hclust, by specifying the number of
groups(k) and the height where the tree needs to be cut (h).
Here the hclust_output represents the cluster formed with hclust()
K= 2 represents the number of groups that the cluster needs to be split.
Method -> single/average/complete
distMatrix – Distance data matrix
Average Matrix
K-Means:
Google Maps Package – ggmap
geocode - getting latitude and longitude of a location
get_googlemap – accesses the Google Static Maps API to download a static map
geom_text - displays the location label of the corresponding markers in the map