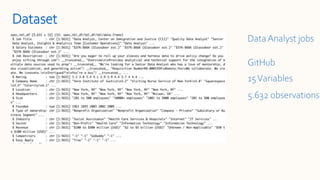
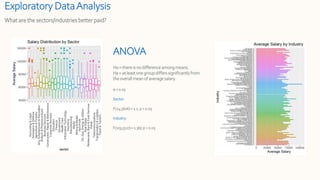
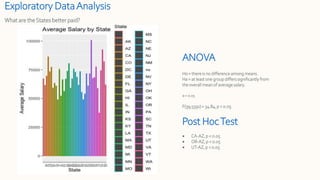
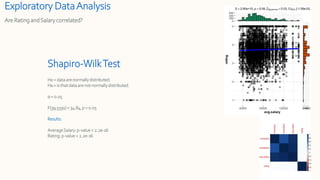
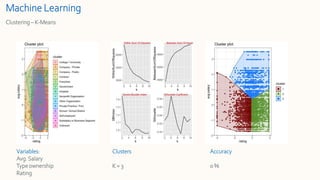
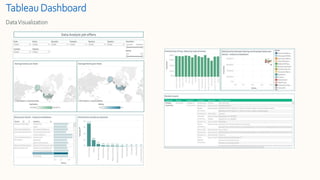
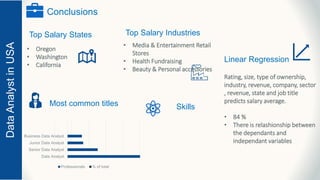
Data Analyst
Salary Prediction
Project
April 2022
Maria Gallardo
Higher Diploma in Science in Data
Analytics
Agenda
1. Introduction
2. Work Related
3. Methodology
4. Results
5. Conclusions
6. Q&A
1. Introduction
Help jobs seekers to
source Data Analyst jobs
based
on income more effectively
Exploratory Analysis
Machine Learning techniques
Tableau Dashboard
2. Work Related
Literature Review
1. Salary Prediction in the IT Job Market
with Few High-Dimensional Samples: A
Spanish Case Study
2. Faculty salary as a predictor of student
outgoing salaries from MBA programs
Appeal to the human condition
3. Benchmarking regression algorithms for
income prediction modeling,
3. Methodology
CRISP-DM
Dataset
15Variables
5.632 observations
GitHub
DataAnalyst jobs
Pre-processing Data • Removal unnecessary variables
• Salary and Stare column split
• Cleaned unnecessary characters & punctuation
• Cleaned noisy values (-1)
• NA values replaced by mean or mode
Data distribution minsalary Distribution by sector
4. Results
Exploratory Data Analysis
What State is hiring most?
What are the most common titles?
Number of jobs by State Most common job titles
Remote
R
Exploratory Data Analysis
What are the most frequent words in descriptions?
What are the most common programming language?
Exploratory DataAnalysis
What are the sectors/industries better paid?
ANOVA
H0 = thereis no difference amongmeans.
Ha = at least one group differs significantlyfrom
the overall mean of averagesalary.
α = 0.05
Sector:
F(24,5606) = 1.2, p > 0.05
Industry:
F(103,5527) = 1.367, p < 0.05
Exploratory DataAnalysis
What are theStates better paid?
ANOVA
H0 = thereis no difference amongmeans.
Ha = at least one group differs significantlyfrom
the overall mean of averagesalary.
α = 0.05
F(39,5591)= 34.84, p < 0.05
Post HocTest
 CA-AZ,p < 0.05
 OR-AZ, p < 0.05
 UT-AZ, p < 0.05
Exploratory DataAnalysis
Are Rating andSalary correlated?
Shapiro-WilkTest
H0 = dataare normallydistributed.
Ha = is that dataare not normallydistributed.
α = 0.05
F(39,5591)= 34.84, p < 0.05
Results:
AverageSalary: p-value < 2.2e-16
Rating: p-value< 2.2e-16
Machine Learning
Clustering – K-Means
Variables:
Avg.Salary
Type ownership
Rating
Clusters
K = 3
Accuracy
0 %
Machine Learning
Lineal Regression
Results:
Median & mean are zero
Residual standarderror = $19,170
Max salary= $150,000
MultipleR-squared= 84%
Hypothesis:
(H0) = dependent variable and independent
variable(s) haveno relationship
HA = dependent variable and independent
variable(s) haverelationship
α = 0.05
F(1.5,4422)= 6.337e-16, p < 0.05
Tableau Dashboard
DataVisualization
5. Conclusions
Data Analyst
Senior Data Analyst
Junior Data Analyst
Business Data Analyst
Professionals % of total
Conclusions
Top Salary States
Most common titles Skills
Data
Analyst
in
USA
• Oregon
• Washington
• California
Top Salary Industries
• Media & Entertainment Retail
Stores
• Health Fundraising
• Beauty & Personal accessories
Linear Regression
Rating, size, type of ownership,
industry, revenue, company, sector
, revenue, state and job title
predicts salary average.
• 84 %
• There is relashionship between
the dependants and
independant variables
6. Q&A
Thank you.

Salary prediction for data business analysis

  • 1.
    Data Analyst Salary Prediction Project April2022 Maria Gallardo Higher Diploma in Science in Data Analytics
  • 2.
    Agenda 1. Introduction 2. WorkRelated 3. Methodology 4. Results 5. Conclusions 6. Q&A
  • 3.
  • 4.
    Help jobs seekersto source Data Analyst jobs based on income more effectively Exploratory Analysis Machine Learning techniques Tableau Dashboard
  • 5.
  • 6.
    Literature Review 1. SalaryPrediction in the IT Job Market with Few High-Dimensional Samples: A Spanish Case Study 2. Faculty salary as a predictor of student outgoing salaries from MBA programs Appeal to the human condition 3. Benchmarking regression algorithms for income prediction modeling,
  • 7.
  • 8.
  • 9.
  • 10.
    Pre-processing Data •Removal unnecessary variables • Salary and Stare column split • Cleaned unnecessary characters & punctuation • Cleaned noisy values (-1) • NA values replaced by mean or mode Data distribution minsalary Distribution by sector
  • 11.
  • 12.
    Exploratory Data Analysis WhatState is hiring most? What are the most common titles? Number of jobs by State Most common job titles Remote R
  • 13.
    Exploratory Data Analysis Whatare the most frequent words in descriptions? What are the most common programming language?
  • 14.
    Exploratory DataAnalysis What arethe sectors/industries better paid? ANOVA H0 = thereis no difference amongmeans. Ha = at least one group differs significantlyfrom the overall mean of averagesalary. α = 0.05 Sector: F(24,5606) = 1.2, p > 0.05 Industry: F(103,5527) = 1.367, p < 0.05
  • 15.
    Exploratory DataAnalysis What aretheStates better paid? ANOVA H0 = thereis no difference amongmeans. Ha = at least one group differs significantlyfrom the overall mean of averagesalary. α = 0.05 F(39,5591)= 34.84, p < 0.05 Post HocTest  CA-AZ,p < 0.05  OR-AZ, p < 0.05  UT-AZ, p < 0.05
  • 16.
    Exploratory DataAnalysis Are RatingandSalary correlated? Shapiro-WilkTest H0 = dataare normallydistributed. Ha = is that dataare not normallydistributed. α = 0.05 F(39,5591)= 34.84, p < 0.05 Results: AverageSalary: p-value < 2.2e-16 Rating: p-value< 2.2e-16
  • 17.
    Machine Learning Clustering –K-Means Variables: Avg.Salary Type ownership Rating Clusters K = 3 Accuracy 0 %
  • 18.
    Machine Learning Lineal Regression Results: Median& mean are zero Residual standarderror = $19,170 Max salary= $150,000 MultipleR-squared= 84% Hypothesis: (H0) = dependent variable and independent variable(s) haveno relationship HA = dependent variable and independent variable(s) haverelationship α = 0.05 F(1.5,4422)= 6.337e-16, p < 0.05
  • 19.
  • 20.
  • 21.
    Data Analyst Senior DataAnalyst Junior Data Analyst Business Data Analyst Professionals % of total Conclusions Top Salary States Most common titles Skills Data Analyst in USA • Oregon • Washington • California Top Salary Industries • Media & Entertainment Retail Stores • Health Fundraising • Beauty & Personal accessories Linear Regression Rating, size, type of ownership, industry, revenue, company, sector , revenue, state and job title predicts salary average. • 84 % • There is relashionship between the dependants and independant variables
  • 22.
  • 23.