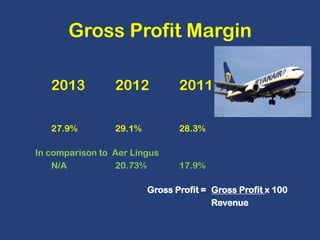
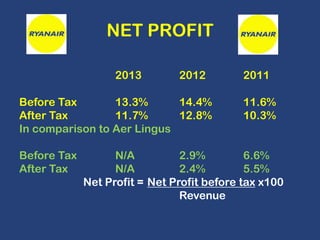
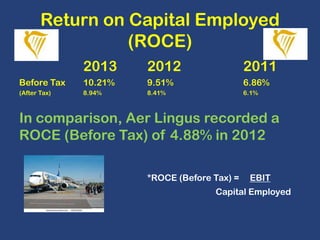
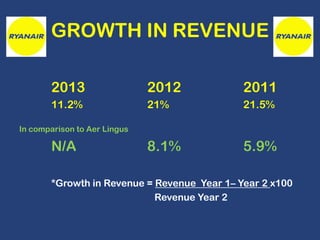
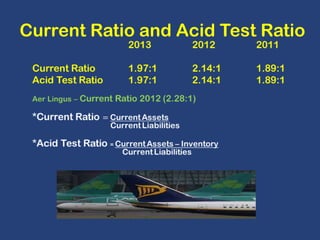
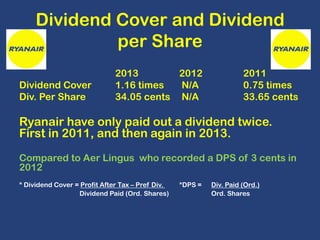
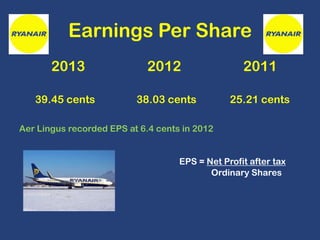
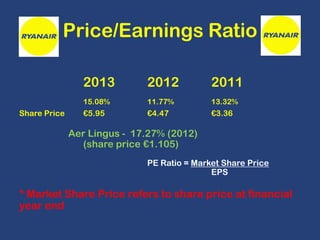
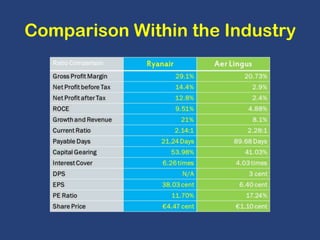
Analysis of
Ryanair Holdings Plc.
By

Ben o’Connor
Cian O’Brien
Darragh Wright
Sam mcEvoy
Introduction
Ryanair
•
•
•
•
•
•
•
•

Established in 1985
Michael O’Leary
€4.9bn Revenue 2013
180 airports
29 countries
1,611 routes
1,500+ daily departures
81.5m passengers p.a.
Profitability Ratios
Gross Profit Margin
2013

2012

2011

27.9%

29.1%

28.3%

In comparison to Aer Lingus
N/A
20.73%

17.9%

Gross Profit = Gross Profit x 100
Revenue
NET PROFIT
2013

2012

Before Tax
13.3%
14.4%
After Tax
11.7%
12.8%
In comparison to Aer Lingus
Before Tax
After Tax

2011
11.6%
10.3%

N/A
2.9%
6.6%
N/A
2.4%
5.5%
Net Profit = Net Profit before tax x100
Revenue
Return on Capital Employed
(ROCE)
2013

2012

2011

Before Tax

10.21%

9.51%

6.86%

(After Tax)

8.94%

8.41%

6.1%

In comparison, Aer Lingus recorded a
ROCE (Before Tax) of 4.88% in 2012
*ROCE (Before Tax) =

EBIT

Capital Employed
Growth Ratio
GROWTH IN REVENUE
2013

2012

2011

11.2%

21%

21.5%

8.1%

5.9%

In comparison to Aer Lingus

N/A

*Growth in Revenue = Revenue Year 1– Year 2 x100
Revenue Year 2
Liquidity Ratios
Current Ratio and Acid Test Ratio
Activity Ratios
Receivable And Payable Days
Gearing Ratios
Capital Gearing
2013

2012

2011

53.46%

53.98%

56.3%

Aer Lingus (2012) – 41.03%
Capital Gearing =

Non Current Liabilities
Capital Employed
Interest Cover
2013

2012

2011

7.23 times

6.26 times

5.2 times

In comparison to Aer Lingus’ Financial Report 2012: 4.03 times
Interest Cover = EBIT
Interest Expense
Investor Ratios
Dividend Cover and Dividend
per Share
Dividend Cover
Div. Per Share

2013
2012
1.16 times
N/A
34.05 cents N/A

2011
0.75 times
33.65 cents

Ryanair have only paid out a dividend twice.
First in 2011, and then again in 2013.
Compared to Aer Lingus who recorded a DPS of 3 cents in
2012
* Dividend Cover = Profit After Tax – Pref Div.
Dividend Paid (Ord. Shares)

*DPS =

Div. Paid (Ord.)
Ord. Shares
Earnings Per Share
2013

2012

2011

39.45 cents

38.03 cents

25.21 cents

Aer Lingus recorded EPS at 6.4 cents in 2012

EPS = Net Profit after tax
Ordinary Shares
Price/Earnings Ratio
2013

2011

15.08%

Share Price

2012
11.77%

13.32%

€5.95

€4.47

€3.36

Aer Lingus - 17.27% (2012)
(share price €1.105)
PE Ratio = Market Share Price
EPS

* Market Share Price refers to share price at financial
year end
Comparison Within the Industry
Year to Date Share Price Chart
THANKS FOR LISTENING

Ryanair holdings plc powerpoint (1)